Abstract
Background
Wear of polyethylene tibial inserts can decrease the longevity of total knee arthroplasty. Wear is currently assessed using laboratory methods that may not permit backside wear measurements or do not quantify surface deviation.
Questions/purposes
We developed and validated a technique to quantify polyethylene wear in tibial inserts using microcomputed tomography (micro-CT), a nondestructive high-resolution imaging technique that provides detailed images of surface geometry in addition to volumetric measurements.
Methods
Six unworn and six wear-simulated polyethylene tibial inserts were evaluated. Each insert was scanned three times using micro-CT at a resolution of 50 μm. The insert surface was reconstructed for each scan and the insert volume was calculated. Gravimetric analysis was performed for all inserts, and the micro-CT and gravimetric volumes were compared to determine accuracy. We created three-dimensional surface deviation maps.
Results
Micro-CT generated high-quality three-dimensional renderings of the insert surface geometry. Between-scan precision was 0.07%; we observed no difference between micro-CT and gravimetric volume measurements.
Conclusions
Micro-CT can provide precise and accurate volumetric measurements in addition to quantifiable three-dimensional surface deviation maps for the entire insert surface. The technique has the potential to evaluate wear in wear simulator trials and retrieval studies.
Clinical Relevance
This micro-CT technique combines the benefits of volumetric and surface scanning methods to quantify wear across all surfaces of polyethylene components with a single tool. When applied in wear simulator and retrieval studies, these measurements can be used to evaluate and predict the wear properties of the components.
Introduction
Damage assessment is key for studying polyethylene (PE) wear in TKA [11]. Methods currently used include gravimetric analysis, scanning electron microscopy, stereomicroscopy, and coordinate measuring machines (CMM) [4, 5, 12–14, 18]. Although these techniques have enabled valuable insights into PE wear, limitations remain. While gravimetric measures are considered the gold standard for wear assessment [2], CMM requires additional gravimetric measurements to quantify backside wear [14], a major contributor to PE wear in TKA [5, 10]. CMM measurements (obtained by probing equally spaced discrete points within a grid) provide excellent depth sensitivity but assess the surface at resolutions of only 500 to 750 μm [13, 14]. Other techniques such as scanning electron microscopy and stereomicroscopy characterize surface wear through visual inspection but do not provide quantitative data [13].
Microcomputed tomography (micro-CT) allows tissues, objects, and small animals to be scanned at resolutions of 10 to 100 μm [1, 16]. Recently, micro-CT was validated for use in the volumetric measurement of wear in retrieved PE acetabular liners from THA by Bowden et al. [3]. Limitations of that technique included low spatial resolution and limiting assumptions regarding the surface shape of the liners. Additionally, the manual technique used for registration of the acetabular liner images led to consequent uncertainty in the repeatability of the results. Should these limitations be overcome, micro-CT as a noncontact, nondestructive imaging technique could potentially quantify both volumetric PE wear and three-dimensional surface deviation.
To determine the suitability of micro-CT for wear analysis of tibial inserts from a wear simulator study we determined (1) the accuracy of micro-CT volume measurements against gravimetric analysis; (2) the precision of the micro-CT volume measurements; and (3) the feasibility of constructing quantifiable three-dimensional surface deviation maps using the micro-CT-derived insert surface geometry.
Materials and Methods
As a pilot study, the number of included inserts was limited to a sample of convenience. Six worn and six unworn inserts that were available from a previous wear simulator trial undertaken at our institution were selected. Both worn and unworn inserts were included to ensure that the wear damage scars would be visualized by micro-CT, and to allow the creation of a surface deviation map. To assess the first objective (accuracy), the difference between the volumes determined by micro-CT and gold standard gravimetric analysis was determined. To assess the second objective (precision), the variability in the calculated volumes from multiple scans of the same insert was calculated. To assess the third objective (feasibility of deviation map creation), the surface geometry of a worn insert was coaligned with an unworn reference geometry, and the calculated deviations were compared with those observed visually.
All 12 inserts were the Anatomic Modular Knee (DePuy, Warsaw, IN). The six worn inserts underwent 5.5 million cycles at a frequency of 1 Hz in a six-station knee simulator (Model KS3-6-1000; AMTI, Watertown, MA) with applied load and motion. All were the cruciate-retaining model of 10 mm thickness and were sterilized using gas plasma, causing no crosslinking. The physiological load, flexion-extension motion, and AP translation waveforms used in the wear simulation were taken from the recommended ISO-14243-3 kinematics [8].
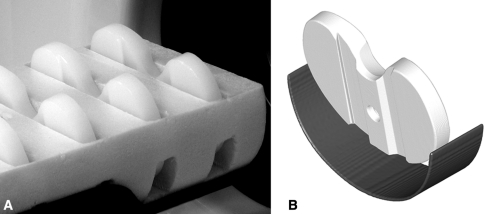
A dedicated laboratory micro-CT scanner was used for this study (eXplore Vision 120; GE Healthcare, London, Ontario, Canada). Each insert was scanned three times and was removed and repositioned in the scanner bed between each scan to determine the precision of the scanner. The inserts were placed in the bed inside a radiotranslucent polystyrene foam holder at a double-oblique angle of approximately 10° backward vertically and 3° laterally (Fig. 1). In preliminary work we determined the inserts were susceptible to artifact when positioned coplanar to the transverse CT reconstruction plane; this small angulation eliminated the problem. Inserts were scanned at 50 μm resolution over 1200 views in 0.3° increments with 10 frames averaged per view. The xray tube voltage was set to 90 kVp with a current of 40 mA. Scan times were approximately 95 minutes. For each scan, the region including the insert was reconstructed at the full 50-μm isotropic resolution.
Fig. 1A–B.
(A) Photograph of inserts held in foam on the bed of the scanner and (B) a rendered image of the insert in the bed at a double-oblique angle of approximately 10° backward vertically and 3° laterally. The foam that held the inserts is radiotranslucent and does not appear in the reconstructed scan images.
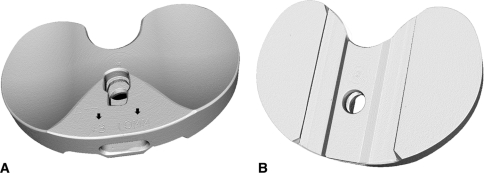
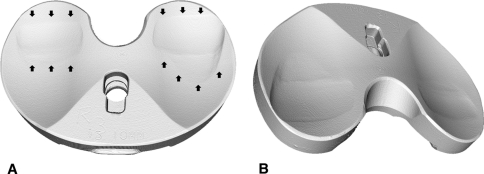
The reconstructed scan images of the inserts were analyzed with dedicated three-dimensional micro-CT analysis software (MicroView v2.2; GE Healthcare). A region-growing algorithm was then applied to the area of the insert. The insert geometry was converted to a temporary region of interest (ROI), and everything outside of the ROI was set to a background value of −1000 Hounsfield units (HU). A new ROI encompassing the entire volume was then selected, and isosurface rendering was performed with a threshold of −664 HU using the highest possible quality and without decimation. The threshold of −664 HU was selected based on examination of the intensity histograms from a selection of the reconstructed scans as described by Otsu et al. [15] for which the autothreshold level ranged from approximately −674 to −648 HU. This threshold may vary depending on the type and manufacturer of the polyethylene. The three-dimensional rendered insert volume (mm3) was recorded, and the surface was visually inspected for quality. The unworn surface was inspected for consistency and for the presence of the manufacturer’s markings (Fig. 2), while the worn surface was also inspected for the presence of damage scars from the wear testing (Fig. 3).
Fig. 2A–B.
Three-dimensional rendered volume images of an unworn tibial insert scanned with microcomputed tomography, including the (A) bearing surface and (B) backside. Note the “#3” and “10MM” embossed by the manufacturer in (A) (arrows).
Fig. 3A–B.
(A) Rendered volume images of a worn tibial insert scanned with microcomputed tomography. (B) Worn areas are clearly visible on the bearing surfaces in both (A) (marked with arrows) and (B).
Gravimetric analysis was performed for all inserts with each insert weighed three times on a high-precision scale (AX205; Mettler-Toledo GmbH, Greifensee, Switzerland). The scale was certified accurate to 0.1 mg and was calibrated before use. The gravimetric mass was converted to volume for each insert by dividing the mass in grams by the known density of the insert (0.935 mg/mm3).
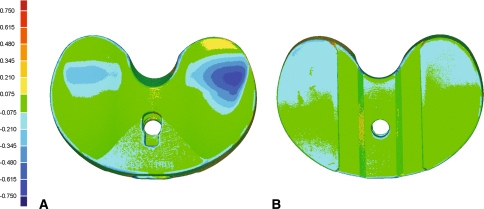
To determine the feasibility of creating surface deviation maps from the micro-CT images, the surface volumes of one unworn and one worn insert were imported into Geomagic Qualify (Geomagic Inc, Research Triangle Park, NC). Qualify is a commercial software package that allows quantitative comparisons between three-dimensional models. The unworn insert was set as the reference object with the worn insert as the test object. An iterative best-fit alignment was performed using the standard Qualify coalignment method, in which 300 random points on the test object (worn insert) were aligned and realigned to the reference object (unworn insert). A second best-fit alignment using 1500 random points was then performed using fine adjustments only. Finally, a three-dimensional comparison was then performed to determine the deviation between the two coaligned insert surfaces.
Mean insert volume across the three scans of each insert was calculated along with SD. These values were also calculated using the volumes determined through gravimetric analysis. The volume data were first examined for normal distribution using the Kolmogorov-Smirnov test. To determine the accuracy of the micro-CT technique we calculated the absolute and percent differences between the micro-CT and gravimetric volumes for the worn and unworn groups and compared volumes for the two methods using paired t tests. The between-scan coefficient of variation (COV) was used as a measure of scanner precision (second objective). The COV was determined for each insert by dividing the SD by the mean volume.
Results
The volumes determined from micro-CT were accurate compared to the volume measurements from the gravimetric analysis. The mean volume of the six unworn inserts was measured by micro-CT as 20,588 ± 70 mm3 and by gravimetric analysis as 20,579 ± 63 mm3 (Fig. 4A). The mean difference between the two measurement techniques was 9.2 mm3 for an unworn group accuracy of 0.04%. We observed no differences (p = 0.24) between the gravimetric and micro-CT volumes. The mean volume of the six worn inserts was measured by micro-CT as 20,491 ± 99 mm3 and by gravimetric analysis as 20,484 ± 100 mm3 (Fig. 4B). The mean difference between the two measurements for the worn inserts was 6.2 mm3 for a worn group accuracy of 0.03%. Again, no substantial differences (p = 0.13) were found between the two.
Fig. 4A–B.
Mean volume of the six unworn inserts (UA through UF) as measured by (A) gravimetric analysis and microcomputed tomography (micro-CT) and (B) mean volume of the six worn inserts (WA through WF) as measured by gravimetric analysis and micro-CT. Bars are SD.
The micro-CT measurements were precise with low COV. The mean volume SD between scans was 15.2 mm3 for the unworn inserts with a range of 2.0 to 22.4 mm3. The mean between-scan COV for these inserts was 0.07% and ranged from 0.01% to 0.11%. For the worn inserts, the mean volume SD between scans was 13.8 mm3 with a range of 2.6 to 28.8 mm3. The mean worn insert between-scan COV was also 0.07% with a range of 0.01% to 0.14%. Therefore, the overall scanner precision was 0.07%.
A surface deviation map for one of the worn inserts was readily obtained from the highly detailed three-dimensional renderings of the insert surfaces. All geometric features of the inserts, including the articular and backside surfaces, were reproduced. The small lettering embossed by the manufacturer to label the size and thickness of the insert was clearly visible in the reconstructed surfaces (Fig. 2A) as were labels engraved during the wear simulator study (to track where each insert was placed within the simulator itself). The three-dimensional comparison revealed a maximum negative deviation of 0.696 mm (Fig. 5). Focal regions of deviations were observed on the articular surface, where the negative deviations ranged from 0.075 mm to the maximum negative deviation of 0.696 mm (Fig. 5A). Backside deviations were also observed with negative deviations of 0.075 to 0.345 mm (Fig. 5B). Regions of wear on the worn inserts were visible in both the micro-CT-rendered images (Fig. 3A) and surface deviation maps (Fig. 5). The regions corresponded well with wear on the actual insert (as observed through visual inspection).
Fig. 5A–B.
Surface deviation map for one of the six worn inserts versus an unworn insert for the (A) bearing surfaces and (B) backside. Measured deviations are in millimeters.
Discussion
Numerous techniques have been developed to assess PE wear in TKA during simulator trials and retrieval studies [4, 5, 12–14, 18], but these are associated with certain limitations. Recently, the use of micro-CT imaging has become widespread [1, 16], including for wear assessment in retrieved PE liners [3, 19]. We sought to validate the use of micro-CT for PE wear assessment in tibial inserts. Our specific objectives were to determine (1) the accuracy of micro-CT volume measurements against gravimetric analysis; (2) the precision of the micro-CT volume measurements; and (3) the feasibility of constructing quantifiable three-dimensional surface deviation maps using the micro-CT-derived insert surface geometry.
We acknowledge certain limitations of our study. First, examining the same group of inserts before and after a wear simulator trial could potentially have enhanced the validation of the micro-CT technique. However, the primary aim of this study was to determine the precision and accuracy of PE tibial insert volumetric measurements by micro-CT, not to directly measure the actual wear volume that occurred during wear simulation. Posttest tibial inserts have been used to validate the CMM technique in the literature [2]. Likewise, the three-dimensional deviation map in this study was constructed to determine the feasibility of its construction rather than obtain highly accurate wear measurements. For actual wear analysis using the three-dimensional deviation map, the worn insert should be compared with its preworn self, rather than a different unworn insert, to minimize any potential errors resulting from manufacturing variability of the inserts. Second, we assumed the true insert volumes were the volumes obtained through gravimetric analysis. The accuracy of this assumption is limited by the calibration of the scale and the density used to convert the insert mass to volume; however, gravimetric analysis is widely recognized for its superior precision and accuracy [2]. Third, micro-CT parameters such as voxel spacing must be calibrated and assessed for accuracy. In the case of this study, we observed excellent agreement between the gravimetric and micro-CT volumes, suggesting that the 50-μm voxel spacing used here was appropriate. Our voxel spacing was three times greater than a micro-CT study of retrieved acetabular liners by Bowden et al. [3]. If a consistent discrepancy was apparent between the two volumes, then the system can be recalibrated to bring the volumes into agreement (using isotropic scaling factors) and still retain the value of the micro-CT-derived surface geometry.
Micro-CT was accurate with no difference in volumetric measurements versus gravimetric analysis. Bowden et al. [3] also found micro-CT volume measurements (of retrieved acetabular liners) to be accurate against gravimetric analysis. We improved on their methods by automating the volumetric rendering, removing the observer variability that has been reported as high as 53% [3]. One advantage of micro-CT over gravimetric analysis is the generation of quantifiable three-dimensional surface deviation maps in addition to highly accurate volumetric measurements. Another advantage is that load-soaked controls (used by gravimetric analysis in wear simulator trials) may not be necessary for micro-CT. Fluid absorbed during the trials enters the free volume within the noncrosslinked PE and thus alters the density but not the surface geometry [13]. Similarly, CMM is reportedly accurate against gravimetric analysis and does not require load-soaked controls [13]. However, CMM may not directly quantify backside wear and has a lower surface sampling resolution than micro-CT [13, 14].
Micro-CT was also precise with a mean between-scan volume variation of 0.07%, or approximately 15 mm3. Both scanner noise and repositioning of the inserts between scans contributed to this variation. Performing the scans at a greater resolution without repositioning would likely increase precision, and averaging insert surfaces across multiple scans will ensure the highest possible accuracy. The variation is still less than the volume of wear obtained in wear simulator studies, reported as 32 mm3 and 161 mm3 over seven million cycles for highly crosslinked PE and ultrahigh-molecular-weight PE, respectively [14]. Wear volumes in inserts retrieved from patients after years in situ may be even higher, at 85 mm3 per year [9]. The repeatability of micro-CT volume measurements exceeds fluid displacement (less than 10%) [3] and may exceed the precision of certain CMM techniques (0.8%) [7] but remains lower than gravimetric analysis [2]. Fortunately, the nondestructive micro-CT analysis is easily combined with gravimetric analysis, retaining the advantages of both techniques.
Creation of surface deviation maps is feasible using the detailed three-dimensional renderings of the insert surface provided by micro-CT. All of the insert features in the reconstructed images corresponded to the actual insert surface. Surface deviation maps have also been successfully constructed using CMM [2, 13]. However, micro-CT provides surface sampling resolution 10 to 15 times greater than tibial insert geometries obtained with CMM (50 versus 500–750 μm) [13, 14]. This order of magnitude increase in linear sampling density results in over 100 times as many samples over the surface area of the insert when compared with CMM. Deviation maps are the primary advantage of micro-CT, because they will allow quantification of focal surface deviation caused by various wear modes rather than providing a global estimate of wear. These deviation maps have immediate application in wear simulator and retrieval studies for all types of PE-based joint arthroplasty [19]. Additional applications of the geometry include reverse engineering of insert surfaces for comparison to manufacturer’s CAD drawings or to generate CAD models and other reference geometries where they were previously unavailable. These geometries could also be used in finite element analysis and computer simulations of wear [6, 17]. In the longer term, it may be possible to combine insert geometry derived from micro-CT with patient imaging techniques such as CT or radiostereometric analysis to more accurately measure PE wear in vivo. Determination of the linear precision of the micro-CT technique and the effects of creep on the deviation maps is required and are currently being investigated.
The micro-CT wear measurement technique described in this study has the potential to be used for both wear simulator and retrieval studies. Micro-CT provides highly detailed three-dimensional surface geometry of the entire tibial insert capable of generating quantifiable surface deviation maps in addition to precise and accurate volumetric measurements. This micro-CT technique combines the benefits of gravimetric analysis (volume measurements) with CMM (localized surface assessment) to quantify wear across all surfaces of polyethylene components with a single tool. When applied to wear simulator and retrieval studies, these measurements can be used to evaluate and predict the wear properties of the components.
Acknowledgments
We thank Jaques Milner and Hristo Nikolov for their technical assistance, and Kory Charron for the wear simulator study.
Footnotes
One or more of the authors or the department with which they are affiliated have received institutional and/or research support from DePuy Orthopaedics (SJM); Smith & Nephew (DDRN); Stryker (DDRN); the Canadian Institutes of Health Research (#MOP-89852) (DDRN, DWH); a Frederick Banting and Charles Best Canada Graduate Scholarship from the Canadian Institutes of Health Research (MGT) and is supported in part by the Joint Motion Program–A CIHR Training Program in Musculoskeletal Health Research and Leadership (MGT); an Ontario Graduate Scholarship (DDM); the Dr Sandy Kirkley Chair for Musculoskeletal Research at the Schulich School of Medicine and Dentistry (DWH).
This work was performed at The University of Western Ontario, London, Ontario, Canada.
References
- 1.Badea CT, Drangova M, Holdsworth DW, Johnson GA. In vivo small-animal imaging using micro-CT and digital subtraction angiography. Phys Med Biol. 2008;53:R319–R350. doi: 10.1088/0031-9155/53/19/R01. [DOI] [PMC free article] [PubMed] [Google Scholar]
- 2.Blunt L, Bills P, Jiang X, Chakrabarty G. Improvement in the assessment of wear of total knee replacements using coordinate-measuring machine techniques. Proc Inst Mech Eng H. 2008;222:309–318. doi: 10.1243/09544119JEIM289. [DOI] [PubMed] [Google Scholar]
- 3.Bowden A, Kurtz S, Edidin A. Validation of a micro-CT technique for measuring volumetric wear in retrieved acetabular liners. J Biomed Mater Res. 2005;75B:205–209. doi: 10.1002/jbm.b.30318. [DOI] [PubMed] [Google Scholar]
- 4.Collier M, Engh C, Hatten K, Ginn S, Sheils T, Engh G. Radiographic assessment of the thickness lost from polyethylene tibial inserts that had been sterilized differently. J Bone Joint Surg Am. 2008;90:1543–1552. doi: 10.2106/JBJS.G.00651. [DOI] [PubMed] [Google Scholar]
- 5.Conditt MA, Stein JA, Noble PC. Factors affecting the severity of backside wear of modular tibial inserts. J Bone Joint Surg Am. 2004;86:305–311. doi: 10.2106/00004623-200402000-00013. [DOI] [PubMed] [Google Scholar]
- 6.Fregly B, Sawyer W, Harman M, Banks S. Computational wear prediction of a total knee replacement from in vivo kinematics. J Biomech. 2005;38:305–314. doi: 10.1016/j.jbiomech.2004.02.013. [DOI] [PubMed] [Google Scholar]
- 7.Hansen HN, Bariani P, Chiffre L. Modelling and measurement uncertainty estimation for integrated AFM-CMM instrument. CIRP Ann - Manuf Tech. 2005;54:531–534. doi: 10.1016/S0007-8506(07)60162-0. [DOI] [Google Scholar]
- 8.ISO-14242-3. Implants for Surgery: Wear of total knee joint prostheses. Part 3: Loading and displacement parameters for wear testing machines with displacement control and corresponding environmental conditions for testing. International Organization for Standardization, London. Available at: http://www.iso.org/iso/catalogue_detail.htm?csnumber=32161. Accessed January 15, 2009.
- 9.Kop A, Swarts E. Quantification of polyethylene degradation in mobile bearing knees: a retrieval analysis of the Anterior-Posterior-Glide (APG) and Rotating Platform (RP) Low Contact Stress (LCS) knee. Acta Orthop. 2007;78:364–370. doi: 10.1080/17453670710013942. [DOI] [PubMed] [Google Scholar]
- 10.Li S, Scuderi G, Furman BD, Bhattacharyya S, Schmieg JJ, Insall JN. Assessment of backside wear from the analysis of 55 retrieved tibial inserts. Clin Orthop Relat Res. 2002(404):75-82. [DOI] [PubMed]
- 11.McKellop H. The lexicon of polyethylene wear in artificial joints. Biomaterials. 2007;28:5049–5057. doi: 10.1016/j.biomaterials.2007.07.040. [DOI] [PubMed] [Google Scholar]
- 12.McKellop H, Clarke IC, Markolf KL, Amstutz HC. Wear characteristics of UHMW polyethylene: a method for accurately measuring extremely low wear rates. J Biomed Mater Res. 1978;12:895–927. doi: 10.1002/jbm.820120611. [DOI] [PubMed] [Google Scholar]
- 13.Muratoglu O, Perinchief R, Bragdon C, O’Connor D, Konrad R, Harris W. Metrology to quantify wear and creep of polyethylene tibial knee inserts. Clin Orthop Relat Res. 2003;410:155–164. doi: 10.1097/01.blo.0000063604.67412.04. [DOI] [PubMed] [Google Scholar]
- 14.Muratoglu O, Rubash H, Bragdon C, Burroughs B, Huang A, Harris W. Simulated normal gait wear testing of a highly cross-linked polyethylene tibial insert. J Arthroplasty. 2007;22:435–444. doi: 10.1016/j.arth.2006.07.014. [DOI] [PubMed] [Google Scholar]
- 15.Otsu N. Threshold selection method from gray-level histograms. IEEE Trans Syst Man Cybern. 1979;SMC-9:62–66. [Google Scholar]
- 16.Ritman E. Micro-computed tomography—current status and developments. Ann Rev Biomed Eng. 2004;6:185–208. doi: 10.1146/annurev.bioeng.6.040803.140130. [DOI] [PubMed] [Google Scholar]
- 17.Strickland MA, Taylor M. In-silico wear prediction for knee replacements-methodology and corroboration. J Biomech. 2009;20:20. doi: 10.1016/j.jbiomech.2009.04.022. [DOI] [PubMed] [Google Scholar]
- 18.Tamura J, Clarke IC, Kawanabe K, Akagi M, Good VD, Williams PA, Masaoka T, Schroeder D, Oonishi H. Micro-wear patterns on UHMWPE tibial inserts in total knee joint simulation. J Biomed Mater Res. 2002;61:218–225. doi: 10.1002/jbm.10027. [DOI] [PubMed] [Google Scholar]
- 19.Teeter MG, Naudie DDR, Charron KD, Holdsworth DW. Three-dimensional surface deviation maps for analysis of retrieved polyethylene acetabular liners using micro-computed tomography. J Arthroplasty. 2010;25:330–332. doi: 10.1016/j.arth.2009.11.001. [DOI] [PubMed] [Google Scholar]


