The reduced adenosine-induced biventricular vasoreactivity in patients with idiopathic pulmonary arterial hypertension (PAH) and patients with scleroderma-related PAH is closely correlated to increased right ventricular (RV) workload and RV dysfunction, suggesting that reduced myocardial perfusion reserve may contribute to RV dysfunction in patients with PAH.
Abstract
Purpose:
To evaluate the relationships of right ventricular (RV) and left ventricular (LV) myocardial perfusion reserves with ventricular function and pulmonary hemodynamics in patients with pulmonary arterial hypertension (PAH) by using adenosine stress perfusion cardiac magnetic resonance (MR) imaging.
Materials and Methods:
This HIPAA-compliant study was institutional review board approved. Twenty-five patients known or suspected to have PAH underwent right heart catheterization and adenosine stress MR imaging on the same day. Sixteen matched healthy control subjects underwent cardiac MR imaging only. RV and LV perfusion values at rest and at adenosine-induced stress were calculated by using the Fermi function model. The MR imaging–derived RV and LV functional data were calculated by using dedicated software. Statistical testing included Kruskal-Wallis tests for continuous data, Spearman rank correlation tests, and multiple linear regression analyses.
Results:
Seventeen of the 25 patients had PAH: 11 with scleroderma-associated PAH, and six with idiopathic PAH. The remaining eight patients had scleroderma without PAH. The myocardial perfusion reserve indexes (MPRIs) in the PAH group (median RV MPRI, 1.7 [25th–75th percentile range, 1.3–2.0]; median LV MPRI, 1.8 [25th–75th percentile range, 1.6–2.1]) were significantly lower than those in the scleroderma non-PAH (median RV MPRI, 2.5 [25th–75th percentile range, 1.8–3.9] [P = .03]; median LV MPRI, 4.1 [25th–75th percentile range, 2.6–4.8] [P = .0003]) and control (median RV MPRI, 2.9 [25th–75th percentile range, 2.6–3.6] [P < .01]; median LV MPRI, 3.6 [25th–75th percentile range, 2.7–4.1] [P < .01]) groups. There were significant correlations between biventricular MPRI and both mean pulmonary arterial pressure (mPAP) (RV MPRI: ρ = −0.59, Bonferroni P = .036; LV MPRI: ρ = −0.79, Bonferroni P < .002) and RV stroke work index (RV MPRI: ρ = −0.63, Bonferroni P = .01; LV MPRI: ρ = −0.75, Bonferroni P < .002). In linear regression analysis, mPAP and RV ejection fraction were independent predictors of RV MPRI. mPAP was an independent predictor of LV MPRI.
Conclusion:
Biventricular vasoreactivity is significantly reduced with PAH and inversely correlated with RV workload and ejection fraction, suggesting that reduced myocardial perfusion reserve may contribute to RV dysfunction in patients with PAH.
© RSNA, 2010
Introduction
Pulmonary arterial hypertension (PAH) is a syndrome that results from restricted blood flow through the pulmonary arterial circulation, which ultimately leads to right heart failure and death (1). The prognosis of patients with PAH remains poor, with approximately 10%–15% mortality within 1 year of the diagnosis despite the administration of advanced therapy (2,3). Right ventricular (RV) function is the most important determinant of survival with PAH (1).
In normal conditions, the RV mass is substantially lower than the left ventricular (LV) mass (1:3 ratio) (4). However, a sustained increase in RV afterload results in increased RV workload, RV hypertrophy, and remodeling in patients with PAH. Although increased RV workload might necessitate enhanced RV myocardial perfusion and oxygen consumption (4,5), a reduction in systolic flow in the right coronary artery has been reported in patients with PAH and has been attributed to increased RV mass and increased RV systolic pressure (6,7). RV ischemia in PAH is thought to be due to an increase in cardiac mass, which is not accompanied by a proportionate increase in the cross-sectional area of the coronary vessels that supply the hypertrophied ventricle (8). Therefore, a reduction in myocardial perfusion per gram of tissue may contribute to RV dysfunction and failure in patients with PAH.
There is a paucity of human and animal studies that address RV perfusion in the setting of increased pulmonary vascular resistance. A direct correlation between the RV ischemia suggested by myocardial scintigraphic findings and the RV dysfunction in patients with idiopathic PAH has been observed (9,10). Myocardial blood flow was increased at rest in the hypertrophied RV myocardium in a pony model of pulmonary arterial banding; however, this occurred at the expense of curtailed RV coronary vascular reserve (5).
The role of biventricular myocardial perfusion reserve in response to increased pulmonary pressure and the resulting RV remodeling and dysfunction in humans remains unclear. We hypothesized that there was a correlation between RV function and myocardial perfusion in patients with PAH, and, therefore, we evaluated the relationships of RV and LV myocardial perfusion with ventricular function and pulmonary hemodynamics in patients known or suspected to have PAH by using adenosine stress perfusion cardiac magnetic resonance (MR) imaging.
Materials and Methods
Patient Population and Study Design
This prospective, Health Insurance Portability and Accountability Act–compliant study was approved by the institutional review board of Johns Hopkins University School of Medicine. Written informed consent was obtained from all participants. Between January 2007 and March 2009, a total of 33 patients who were referred for evaluation of clinically known or suspected pulmonary hypertension were examined with adenosine stress cardiac MR imaging and right heart catheterization (RHC), which were performed on the same day. All patients were part of a screening program to detect pulmonary hypertension and therefore underwent clinically indicated RHC. The criteria for exclusion from our study were contraindications to adenosine, incomplete MR imaging examination, and nondiagnostic MR image quality. Three patients were excluded from the analysis because of breathing artifacts that substantially affected the cardiac MR image quality. An additional five patients were excluded because they could not complete the entire MR imaging protocol owing to noncompliance or claustrophobia (n = 2) or contraindications to adenosine (n = 3, resting arterial systolic blood pressure < 100 mm Hg). Thus, the study sample consisted of 25 patients aged 45–80 years (mean age, 60.1 years ± 9.1 [standard deviation]); the majority of them were women (n = 22 [88%]), reflecting the known higher prevalence of PAH among women (11).
In addition, 16 healthy age- and sex-matched volunteers (mean age, 53.3 years ± 6.1; 10 female) underwent MR imaging with the same imaging protocol used for the patients. The volunteers were not examined with RHC. These individuals were screened with use of a questionnaire to determine the potential known causes of PAH as exclusion criteria (ie, scleroderma, rheumatoid arthritis, systemic lupus erythematosus, sickle cell disease, chronic obstructive lung disease, human immunodeficiency virus, sleep apnea). A lipid profile was also obtained, and the Framingham cardiovascular risk score was calculated (12). Other exclusion criteria for this control group were diabetes, smoking, hypertension, and a greater than 10% Framingham 10-year risk. Nine volunteers had been excluded on the basis of the screening criteria.
On the basis of hemodynamic measurements, the 25 patients were divided into two groups: non-PAH (mean pulmonary arterial pressure [mPAP] ≤ 25 mm Hg, n = 8) and PAH (mPAP > 25 mm Hg, pulmonary capillary wedge pressure < 15 mm Hg; n = 17) (13). In all patients, RHC was performed with fluoroscopic guidance as previously described (14). All patients completed the RHC procedure without complications.
MR Imaging
In all study participants, cardiac stress perfusion MR imaging was performed with a 3-T imager (Siemens Trio; Siemens, Erlangen, Germany). We induced stress by infusing adenosine at a rate of 140 μg per kilogram of body weight per minute. After 3 minutes, gadopentetate dimeglumine (Magnevist; Bayer Schering Pharma, Berlin, Germany) was injected at a dose of 0.025 mmol per kilogram of body weight, which was followed immediately by a 20-mL normal saline flush; both were injected at a rate of 5 mL/sec. The images were obtained by using saturation-recovery gradient-echo cardiac MR imaging with the following parameters: 2.1/1.05 (repetition time msec/echo time msec), a 12° flip angle, a minimal field of view, a matrix of 192 × 116, an in-plane spatial resolution ranging from 1.7 × 2.1 mm to 2.1 × 2.5 mm, an acquisition duration of 175 msec, a section thickness of 10 mm, and a generalized autocalibrating partially parallel acquisition acceleration factor of two. Two short-axis sections were acquired during 80 heart beats. The basal short-axis section was acquired during systole of one heart beat, and the middle short-axis section was acquired during systole of the following heart beat in an alternating fashion—one section per beat—to result in a temporal resolution of two R-R intervals for each section. We imaged the patients during systole because of the higher biventricular wall thickness at systole compared with that at diastole. At-rest perfusion MR images were obtained at least 10 minutes after the stress perfusion MR images were obtained.
Cine MR images were acquired by using a retrospective electrocardiographically gated turbo fast low-angle shot segmented gradient-echo sequence. These segmented gradient-echo turbo fast low-angle shot cine images were acquired by using 6.5/3.2, a flip angle of 15°, a bandwidth of 260 Hz/pixel, a generalized autocalibrating partially parallel acquisition acceleration factor of two, seven segments, a section thickness of 8 mm, a matrix of 256 × 192, a minimal field of view, an in-plane spatial resolution ranging from 1.3 × 1.3 mm to 1.6 × 1.6 mm, an acquired temporal resolution of 40 msec, and 30 reconstructed cardiac phases. Short- and long-axis segmented inversion-recovery gradient-echo delayed-enhancement MR images were also obtained in each participant after a total gadopentetate dimeglumine dose of 0.2 mmol/kg was administered (15).
MR Imaging Analysis
For absolute quantification of myocardial blood flow, perfusion maps were generated at rest and during adenosine-induced stress on a pixel-by-pixel basis by using the Fermi function model and dedicated software (16–18). Before the perfusion maps were generated, motion correction and denoising were performed as previously described (19,20). When necessary (in 19 of the 41 participants), we also performed separate motion corrections that were optimized for each ventricle to minimize the motion between time points. For the arterial input function measurement, a region of interest was placed in the LV cavity. On the short-axis gradient-echo perfusion MR images, two regions of interest, outlining the RV and LV walls, were drawn. These regions of interest were then copied onto the perfusion maps (Fig 1). On the two short-axis sections, 75% of the RV myocardial volume could be analyzed for the myocardial perfusion analysis. This is similar to the work of Plein et al (21), who demonstrated that 72% of RV segments could be analyzed by using a high-spatial-resolution perfusion MR sequence at 3 T. The septum was considered a part of the LV.
Figure 1a:
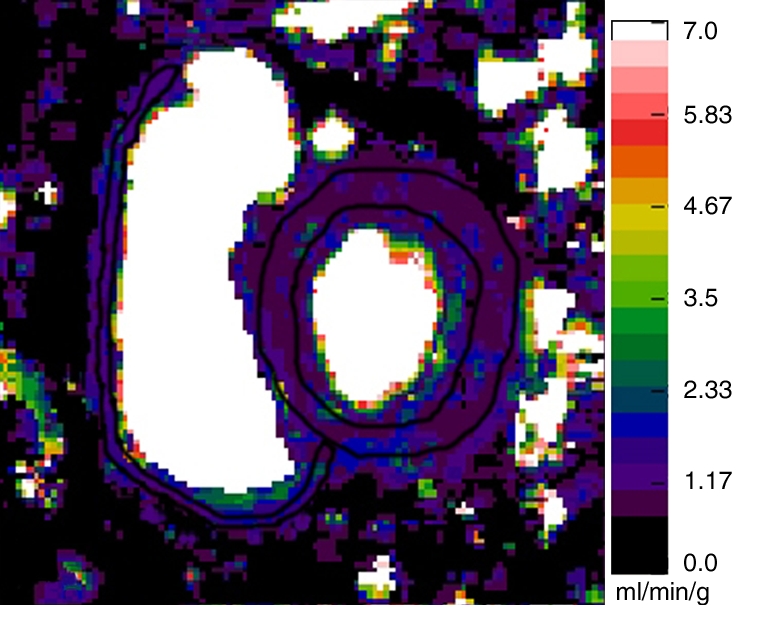
Representative short-axis perfusion maps show RV and LV regions of interest in (a, b) healthy control subject and (c, d) patient with PAH (mPAP, 45 mm Hg; pulmonary capillary wedge pressure, 10 mm Hg) at rest (a, c) and during adenosine-induced stress (b, d). Perfusion scales are at right. There were significantly lower RV and LV myocardial perfusion reserve indexes (MPRIs) in the PAH group than in the healthy control group (Table 1). Also note the RV remodeling in c and d.
Figure 1b:
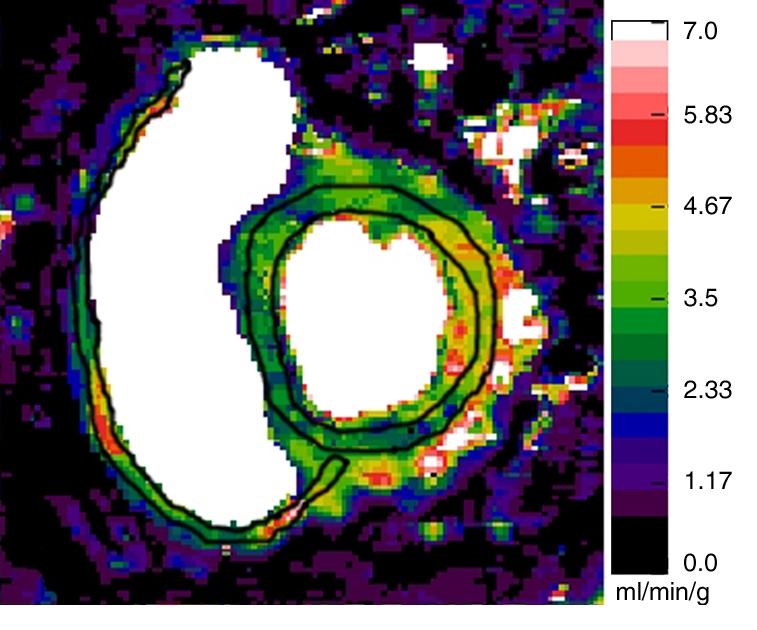
Representative short-axis perfusion maps show RV and LV regions of interest in (a, b) healthy control subject and (c, d) patient with PAH (mPAP, 45 mm Hg; pulmonary capillary wedge pressure, 10 mm Hg) at rest (a, c) and during adenosine-induced stress (b, d). Perfusion scales are at right. There were significantly lower RV and LV myocardial perfusion reserve indexes (MPRIs) in the PAH group than in the healthy control group (Table 1). Also note the RV remodeling in c and d.
Figure 1c:
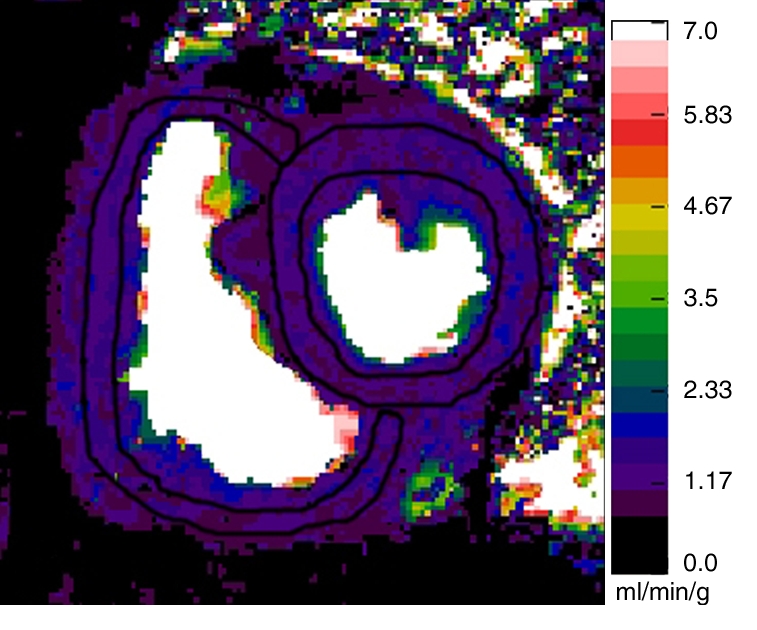
Representative short-axis perfusion maps show RV and LV regions of interest in (a, b) healthy control subject and (c, d) patient with PAH (mPAP, 45 mm Hg; pulmonary capillary wedge pressure, 10 mm Hg) at rest (a, c) and during adenosine-induced stress (b, d). Perfusion scales are at right. There were significantly lower RV and LV myocardial perfusion reserve indexes (MPRIs) in the PAH group than in the healthy control group (Table 1). Also note the RV remodeling in c and d.
Figure 1d:
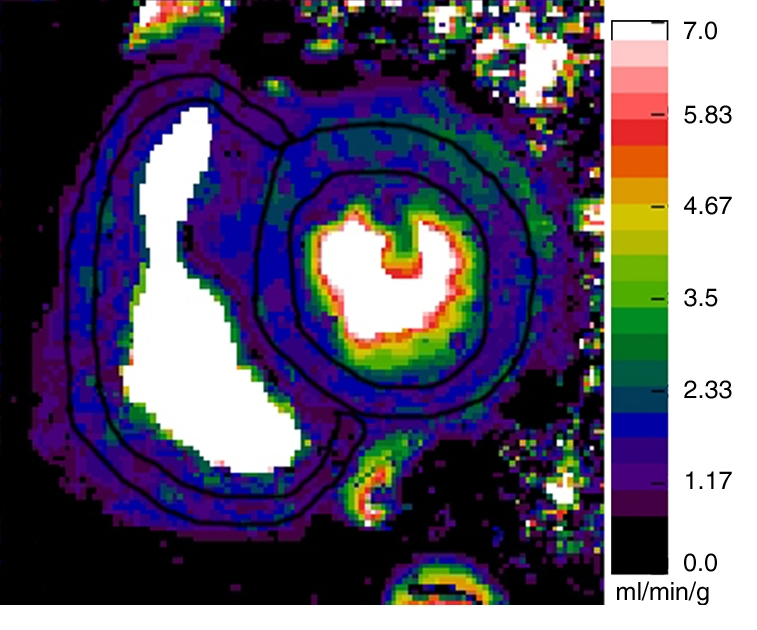
Representative short-axis perfusion maps show RV and LV regions of interest in (a, b) healthy control subject and (c, d) patient with PAH (mPAP, 45 mm Hg; pulmonary capillary wedge pressure, 10 mm Hg) at rest (a, c) and during adenosine-induced stress (b, d). Perfusion scales are at right. There were significantly lower RV and LV myocardial perfusion reserve indexes (MPRIs) in the PAH group than in the healthy control group (Table 1). Also note the RV remodeling in c and d.
For each short-axis section, RV and LV mean myocardial blood flow values were calculated. Then, the mean myocardial blood flow value of the short-axis sections was averaged for each ventricle. Because the at-rest myocardial blood flow is closely related to the rate-pressure product, the at-rest mean global RV and LV myocardial blood flow values in each patient were corrected for the respective rate-pressure products—that is, the absolute myocardial blood flow values were divided by the rate-pressure product, and the resulting quotients were divided by 10 000 (22,23). The LV and RV MPRIs were then calculated for each patient as the ratio of myocardial blood flow during hyperemia to that during rest (24). One experienced observer (J.S., 2 years experience in cardiac MR imaging), who was blinded to the patients’ diagnoses and RHC results, performed the MR perfusion analysis. To assess interobserver agreement, a second blinded experienced observer (J.V., 7 years experience in cardiac MR imaging) performed the MR perfusion analysis.
With use of MASS 6.2.1 software (Medis, Leiden, the Netherlands), the RV and LV endo- and epicardial borders were traced on consecutive short-axis cine MR images at end-systole and end-diastole for biventricular function analysis. The ventricular mass index (VMI) was calculated from the RV mass (MRV, in grams) and LV mass (MLV, in grams) during diastole: VMI = MRV/MLV. The RV stroke work index (SWIRV) was calculated according to the following equation: SWIRV = (mPAP − mRAP) × RV SV/BSA × 0.0136, where BSA is the body surface area (in square meters), RV SV is the RV stroke volume, and mRAP is the mean right atrial pressure (in millimeters of mercury).
Statistical Analyses
Results are presented as median values, with 25th–75th percentile ranges. Ventricular mass and volume parameters were indexed as body surface area (BSA) values: BSA = 0.007184 × w0.425 × h0.725, where w is the weight (in kilograms) and h is the height (in centimeters). The Shapiro-Wilks test was used to test whether variables were normally distributed. Because many of the variables were not normally distributed, nonparametric tests were used to perform univariate analyses. The Kruskal-Wallis test with Bonferroni correction—accounting for the number of variables tested—was used for comparisons between the three study groups. When the Kruskal-Wallis test result was significant, the subgroups were compared by using the Mann-Whitney U test (25,26). This strategy is specific to situations in which there are only three comparison groups, as in our present study. If one performs an omnibus test such as the Kruskal-Wallis test to determine if the means differ between any of the three groups and then conducts further intergroup testing only if the omnibus test result is significant, the originally set α error level is preserved. The correlation between ventricular MPRI and both MR imaging–derived cardiac functional indexes and catheter-derived hemodynamic parameters was tested by using the Spearman rank correlation test. P < .05 was considered to indicate significance. A multiple linear regression analysis was performed to estimate the relationships of RV and LV MPRIs with ventricular mass index, ejection fraction, and mPAP. Residual plots were visually examined to assess for nonlinearity or lack of homoscedasticity. Residuals were tested for normality. Interobserver agreement was tested by using Lin concordance correlation coefficients (27). Statistical analyses were performed by using 2007 Stata Statistical Software, release 10 (StataCorp, College Station, Tex).
Results
Subject Population
Of the 25 patients, 17 had RHC-proved PAH (11 with scleroderma-related PAH, six with idiopathic PAH). PAH was excluded in the remaining eight patients with scleroderma (non-PAH group). No significant differences in the at-rest and stress heart rates, systolic blood pressure, or rate-pressure product between the control subjects, patients without PAH, and patients with PAH were observed (Table 2). The median Framingham cardiovascular risk score was 1% (range, 1%–4%) in the control group and 1% (range, 1%–2%) in the patient groups (P = .95). Delayed-enhancement MR imaging did not depict any myocardial infarctions in our study population.
Table 2.
Vital Signs and Rate-Pressure Products at Rest and during Adenosine-induced Stress
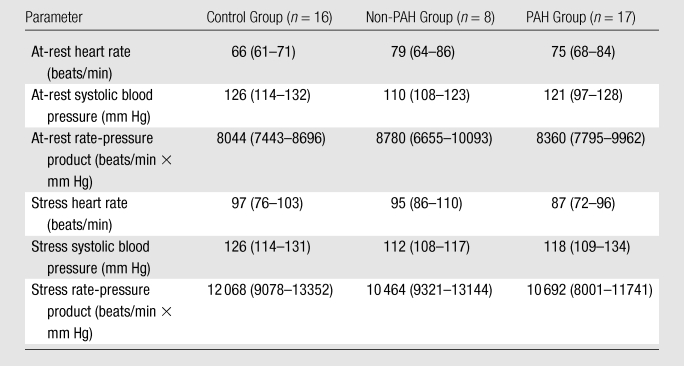
Note.—Data are median values, with 25th-75th percentile ranges in parentheses. There were no significant differences in at-rest and stress heart rates, systolic blood pressure, and rate-pressure product between the control subjects, patients without PAH, and patients with PAH.
Biventricular Myocardial Perfusion Reserve in PAH
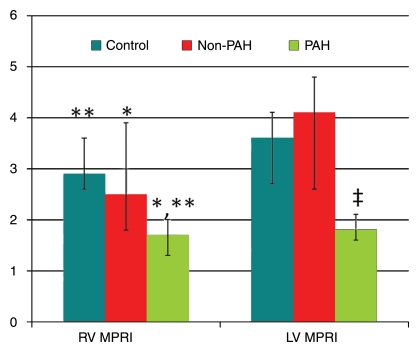
The LV MPRI in the PAH group (median, 1.8; 25th–75th percentile range, 1.6–2.1) was significantly lower than those in the non-PAH (median, 4.1; 25th–75th percentile range, 2.6–4.8 [P < .01]) and control (median, 3.6; 25th–75th percentile range, 2.7–4.1 [P < .01]) groups. Similarly, the RV MPRI in the PAH group (median, 1.7; 25th–75th percentile range, 1.3–2.0) was significantly lower than those in the non-PAH (median, 2.5; 25th–75th percentile range, 1.8–3.9 [P = .03]) and control (median, 2.9; 25th–75th percentile range, 2.6–3.6 [P < .01]) groups (Table 1, Figs 1, 2). There were no significant differences in LV MPRI (P = .48) or RV MPRI (P = .31) between the control and non-PAH groups (Fig 2). There was a significant positive correlation between RV MPRI and LV MPRI (ρ = 0.63, P = .01 for patient group [n = 25]; ρ = 0.73, P < .002 for entire study group [n = 41]). At rest, the median LV perfusion–RV perfusion ratios were 1.5, 1.5, and 1.3 in the control, non-PAH, and PAH groups, respectively (Table 1).
Table 1.
Study Subject Data
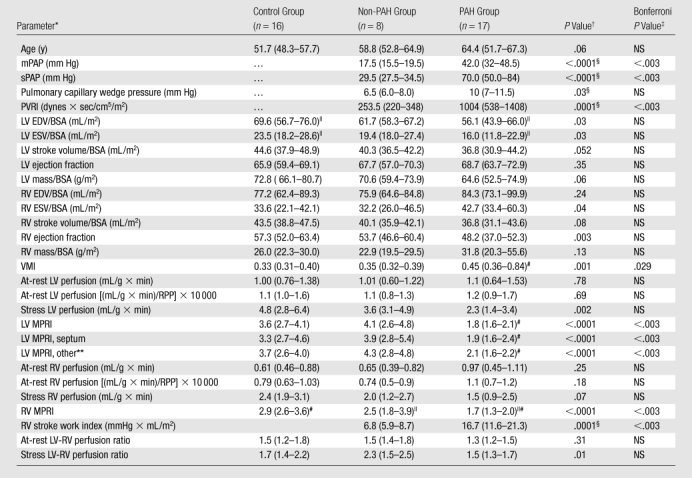
Note.—With exception of P values, data are median values, with 25th–75th percentile ranges in parentheses.
BSA = body surface area, EDV = end-diastolic volume, ESV = end-systolic volume, PVRI = pulmonary vascular resistance index, RPP = rate-pressure product, sPAP = systolic pulmonary arterial pressure, VMI = ventricular mass index.
P values for comparison between non-PAH, PAH, and control groups with the Kruskal-Wallis test. Only in the cases of significance, the Mann-Whitney U test was then used for intergroup comparisons.
NS = not significant after Bonferroni correction, accounting for the 29 variables tested.
Only the Mann-Whitney U test was used for these direct comparisons.
P < .05 (Mann-Whitney U test) for intergroup comparisons.
P < .01 (Mann-Whitney U test) for intergroup comparisons.
MPRI of LV wall, with septum excluded.
Figure 2:
Graph illustrates median values (with 25th and 75th percentile error bars) of RV and LV MPRIs (y-axis) in control, non-PAH, and PAH groups. P < .05 (*) and P < .01 (**, ‡) for comparisons of PAH group with control and non-PAH groups. There were no significant differences in LV MPRI (P = .48) or RV MPRI (P = .31) between the control and non-PAH groups.
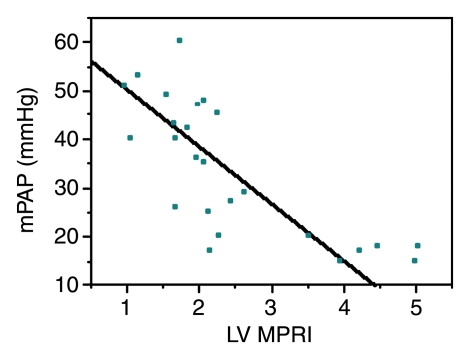
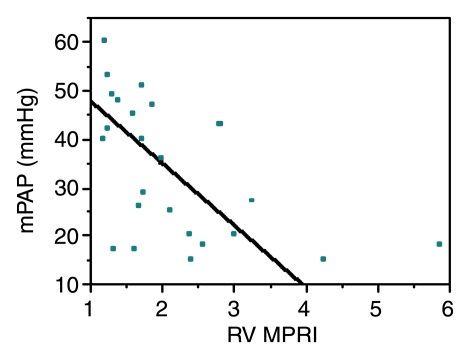
Biventricular myocardial perfusion reserve and pulmonary pressures.—Significant correlations between LV and RV MPRIs and RV pressures were observed (Table 3, Fig 3). LV MPRI had significant linear negative correlations with mPAP (ρ = −0.79, Bonferroni P < .002) and pulmonary vascular resistance index (ρ = −0.72, Bonferroni P < .002). There were also significant linear negative correlations between RV MPRI and mPAP (ρ = −0.59, Bonferroni P = .036).
Table 3.
Correlations between MPRI and LV Function Parameters
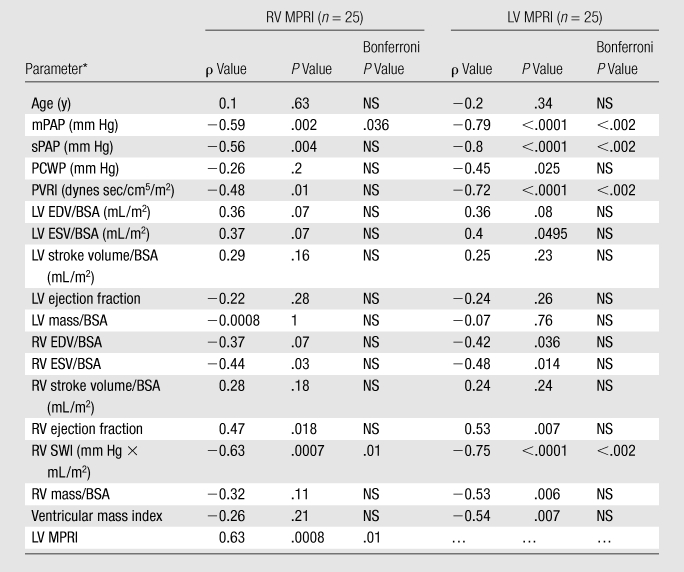
Note.—NS = not significant after Bonferroni correction, accounting for the 18 variables tested.
BSA = body surface area, EDV = end-diastolic volume, ESV = end-systolic volume, PCWP = pulmonary capillary wedge pressure, PVRI = pulmonary vascular resistance index, SV = stroke volume, SWI = stroke work index, sPAP = systolic pulmonary arterial pressure, VMI = ventricular mass index.
Figure 3a:
Graphs illustrate significant inverse relationships between mPAP and (a) LV MPRI (ρ = −0.79, Bonferroni P < .002) and (b) RV MPRI (ρ = −0.59, Bonferroni P = .036) in 25 patients known or suspected to have PAH.
Figure 3b:
Graphs illustrate significant inverse relationships between mPAP and (a) LV MPRI (ρ = −0.79, Bonferroni P < .002) and (b) RV MPRI (ρ = −0.59, Bonferroni P = .036) in 25 patients known or suspected to have PAH.
Biventricular myocardial perfusion reserve and RV function.—There were no significant correlations between LV and RV MPRIs and LV function parameters. However, we did observe significant correlations between LV and RV MPRIs and the following RV function and workload parameters (Table 3): between LV MPRI and RV end-diastolic volume–BSA ratio (ρ = −0.42, P = .036), RV end-systolic volume–BSA ratio (ρ = −0.48, P = .014), RV ejection fraction (ρ = 0.53, P = .007), RV mass–BSA ratio (ρ = −0.53, P = .006), ventricular mass index (ρ = −0.54, P = .007), and RV stroke work index (ρ = −0.75, P < .0001); and between RV MPRI and RV end-systolic volume–BSA ratio (ρ = −0.44, P = .03), RV ejection fraction (ρ = 0.47, P = .018), and RV stroke work index (ρ = −0.63, P = .0007). However, after Bonferroni correction, by accounting for the number of variables tested, only the correlations of RV and LV MPRIs with RV stroke work index remained significant.
Multiple linear regression analysis.—A multiple linear regression model analysis that included ventricular mass index, RV ejection fraction, and mPAP as parameters for predicting RV and LV MPRIs was performed. mPAP (P = .025; β = −.044 [95% confidence interval: −.82, −.006]) and RV ejection fraction (P = .045; β = .057 [95% confidence interval: .001, .11]) were independent predictors of RV MPRI. Only mPAP (P < .0001; β = −0.71 [95% confidence interval: −.11, −.035]) was an independent predictor of LV MPRI.
Interobserver variability.—Correlation coefficients for interobserver concordance regarding LV measurements were 0.95, 0.96, and 0.97 for at-rest perfusion, stress perfusion, and MPRI, respectively. Correlation coefficients for interobserver concordance regarding RV measurements were 0.90, 0.62, and 0.80 for at-rest perfusion, stress perfusion, and MPRI, respectively.
Discussion
In this study we found that the patients with PAH had lower RV and LV perfusion reserves compared with the healthy control subjects and the patients who were suspected of having but did not have PAH. RV and LV MPRIs were significantly correlated with increasing pulmonary arterial pressure and with measures of RV workload, systolic dysfunction, and remodeling (ie, ventricular mass index). Biventricular MPRI was inversely associated with mPAP and RV stroke work index.
The fact that the patients with PAH in our study had reduced perfusion reserves in not only the RV but also the LV was not surprising. Patients with scleroderma have a systemic component of endothelial dysfunction that is correlated with disease severity (28,29). Similarly, idiopathic PAH is known to be associated with peripheral endothelial dysfunction (30). In a study of 18 patients with idiopathic PAH, Wolff et al (30) demonstrated an association between pulmonary vascular resistance index, mPAP, and peripheral endothelial dysfunction—results that are consistent with our findings, which indicated significant correlations between LV MPRI in response to adenosine-induced stress and both mPAP and pulmonary vascular resistance index.
Nitenberg et al (31) evaluated coronary sinus flow in patients with primary scleroderma myocardial disease and healthy control subjects at rest and during dipyridamole-induced stress and observed significantly decreased coronary flow reserve in the scleroderma group in the absence of significant coronary artery stenosis, which they attributed to reduced coronary microvascular vasoreactivity. None of these patients was reported to have pulmonary fibrosis or systemic hypertension; however, they all had at-rest LV perfusion abnormalities at thallium 201 scintigraphy. Similarly, the patients with PAH in our study had a significantly reduced LV MPRI. The fact that there was a difference in LV MPRI between the scleroderma non-PAH group and the PAH group, which consisted mainly of patients with scleroderma, may be explained by more advanced myocardial microvascular dysfunction or, alternatively, the presence of PAH leading to decreased coronary perfusion pressure in the latter group (32). Although myocardial involvement in scleroderma is often clinically asymptomatic, it is increasingly recognized with imaging and is estimated to be a poor prognostic factor (32–35).
Our study results showed significantly lower RV at-rest myocardial blood flow per gram of myocardial tissue compared with the LV values in the scleroderma non-PAH and control groups, with a median LV-to-RV myocardial flow ratio of 1.5 at rest. This result is similar to a previously reported ratio of 1.51 in healthy subjects (4). In our PAH group, the median at-rest LV-to-RV myocardial blood flow ratio was reduced to 1.3, mainly owing to a trend of increased at-rest RV perfusion. In a study involving ponies, significantly increased at-rest RV perfusion was observed in the animals with pulmonary hypertension compared with that in the healthy control animals, at the expense of the RV myocardial perfusion reserve (5). A significantly decreased RV MPRI in the patients with PAH compared with that in the control subjects was also observed in our study.
There are several mechanisms whereby PAH may lead to reduced RV myocardial perfusion reserve and thus to myocardial ischemia: Marked RV remodeling with RV myocardial hypertrophy results in increased wall tension, which leads to decreased oxygen supply, increased oxygen extraction, and decreased perfusion secondary to compression of the coronary circulation. Furthermore, systemic hypotension, common with PAH and partially related to ventricular interdependence, leads to decreased coronary driving pressure, especially when pulmonary artery pressures are equal to or higher than systemic pressures. Aside from these hemodynamic alterations, a dysfunctional microcirculation such as that seen with scleroderma or idiopathic PAH may further contribute to decreased vasoreactivity and tissue ischemia (36). Investigators in a recent study involving humans reported a strong negative correlation (ρ = −0.73) of right coronary artery flow per gram of myocardial tissue in proportion to the degree of RV hypertrophy in patients with pulmonary hypertension (6). Consistent with these findings, our study further revealed significant correlations between RV and LV MPRIs and worsening RV ejection fraction, remodeling, and workload, suggesting that reduced myocardial perfusion reserve may contribute to RV failure in patients with PAH with increasing RV workload.
Interobserver agreement regarding the RV perfusion measurements was moderate compared with that regarding the LV measurements. This may be explained by technical postprocessing challenges, especially in the relatively thin-walled RV compared with the LV. To overcome these challenges, we sought to perform at-rest and stress perfusion MR imaging during systole for each short-axis section to maximize the RV and LV wall thicknesses by using high-spatial-resolution gradient-echo MR imaging (37,38). In addition, we recorded the mean value of both short-axis sections for each ventricle to minimize the influence of potential artifacts. Coronary angiography was not performed to exclude significant coronary artery stenosis in this study. However, we did not observe any characteristic focal reversible or fixed myocardial perfusion defects in a coronary artery distribution during adenosine stress MR imaging or any myocardial infarctions at delayed-enhancement MR imaging.
The significance of some correlations of biventricular MPRI with RV function and remodeling parameters was lost after Bonferroni correction for multiple variable testing (Table 3). We believe that this was mainly owing to the relatively small sample size in this exploratory study and that these correlations should be regarded as strong associations, the significance of which needs to be proved in future studies with larger sample sizes.
In conclusion, reduced RV and LV myocardial perfusion reserves are associated with elevated mPAP in patients known or suspected to have PAH who undergo RHC. The reduced adenosine-induced biventricular vasoreactivity in patients with idiopathic PAH and patients with scleroderma-related PAH is closely correlated to increased RV workload and RV dysfunction, suggesting that reduced myocardial perfusion reserve may contribute to RV dysfunction in patients with PAH. Further research is needed to determine whether reduced myocardial perfusion reserve has any prognostic importance in patients with PAH.
Advances in Knowledge.
Biventricular myocardial perfusion reserve (MPR) is significantly reduced in patients with pulmonary arterial hypertension (PAH) compared with that in healthy control subjects.
Biventricular MPR is inversely correlated with pulmonary arterial pressure (PAP) and right ventricular (RV) stroke work index in patients known or suspected to have PAH.
Mean PAP and RV ejection fractions are associated with RV MPR in patients known or suspected to have PAH.
Implication for Patient Care.
Further research is needed to determine whether reduced MPR has any prognostic importance in patients with PAH.
Received April 8, 2010; revision requested May 26; revision received June 29; accepted July 14; final version accepted August 16.
P.M.H. supported by National Institutes of Health.
Funding: This research was supported by the National Institutes of Health (grant 1P50 HL084946-01).
Authors stated no financial relationship to disclose.
Abbreviations:
- LV
- left ventricle
- mPAP
- mean pulmonary arterial pressure
- MPRI
- myocardial perfusion reserve index
- PAH
- pulmonary arterial hypertension
- RHC
- right heart catheterization
- RV
- right ventricle
References
- 1.Voelkel NF, Quaife RA, Leinwand LA, et al. Right ventricular function and failure: report of a National Heart, Lung, and Blood Institute working group on cellular and molecular mechanisms of right heart failure. Circulation 2006;114(17):1883–1891 [DOI] [PubMed] [Google Scholar]
- 2.McLaughlin VV, Archer SL, Badesch DB, et al. ACCF/AHA 2009 expert consensus document on pulmonary hypertension: a report of the American College of Cardiology Foundation Task Force on Expert Consensus Documents and the American Heart Association developed in collaboration with the American College of Chest Physicians, American Thoracic Society, and the Pulmonary Hypertension Association. J Am Coll Cardiol 2009;53(17):1573–1619 [DOI] [PubMed] [Google Scholar]
- 3.Humbert M, Sitbon O, Chaouat A, et al. Pulmonary arterial hypertension in France: results from a national registry. Am J Respir Crit Care Med 2006;173(9):1023–1030 [DOI] [PubMed] [Google Scholar]
- 4.Ferlinz J. Right ventricular function in adult cardiovascular disease. Prog Cardiovasc Dis 1982;25(3):225–267 [DOI] [PubMed] [Google Scholar]
- 5.Manohar M, Bisgard GE, Bullard V, Rankin JH. Blood flow in the hypertrophied right ventricular myocardium of unanesthetized ponies. Am J Physiol 1981;240(6):H881–H888 [DOI] [PubMed] [Google Scholar]
- 6.van Wolferen SA, Marcus JT, Westerhof N, et al. Right coronary artery flow impairment in patients with pulmonary hypertension. Eur Heart J 2008;29(1):120–127 [DOI] [PubMed] [Google Scholar]
- 7.Akasaka T, Yoshikawa J, Yoshida K, Hozumi T, Takagi T, Okura H. Comparison of relation of systolic flow of the right coronary artery to pulmonary artery pressure in patients with and without pulmonary hypertension. Am J Cardiol 1996;78(2):240–244 [DOI] [PubMed] [Google Scholar]
- 8.Murray PA, Vatner SF. Reduction of maximal coronary vasodilator capacity in conscious dogs with severe right ventricular hypertrophy. Circ Res 1981;48(1):25–33 [DOI] [PubMed] [Google Scholar]
- 9.Gómez A, Bialostozky D, Zajarias A, et al. Right ventricular ischemia in patients with primary pulmonary hypertension. J Am Coll Cardiol 2001;38(4):1137–1142 [DOI] [PubMed] [Google Scholar]
- 10.Abuhid IM, de Rezende NA. Right ventricular wall “ischemia” findings using a dual isotope protocol. Clin Nucl Med 2007;32(8):652–654 [DOI] [PubMed] [Google Scholar]
- 11.Taichman DB, Mandel J. Epidemiology of pulmonary arterial hypertension. Clin Chest Med 2007;28(1):1–22, vii [DOI] [PubMed] [Google Scholar]
- 12.Wilson PW, D’Agostino RB, Levy D, Belanger AM, Silbershatz H, Kannel WB. Prediction of coronary heart disease using risk factor categories. Circulation 1998;97(18):1837–1847 [DOI] [PubMed] [Google Scholar]
- 13.Simonneau G, Galiè N, Rubin LJ, et al. Clinical classification of pulmonary hypertension. J Am Coll Cardiol 2004;43(12 suppl S):5S–12S [DOI] [PubMed] [Google Scholar]
- 14.Mathai SC, Bueso M, Hummers LK, et al. Disproportionate elevation of N-terminal pro-brain natriuretic peptide in scleroderma-related pulmonary hypertension. Eur Respir J 2010;35(1):95–104 [DOI] [PubMed] [Google Scholar]
- 15.Klumpp B, Fenchel M, Hoevelborn T, et al. Assessment of myocardial viability using delayed enhancement magnetic resonance imaging at 3.0 Tesla. Invest Radiol 2006;41(9):661–667 [DOI] [PubMed] [Google Scholar]
- 16.Christian TF, Bell SP, Whitesell L, Jerosch-Herold M. Accuracy of cardiac magnetic resonance of absolute myocardial blood flow with a high-field system: comparison with conventional field strength. JACC Cardiovasc Imaging 2009;2(9):1103–1110 [DOI] [PubMed] [Google Scholar]
- 17.Axel L. Tissue mean transit time from dynamic computed tomography by a simple deconvolution technique. Invest Radiol 1983;18(1):94–99 [DOI] [PubMed] [Google Scholar]
- 18.Jerosch-Herold M, Wilke N, Stillman AE. Magnetic resonance quantification of the myocardial perfusion reserve with a Fermi function model for constrained deconvolution. Med Phys 1998;25(1):73–84 [DOI] [PubMed] [Google Scholar]
- 19.Goldstein TA, Jerosch-Herold M, Misselwitz B, Zhang H, Gropler RJ, Zheng J. Fast mapping of myocardial blood flow with MR first-pass perfusion imaging. Magn Reson Med 2008;59(6):1394–1400 [DOI] [PubMed] [Google Scholar]
- 20.Goldstein TA, Zhang H, Misselwitz B, Gropler RG, Zheng J. Improvement of quantification of myocardial first-pass perfusion mapping: a temporal and spatial wavelet denoising method. Magn Reson Med 2006;56(2):439–445 [DOI] [PubMed] [Google Scholar]
- 21.Plein S, Kozerke S, Suerder D, et al. High spatial resolution myocardial perfusion cardiac magnetic resonance for the detection of coronary artery disease. Eur Heart J 2008;29:2148–2155 [DOI] [PMC free article] [PubMed] [Google Scholar]
- 22.Selvanayagam JB, Jerosch-Herold M, Porto I, et al. Resting myocardial blood flow is impaired in hibernating myocardium: a magnetic resonance study of quantitative perfusion assessment. Circulation 2005;112(21):3289–3296 [DOI] [PubMed] [Google Scholar]
- 23.Czernin J, Müller P, Chan S, et al. Influence of age and hemodynamics on myocardial blood flow and flow reserve. Circulation 1993;88(1):62–69 [DOI] [PubMed] [Google Scholar]
- 24.Selvanayagam JB, Cheng AS, Jerosch-Herold M, et al. Effect of distal embolization on myocardial perfusion reserve after percutaneous coronary intervention: a quantitative magnetic resonance perfusion study. Circulation 2007;116(13):1458–1464 [DOI] [PubMed] [Google Scholar]
- 25.Levin JR, Serlin RC, Seaman MA. A controlled, powerful multiple-comparison strategy for several situations. Psychol Bull 1994;115(1):153–159 [Google Scholar]
- 26.Fisher RA. The design of experiments. Edinburgh, Scotland: Oliver & Boyd, 1935 [Google Scholar]
- 27.Lin LI. A concordance correlation coefficient to evaluate reproducibility. Biometrics 1989;45(1):255–268 [PubMed] [Google Scholar]
- 28.Peled N, Bendayan D, Shitrit D, Fox B, Yehoshua L, Kramer MR. Peripheral endothelial dysfunction in patients with pulmonary arterial hypertension. Respir Med 2008;102(12):1791–1796 [DOI] [PubMed] [Google Scholar]
- 29.Peled N, Shitrit D, Fox BD, et al. Peripheral arterial stiffness and endothelial dysfunction in idiopathic and scleroderma associated pulmonary arterial hypertension. J Rheumatol 2009;36(5):970–975 [DOI] [PubMed] [Google Scholar]
- 30.Wolff B, Lodziewski S, Bollmann T, Opitz CF, Ewert R. Impaired peripheral endothelial function in severe idiopathic pulmonary hypertension correlates with the pulmonary vascular response to inhaled iloprost. Am Heart J 2007;153(6):1088.e1–1088.e7 [DOI] [PubMed] [Google Scholar]
- 31.Nitenberg A, Foult JM, Kahan A, et al. Reduced coronary flow and resistance reserve in primary scleroderma myocardial disease. Am Heart J 1986;112(2):309–315 [DOI] [PubMed] [Google Scholar]
- 32.Kahan A, Allanore Y. Primary myocardial involvement in systemic sclerosis. Rheumatology (Oxford) 2006;45(suppl 4):iv14–iv17 [DOI] [PubMed] [Google Scholar]
- 33.Allanore Y, Meune C, Kahan A. Systemic sclerosis and cardiac dysfunction: evolving concepts and diagnostic methodologies. Curr Opin Rheumatol 2008;20(6):697–702 [DOI] [PubMed] [Google Scholar]
- 34.Bezante GP, Rollando D, Sessarego M, et al. Cardiac magnetic resonance imaging detects subclinical right ventricular impairment in systemic sclerosis. J Rheumatol 2007;34(12):2431–2437 [PubMed] [Google Scholar]
- 35.Hachulla AL, Launay D, Gaxotte V, et al. Cardiac magnetic resonance imaging in systemic sclerosis: a cross-sectional observational study of 52 patients. Ann Rheum Dis 2009;68(12):1878–1884 [DOI] [PMC free article] [PubMed] [Google Scholar]
- 36.Bogaard HJ, Abe K, Vonk Noordegraaf A, Voelkel NF. The right ventricle under pressure: cellular and molecular mechanisms of right-heart failure in pulmonary hypertension. Chest 2009;135(3):794–804 [DOI] [PubMed] [Google Scholar]
- 37.Plein S, Schwitter J, Suerder D, Greenwood JP, Boesiger P, Kozerke S. k-Space and time sensitivity encoding-accelerated myocardial perfusion MR imaging at 3.0 T: comparison with 1.5 T. Radiology 2008;249(2):493–500 [DOI] [PMC free article] [PubMed] [Google Scholar]
- 38.Klumpp BD, Seeger A, Doesch C, et al. High resolution myocardial magnetic resonance stress perfusion imaging at 3 T using a 1 M contrast agent. Eur Radiol 2010;20(3):533–541 [DOI] [PubMed] [Google Scholar]


