Abstract
Cell adhesion molecules play a central role at every step of the immune response. The function of leukocytes can be regulated by modulating adhesion interactions between cell adhesion molecules to develop therapeutic agents against autoimmune diseases. Among the different cell adhesion molecules that participate in the immunological response, CD2 and its ligand CD58 (LFA-3) are two of the best-characterized adhesion molecules mediating the immune response. To modulate the cell adhesion interaction, peptides were designed from the discontinuous epitopes of the β-strand region of CD2 protein. The two strands were linked by a peptide bond. β-Strands in the peptides were nucleated by inserting a β-sheet-inducing Pro-Gly sequence with key amino acid sequences from CD2 protein that binds to CD58. Using a fluorescence assay, peptides that exhibited potential inhibitory activity in cell adhesion were evaluated for their ability to bind to CD58 protein. A model for peptide binding to CD58 protein was proposed based on docking studies. Administration of one of the peptides, P3 in collagen-induced arthritis (CIA) in the mouse model, indicated that peptide P3 was able to suppress rheumatoid arthritis in mice.
Keywords: beta hairpin, CD2 peptides CD2, CD58, cell adhesion, NMR, immunomodulation, arthritis mouse model
To generate the immune response, T-cell receptor (TCR) on the surface of T cells engages with antigenic peptide:major histocompatibility complex (pMHC) on the surface of the antigen-presenting cell (APC). This interaction is designated as Signal-1 (1–3). In addition, the co-stimulatory signal (Signal-2) is delivered by cell adhesion molecules, including CD2–CD58, LFA-1-ICAM-1 (CD11a/CD18–CD54), and CD28-B7 (CD28–CD80). Among the different cell adhesion molecules that participate in an immunological response, CD2 and its ligand CD58 (LFA-3) are two of the best-characterized. In the presence of CD2–CD58 interaction, T cells recognize correct pMHC with 50- to 100-fold greater affinity than in the absence of this interaction (1–4). Thus, a better understanding of the critical roles of CD2–CD58 interaction in immune regulation and disease pathology provides an opportunity to design new potential immunosuppressive agents. Inhibition of the CD2–CD58 interaction has important implications in controlling immune responses in autoimmune diseases (5–7). Therefore, molecules designed to inhibit CD2–CD58 interaction may function as immunosuppressants.
Rheumatoid arthritis (RA) is a chronic systemic inflammatory disease characterized by inflammation of the synovial lined joints. It is estimated that RA affects 1% of the US population (8). It is an autoimmune disease with local tissue destruction and systemic biochemical response. A hallmark of inflammatory arthritis is the accumulation of blood-derived leukocytes within joints, granulocytes within synovial fluid, and mononuclear cells in the synovial membrane. Cell adhesion molecules play a major role in pathogenesis of RA. CD58 expression is dramatically up-regulated in inflammatory lesions, which further leads to targeted recruitment of T cells into inflammatory sites (6). CD58 is widely distributed among cell types of the synovial microenvironment and provides numerous cell types with which lymphocytes can interact via CD2–CD58 and ICAM-1-LFA-1 adhesion pathways during the course of inflammatory synovitis (9, 10). RA-synovial fluid lymphocytes (SFL) that consist mostly of T cells showed higher expression of CD2 and CD58 (11–12). It is postulated that the onset of autoimmunity may be associated with CD58 up-regulation and ligation of CD2 on dendritic cells; subsequent autocrine release of IL-1β increases the release of IL-12 and, in turn, activates T cells. These findings make CD2 and CD58 molecules attractive targets for understanding the mechanism of autoimmune diseases.
Monoclonal antibodies (mAbs) that block the CD2–CD58 interaction are being developed to treat autoimmune diseases. mAbs directed against CD2 inhibit T-cell adhesion or activation (13–17). Alefacept is a recombinant human CD58-Ig fusion protein that effectively binds to CD2 and prevents CD2 interaction with CD58 expressed on APC (5, 18); Alefacept has shown efficacy in a limited number of patients with psoriatic arthritis (PsA) (5, 18–19). However, therapeutic antibodies/fusion proteins often elicit significant side effects attributed to their immunogenicity and are susceptible to enzymatic degradation. To circumvent these problems, one approach is to design short peptides or small molecular mimics that will bind to critical areas in target proteins and, like antibodies, interfere with their activity. Peptides can be modified to protect the N- and C-terimini from enzymatic degradation (20–21).
In our previous studies, we have shown that peptides designed from the β-strand region of CD2 protein block cell adhesion interactions between T-cells and epithelial cells (22–24). Conformational constraints were introduced in the peptide by a Pro-Gly sequence and cyclization to generate β-turn structures from the strand sequences (23). In the present work, we describe the binding of CD2 peptides to CD58 protein. One of the designed peptides called P3 was studied in detail for its in vivo activity using the collagen-induced arthritis (CIA) mouse model. Results obtained from in vitro data indicated that peptides from CD2 bind to CD58 protein, and in vivo data suggested that the peptide P3 was able to suppress RA in the mouse model. A model for the binding of CD2 peptide to CD58 protein was proposed based on the docking studies.
Results and Discussion
Design of peptides
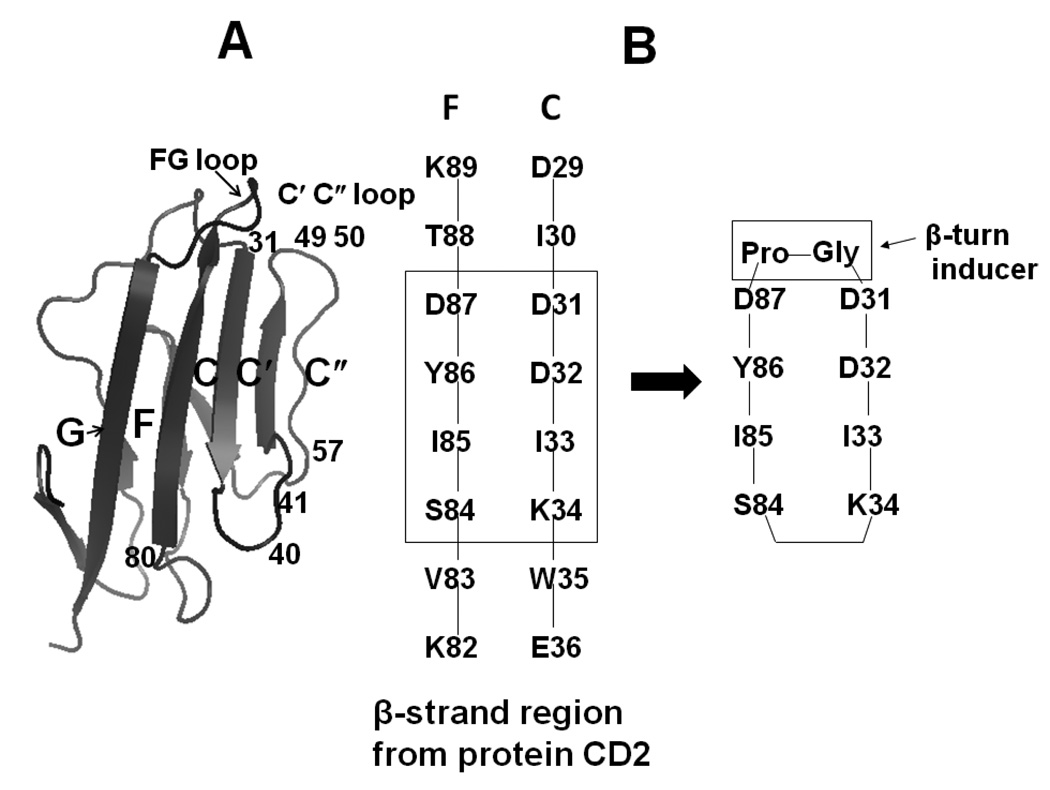
Design of the peptides was based on the structure of the CD2–CD58 complex and mutagenesis reported in the literature (25–27). Upon examining the CD2 crystal structure (Fig. 1A) in the CD2–CD58 complex (25), it was seen that the CD58 contact areas in CD2 involve the C, C', C" and F β-strands and the FG, CC', and C'C" loops. The CD2 epitopes are mapped in C, C', C" and F strands and two turns (FG loop and C" loop). Mutagenesis studies of CD2/CD58 suggested that residues around the β-turn, β-strand (27) and flanking residues of the β-turn at the interface between CD2 and CD58 are important for cell-cell adhesion. In the CD2 protein, strands F and C are discontinuous in sequence (residues 29–36 and 82–89) but spatially close and form an anti-parallel β-sheet (Figures 1A &B) in which strands are placed 5 Ǻ apart. Using mutagenesis studies, the residues in these strands have been shown to be important for binding CD2 to CD58 protein (27). In our peptide design, by retaining the C strand with D31, D32, and K34 residues that are close to the hydrophobic region and the F strand with the “hot spot” Y86, the peptide mimics the native structure of the protein.
Figure 1.
A) Crystal structure of CD2 showing adhesion domain. Secondary structure elements that are important in binding to CD58 are labeled (F, C, C', C") with residue numbers. B) Sequence of fragments of secondary structure of CD2 that are important in binding to CD58 (F and C β-strands) are shown with residue numbers. Peptides were designed based on these results as discussed in the text.
Based on the results mentioned above and our previous studies (22–27), we proposed that a cyclized β-hairpin peptide assembling the two strands (residues 31–34 and 84–87) (Figure 1B) would be a suitable model for mimicking the CD2 interface with CD58. While designing the peptides, the following procedures were undertaken. A Pro-Gly sequence was inserted to connect the two strands between D31 and D87; the other end of the strand (K34–S84) was cyclized by different strategies to acquire a stable peptide structure (Figure 1B, Table 1). To design the control peptide, a 12-amino acid residue sequence was chosen from the hot-spot region of CD2 (containing Tyr86) (22–24), and the sequence was reversed. Tyr86 and Tyr81 were replaced with Ala to generate the control peptide (Table 1).
Table 1.
Sequences of the Peptides that are Derived from Human CD2 Protein.
| Code | Sequence a | Comment |
|---|---|---|
| 2 | Cyclo(1,11) H-E1S2I3Y4D5P6G7D8D9I10K11-OH | Cyclized by side chain of E1 and K11 |
| 3 | Cyclo(1,10) E1I2Y3D4P5G6D7D8I9K10 | Main chain cyclization |
| 4 | Cyclo(1,10) H-E1I2Y3D4P5G6D7D8I9K10-OH | Cyclized by side chain of E1 and K10 |
| Control | KGKTDAISVKAI-NH2 | Reversal of sequence and replacement of Y81 and Y86 by Ala |
| FITC-4 | FITC-Cyclo(1,10) H-E1I2Y3D4P5G6D7D8I9K10-OH | Fluoresceineisothiocyanate attachment at N-terminal via amino hexanoic acid (Ahx) |
In our previous study, we reported that peptides derived from the CD2 protein β-strand region were able to inhibit cell adhesion between Caco-2 cells and Jukat cells in a concentration-dependent manner (23). At 180 µM, peptides 3 (P3), and 4 (P4) were able to inhibit cell adhesion by nearly 70% compared to the control peptide. These peptides inhibit the cell adhesion presumably by binding to CD58 protein and thus inhibiting CD2–CD58 interaction. In the present study, we provide the following evidence to show that peptides from CD2 bind to CD58 protein on Caco-2 cells.
Binding of fluorescently labeled peptide to Caco-2 cells bearing CD58
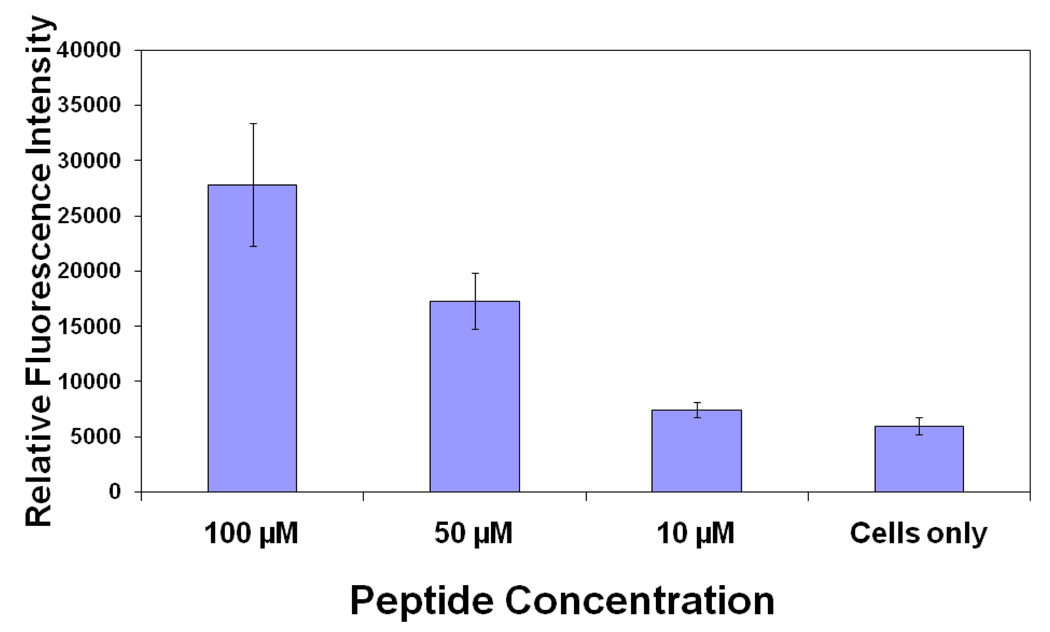
In our preliminary studies, we have shown that CD2-derived peptides disrupt the T cell-Caco-2 cell adhesion interaction. Here we want to show that CD2-derived peptides bind to CD58 on the surface of Caco-2 cells. The expression of CD58 on the surface of Caco-2 cells was confirmed by confocal microscopy using fluorescently labeled anti-CD58 (data shown in Supporting Information). P3 and P4 have similar sequences but differ in the way they are cyclized. P3 and P4 also have shown similar cell adhesion inhibition activity (23). P3 was cyclized by main chain cyclization and, hence, the N-terminal was not available for FITC labeling (side chain of Lys is available for FITC labeling). P4 was cyclized by side-chain cyclization, and the main chain N-terminal was available for FITC labeling. Considering the availability of free N-terminal, P4 was chosen for FITC-labeling. FITC-labeled P4 was incubated with Caco-2 cells at different concentrations. The results of binding of P4 are shown in Figure 2. The relative intensity of fluorescence with different P4 concentrations clearly suggests the binding of P4 to Caco-2 cells. As a positive control, FITC-labeled anti-CD58 was used. Statistical analysis of the data using one-way Anova analysis suggested that, compared to the cells only, 100 µM (P< 0.05) and 50 µM (P<0.05) FITC-P4 showed significant binding of P4 to Caco-2 cells, whereas 10 µM FITC-P4 did not show binding of peptide to cells.
Figure 2.
Fluorescence assay for binding of fluorescently labeled P4 to Caco-2 cells bearing CD58. Concentration dependence of binding of peptide is shown. Error bars indicate standard error of the mean (SEM). P < 0.05 for 50 µM and 100 µM FITC-P4 when compared with only cells.
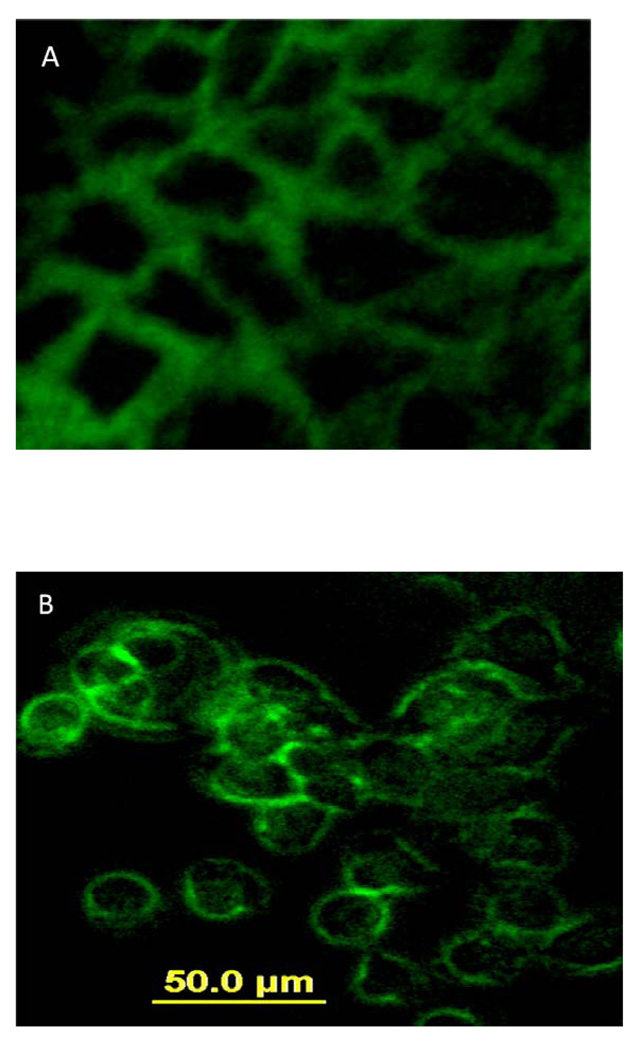
Microscopic studies were carried out to visually observe the binding of fluorescently labeled P4 to Caco-2 cells. FITC-P4 and FITC-antiCD58 were incubated with Caco-2 cells and, after washing and fixing, the cells were visualized using a fluorescence microscope. Figure 3A shows the binding of FITC-P4, and Figure 3B shows FITC-antiCD58 specifically binding to CD58 protein. The binding of fluorescently labeled P4 and anti-CD58 was at the periphery of the cells, indicating the binding of P4 to CD58 protein. As a control, FITC was used and non-specific binding of FITC was observed.
Figure 3.
Fluorescence images showing binding of A) fluorescently labeled P4 and B) FITC-anti-CD58 to Caco-2 cells. Magnification 20×.
Antibody binding inhibition assay
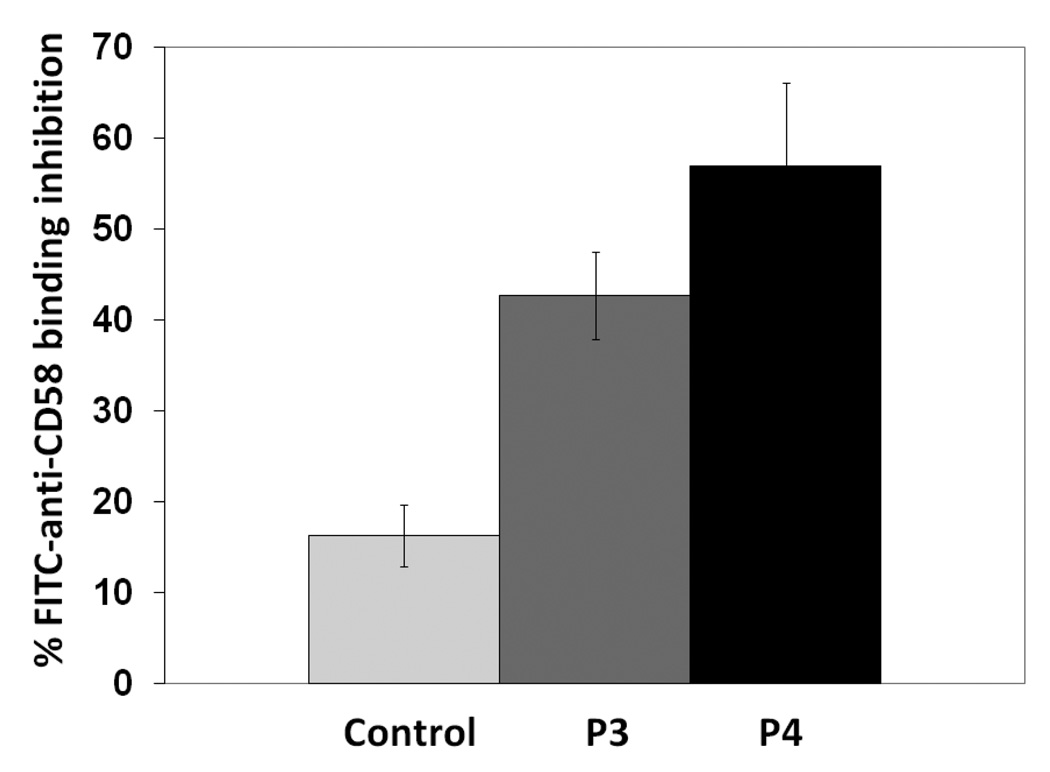
The experiments described above suggest that CD2 peptides bind to CD58-expressing Caco-2 cells; this is only indirect evidence that CD2 peptides bind to CD58 protein to inhibit CD2–CD58 interaction. Thus, the objective of this experiment was to evaluate whether CD2 peptides inhibit anti-CD58 binding to CD58 expressed on the surface of Caco-2 cells. Peptide 3 or 4 was incubated with Caco-2 cells followed by incubation with FITC-anti-CD58 that blocks the CD58 binding region to CD2. The results indicate the competitive binding nature of the peptides to CD58 protein (Figure 4); peptides P3 and P4 inhibit the antibody binding by nearly 40 and 50% respectively. Statistical analysis suggested that there is a significant difference in inhibition of anti-CD58 between P3 and P4 compared to control peptide (P<0.05). There was no statistical difference between P3 and P4 in inhibiting antibody binding to Caco-2 cells (P>0.05). From these experiments, one can conclude that CD2 peptides bind to CD58 in the region where anti-CD58 binds and, hence, they inhibit the interaction between CD2 and CD58.
Figure 4.
Antibody (FITC-antiCD58) binding inhibition of P3 and P4 to Caco-2 cells bearing CD58 protein. Peptide was concentration was 180 µM. Error bars indicate standard error of the mean (SEM). P < 0.05 for P3, P4 when compared with control peptide inhibition.
Competitive binding of anti-CD58 and FITC-P4
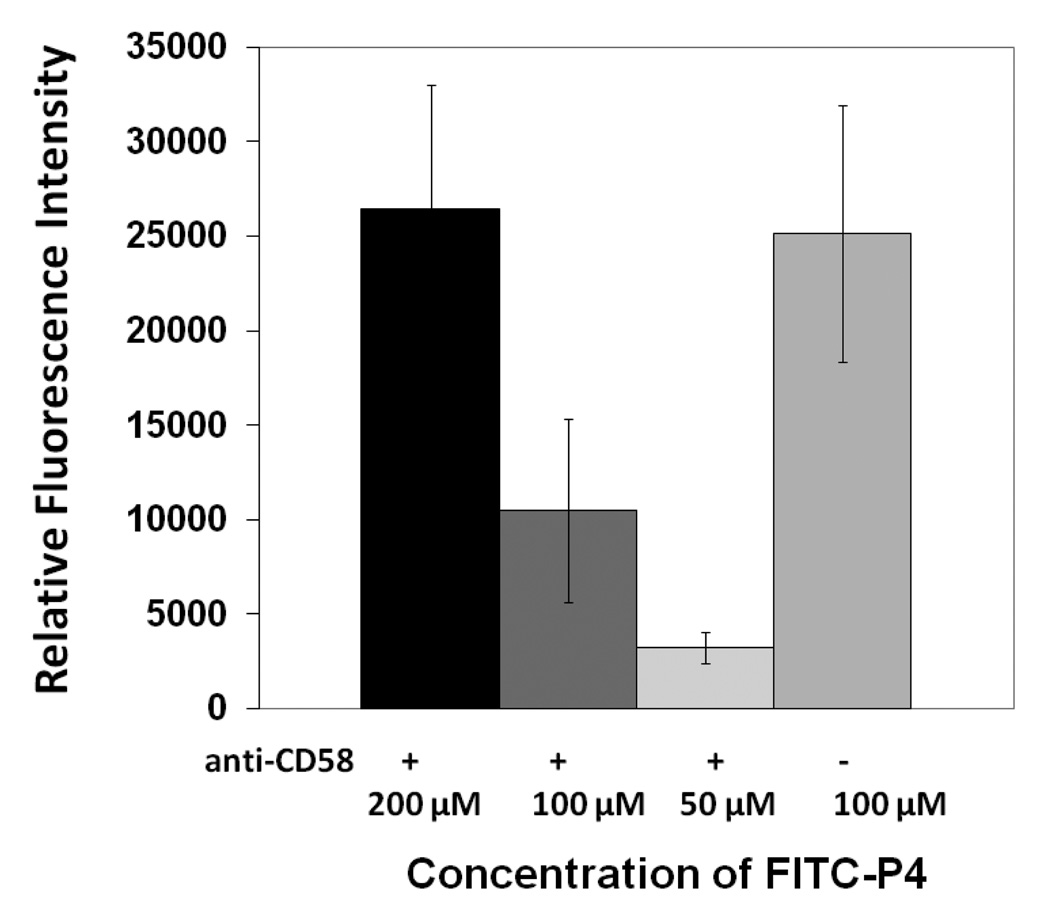
To evaluate whether peptide P4 competes with anti-CD58 binding to CD58 on Caco-2 cells, experiments were performed in which anti-CD58 was incubated at a constant concentration with Caco-2 cells and then different concentrations of FITC-P4 were added. Binding of 100 µM FITC-P4 in the absence of anti-CD58 was used as a control. Compared to 100 µM FITC-P4 in the absence of anti-CD58, 100 µM FITC-P4 in the presence of anti-CD58 has lower binding affinity to the cells, suggesting that P4 has similar binding site with the mAb on CD58 (Figure 5). In the presence of mAb and various concentrations of FITC-P4, the FITC-P4 binding was concentration-dependent, and 200 µM FITC-P4 in the presence of mAb has similar binding affinity to FITC-P4; this further confirms the blocking of FITC-P4-binding to CD58 by mAb (Figure 5). Statistical analysis of the results suggested that there is no significant difference between binding of 200 µM FITC-P4 in the presence of anti-CD58 and 100 µM FITC-P4 in the absence of anti-CD58 (P>0.05), whereas there was a significant difference between 100 (P value = 0.05) and 50 µM FITC-P4 in the presence of antibody and 100 µM FITC-P4 in the absence of antibody (P< 0.05). Competitive binding experiments with various concentrations of anti-CD58 (1.25, 12.5, and 18.5 µg/mL) and a constant amount of FITC-P4 (100 µM) suggested that binding of FITC-P4 decreased with an increase in anti-CD58 concentration (Supporting Information). It should be noted that the antibody has high specificity and high affinity toward CD58. The concentration of the antibody used was much lower than that of the peptide P4. Overall, the antibody binding inhibition studies indicated that a peptide from CD2 (P4) binds to CD58 at on the cell surface in concentration-dependent manner.
Figure 5.
Competitive binding of anti-CD58 and FITC-P4. The concentration of anti-CD58 was kept constant (6.25 µg/mL) and the concentration of FITC-P4 was varied. For comparison, 100 µM of FITC-P4 in the absence of antibody (−) is also shown. P < 0.05 for 50 µM FITC P4 when compared to 100 µM in the absence of antibody. P >0.05 for 200 and 100 µM FITC P4 in the presence of antibody when compared to 100 µM in the absence of antibody.
Cell viability assay
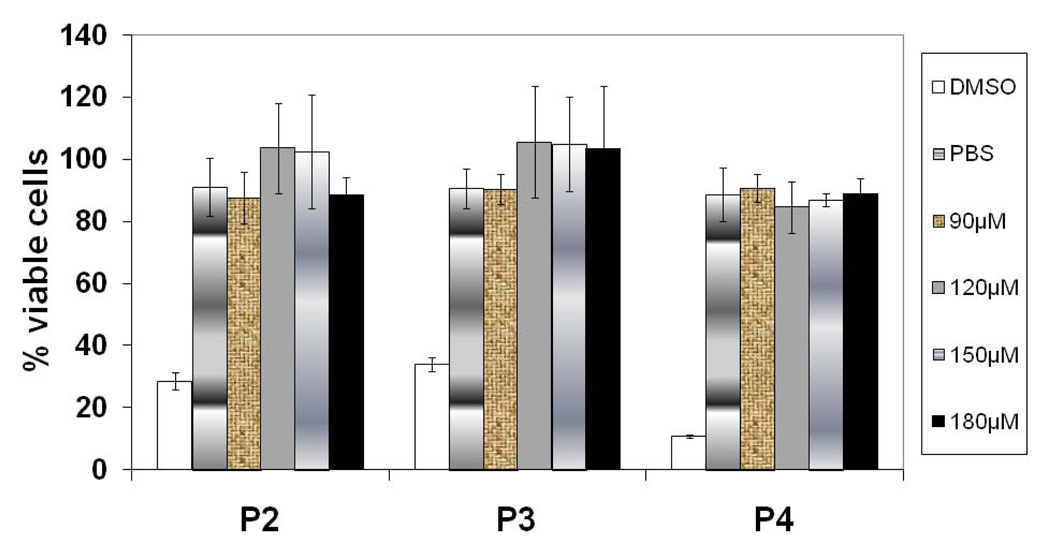
Peptides P2 to P4 were also tested for their toxicity using the MTT assay (28–29). Peptides were added to Caco-2 or Jurkat cells at different concentrations and incubated for 2 h, which is the time of exposure of Caco-2 and Jurkat cells during the cell adhesion assay. The results from viability assay on Caco-2 cells are shown in Figure 6. The cells treated with peptides 2–4 demonstrated 90–100% viability, indicating that these peptides were not toxic to cells and that the observed inhibition data were not due to peptide toxicity.
Figure 6.
Cell viability of Caco-2 cells on treating different concentration of peptides. At the highest peptide concentration used in the study, the cells are still viable, indicating that the peptides are not toxic to cells. P< 0.05 for peptide treated cells compared to DMSO treated cells.
NMR spectroscopic method to determine binding of CD2 peptides to CD58 protein
Although the methods above detect the binding of CD2 peptides to CD58, they require labeling of peptides with FITC. Because these peptides are small, labeling with FITC may affect the conformation and activity of the peptide. Hence, a method that does not use FITC labeling of peptides will serve as a complement to the methods described above. In this method, the 1D NMR resonances of the CD2 peptides will be monitored upon titrating CD58 protein at different concentrations. Depending on the kinetics of the binding between peptide and protein, the ratio of concentration of protein to peptide, 1D NMR resonances of the peptide will be changed (broadened or change in the intensity of the resonances) if the peptide binds to the protein (30–31).
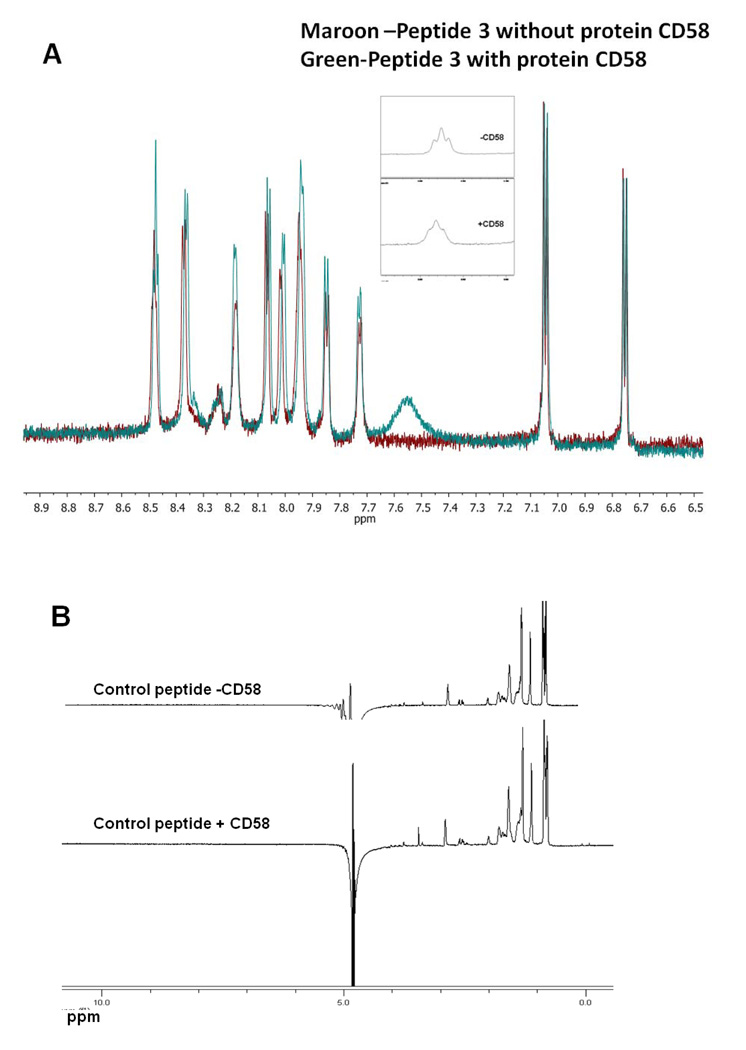
Figure 7A shows the amide region of the 1D NMR spectrum of P3 with and without the protein at pH 7.0. There is a slight increase in the intensity of P3 resonances upon the addition of protein CD58 (ratio of protein to peptide concentration was 1:80, because of limited quantity of pure protein, high ratio was used). Small peptides with solvent-accessible protons show very low intensity amide resonances at pH 7.0 because of the high exchange rate of amide protons at neutral pH (32). Upon binding to protein, the rates of exchange of many solvent accessible protons with water are decreased and, hence, the NMR resonance intensity of amide protons increases. This slight increase in intensity can be used as a method to detect binding of peptides to proteins. Upon binding of peptide to large molecule (i.e., protein), the resonances of the small peptide are broadened. Figure 7A indicates that there is a broadening of one of the NMR resonances of the peptide upon the addition of protein CD58 (inset), suggesting that P3 binds to CD58 protein. Figure 7B shows the NMR spectrum of control peptide without and with protein CD58 pH 7.0. The control peptide (Table 1) did not show any amide resonances at pH 7.0 because of the rapid exchange rate of amide protons. Similarly, upon addition of protein CD58, there is no indication of amide resonances in the NMR of control peptide, indicating that control peptide does not bind to protein CD58. Taken together, these results imply that the observed binding of P3 to CD58 protein is specific.
Figure 7.
1D NMR spectrum of A) P3 in the presence (ratio of protein to peptide was 1:80) and absence of protein CD58, B) control peptide in the presence (1:80 ratio of protein to peptide) and absence of protein, indicating the binding of P3 to protein CD58.
Docking studies
From the cellular assays, fluorescence microscopy studies, and NMR studies, it is clear that P3 and P4 peptides have specificity toward CD58 protein. To model the interaction of P3 and P4 with CD58 protein domain I, docking (33) of three-dimensional structures P3 and P4 with CD58 protein crystal structure was carried out.
Docking of P3 to CD58
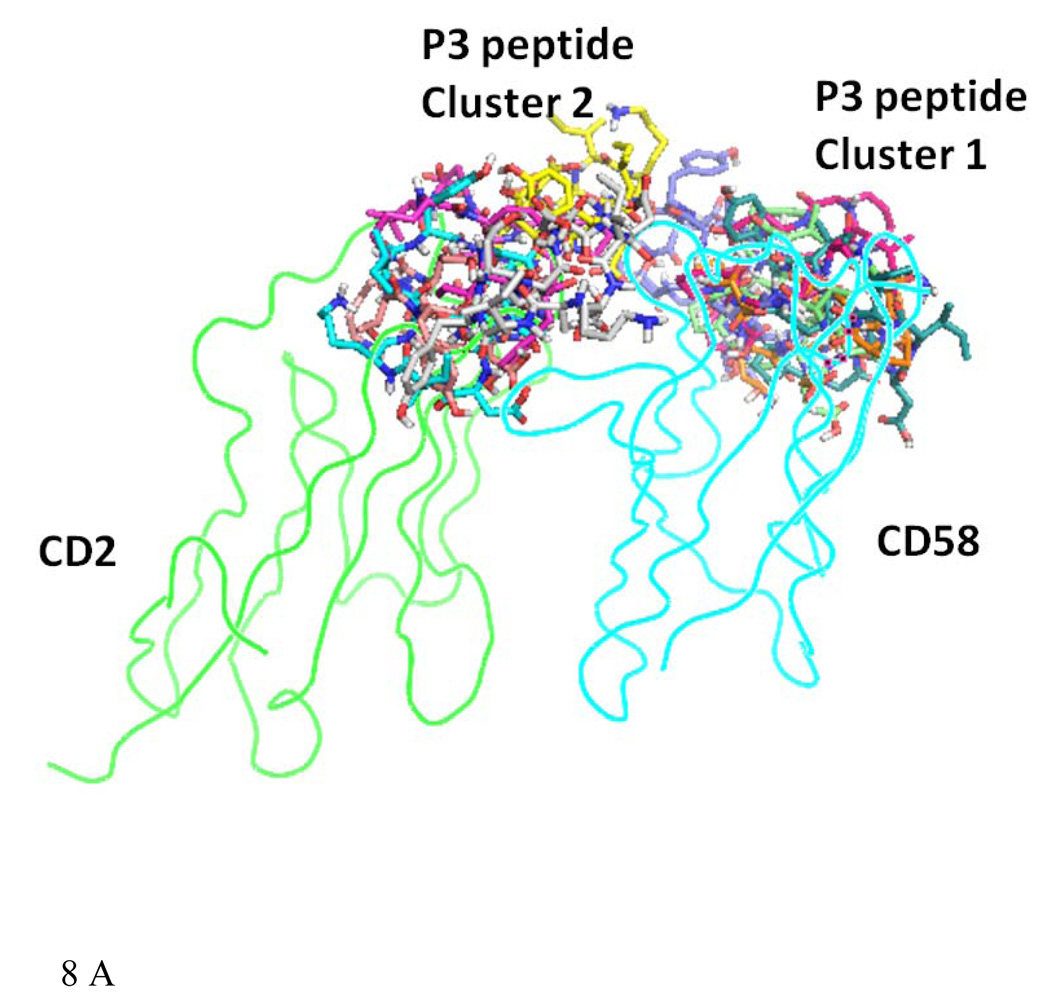
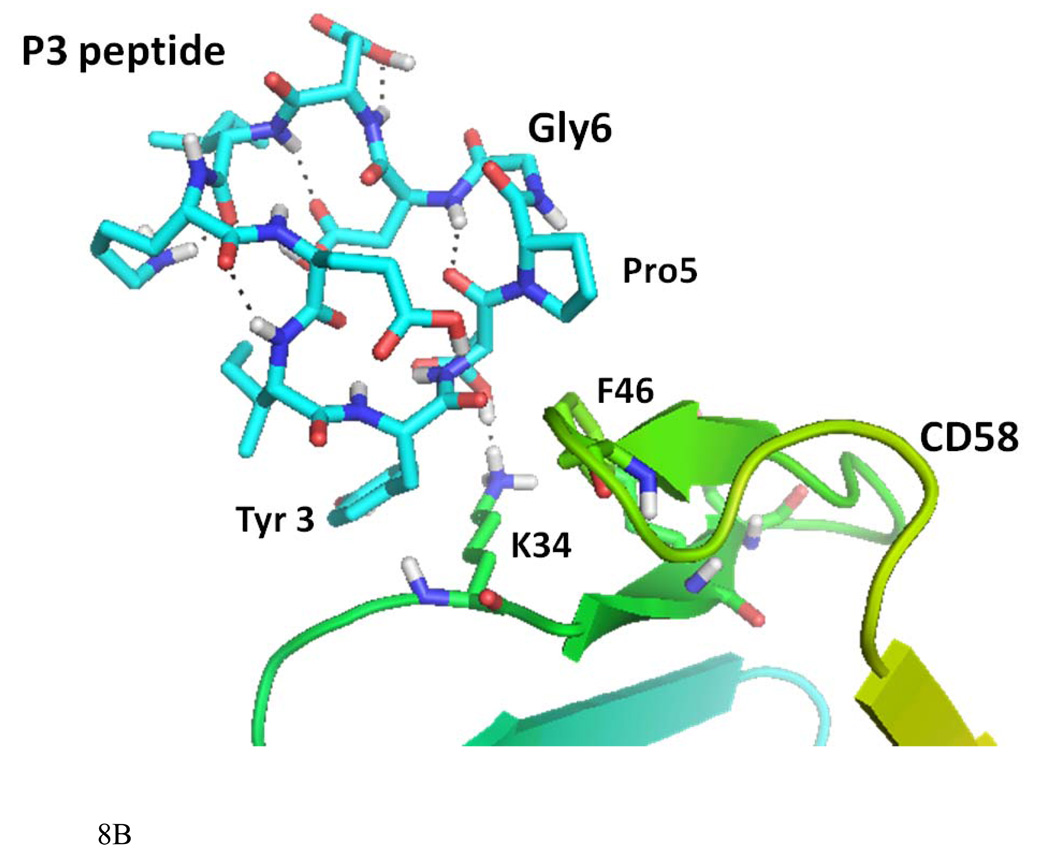
Fifty low energy docked structures of P3 with CD58 protein were analyzed. Clusters of docked molecules were created based on docking energy, using 2.5 kcal/mol as error criterion in autodock 4 (33). Two clusters of docked molecules with low energy were identified, cluster 1 with docking energy ranging from −14 to −12 kcal/mol and cluster 2 from −9 to −11 kcal/mol. These two possible clusters of docking modes of P3 are shown in Figure 8A. Although cluster 1 had the lowest energy of docking, the bound conformations were partially covering the CD2 binding surface of CD58 protein. However, cluster 2 conformers were covering the binding surface of CD2–CD58 interaction on CD58 protein. Detailed interaction of one of the low energy docked structures from cluster 2 is shown in Figure 8B. P3 interacts with protein CD58 by hydrogen bonding between the side chain of Asp4 of P3 and the side chain of K34 of CD58. K34 of CD58 side chain also formed a hydrophobic interaction with Tyr3 of P3 peptide. A hydrophobic interaction was also possible between Pro5 of the peptide to F46 of CD58. In CD2–CD58 interaction, K34 seems to play a major role (27). The peptide structure had a β-turn at Asp4-Pro5-Gly6-Asp7 stabilized by intramolecular hydrogen bonding between the C=O of Asp4 to NH of Asp7. This β-turn exposes the residues in the proper orientation to the CD58 protein for interaction. The proper orientation of important amino acid residues, the secondary structure of the peptide 3 may be responsible for the biological activity exhibited by P3.
Figure 8.
A) Docked structure of P3 to CD58 protein domain D1. Two clusters with low docking energy are shown in the figure. B) Docked structure of P3 on the adhesion domain of CD58. Detailed interactions of P3 and CD58 protein are shown here. Amino acids of the peptide are labeled with three letter code, and amino acids of protein CD58 are labeled with single letter code for clarity. Interaction of Tyr3 and Asp4 and Pro5 of the peptide with K34 and F46 of protein CD58 are shown.
Docking of P4 to CD58
The results from docking of P4 on CD58 were similar to those obtained from P3-CD58 docking with cluster 1 with low energy partially covering the CD2–CD58 interacting surface. As mentioned above, P3 and P4 have similar sequences but differ in cyclization method. The side chain of Asp7 formed a hydrogen bond with the backbone of K32 of CD58; the side chain of Tyr 3 of P4 formed a hydrogen bond with R44 of CD58. Both Pro5 and Tyr3 of P4 interact with the K34 aliphatic group and the F46 aromatic group, forming a hydrophobic pocket (Supporting Information). Docking results indicated that the overall interactions of CD58 with P3 or P4 are similar.
In vivo studies
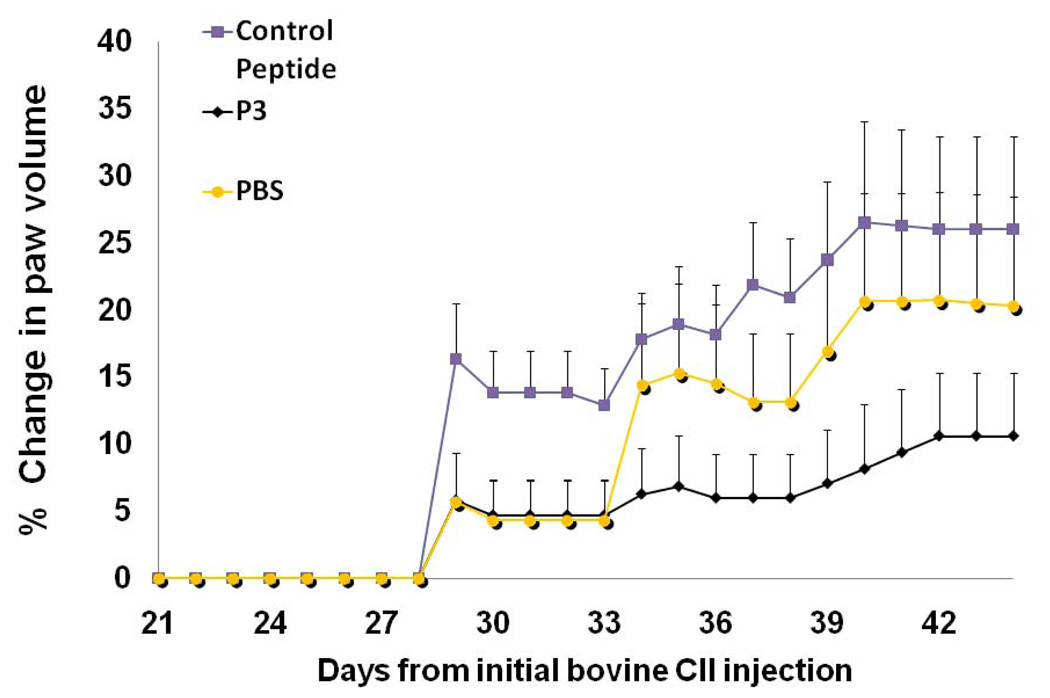
The efficacy of the peptides from CD2 to suppress rheumatoid arthritis was evaluated in the CIA mouse model (8, 34, 35). Peptide P3 was chosen for in vivo studies. P3 and P4 also have shown similar cell adhesion inhibition activity (23). P3 was cyclized by main chain cyclization and, hence stable against enzymatic degradation. Arthritis was induced in female DBA/1 mice (Harlan Labs, Indianapolis, IN) by immunization twice with collagen-II (CII) in Freund’s adjuvant as described in experimental section. Grouping of animals is shown in Table 2. Between days 25 and 30 after the first collagen injection (day 0), swelling of the joints was observed in mice treated with CII. In contrast, no changes in the joints were observed for animals in the control group, which did not receive CII. A comparison of the hind limbs of a normal (G1 group) (Supporting Information, Figure 6A) and an arthritic mouse (G2 group) indicated severe inflammation in the arthritic mouse. There was generalized swelling of the lower extremities in the region of the tarsus and digital bones of the feet. Significant enlargement of the joint between the proximal and middle phalanx of the forth digit of the right hind foot is evident (data shown in Supporting Information, Figure 6B). The ability of peptide P3 to suppress CIA was evaluated by visual observation of limbs and by measuring the swelling of paws using a plethysmometer (34, 36). To demonstrate the suppression of arthritis with P3 peptide, we have plotted the data for G3, G4 and G5 mice groups. Figure 9 shows the volume of water displaced by the swollen paws for the P3-treated mice (G4 group) and control peptide mice (G3 group) (36). It is evident from Figure 9 that P3-treated mice showed a reduction in the swelling and had a delayed onset of disease after day 30 compared to mice injected with control peptide (G3 group). Statistical analysis suggests significant differences between mice treated with P3 (G4) and control peptide (G3) (P < 0.01, through days 39–44), as well as between P3-treated mice and PBS-treated mice (G5) (P < 0.01, through days 39–44).
Table 2.
Grouping of mice for in vivo studies. n=8 used for arthritis score, n=4 used for histopathology analysis.
| Group | Description |
|---|---|
| G1 | Control group—Normal mice, no arthritis |
| G2 | Arthritic mice-injected with collagen, no treatment |
| G3 | Arthritic mice treated with control peptide |
| G4 | Arthritic mice treated with P3 peptide |
| G5 | Arthritic mice treated with PBS |
Figure 9.
The effect of P3 on collagen-induced arthritis in mice. Five groups of eight mice were used in the study. P3 was injected from days 22 to 32 on alternative days. PBS-phosphate-buffered saline, a control peptide (CII-3). Dosing of the peptide was 2.5 mg/kg in PBS. Data shows average change in paw volumes of all mice in the group ± SEM (n = 8). The standard errors of mean bars are plotted only on one side (top side) for clarity. P <0.01 for P3 treated mice when compared to PBS and control peptide treated mice. There was a significant difference between the average scores of mice injected with control peptide (G3) and arthritic mice treated with peptide P3 (G4).
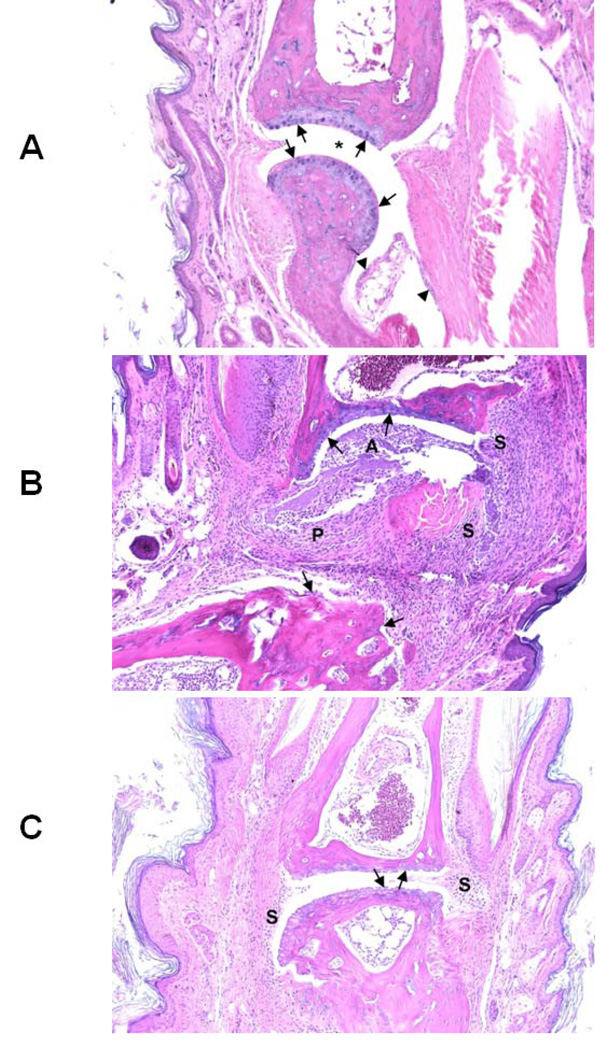
After 55 days, the mice were sacrificed and histopathology of the hind limbs was completed. Representative tissue sections taken from each group of mice are shown in Figure 10. For simplicity we will discuss mice groups G1, G2, and G4. A normal phalangeal joint of the hind foot of a control mouse (G1 group) without intradermal injection of type II collagen (CII) is shown in Figure 10A. Cartilaginous surfaces are intact and smooth (arrows) with normal synovium (arrowheads) and clear joint space (*). Mice injected with CII without further treatment (G2 group) manifested severe arthritis as shown in Figure 10B. There was marked cartilage and bone erosion. The synovium and synovial stroma were markedly thickened by granulation tissue and infiltrated with mixed inflammatory cells, including lymphocytes, macrophages, and fewer neutrophils. The articular spaces commonly contained tissue ditritus, fibrin, and mixed inflammatory cells. Arthritis mice treated with P3 (G4 group) showed milder degenerative joint changes, microscopically. There was some erosion of the articular cartilage of phalanges with minimal to mild hyperplasia of the synovium, but, in contrast, mice in this treatment group lacked both significant pannus and inflammatory exudate (Figure 10C). The results from in vivo studies suggest that peptide P3 delays or suppresses RA in mice presumably by immunomodulation.
Figure 10.
Representative tissue sections taken from G1, G2 and G4 group of mice (see Table 2 for grouping) are shown in the figure. A) Normal phalangeal joints of hind foot of control mouse without intradermal injection of type II collagen (CII) (4 mice in each group). Cartilaginous surfaces are intact and smooth (arrows) with normal synovium (arrowheads) and clear joint space (*). B) Severely arthritic phalangeal joint of hind foot of mouse intradermally injected with CII without further treatment. Marked cartilaginous and bone erosion (arrows) are present with severe pannus formation (P) and synovitis (S). The articular space (A) is filled with tissue detritus, fibrin, and mixed inflammatory cells. C) Mildly arthritic phalangeal joint of hind foot of mouse intradermally injected with CII and treated with P3. Both cartilaginous surfaces of articulating phalanges are eroded (arrows) with slight synovial hyperplasia (S) but lacking both invasive pannus and significant inflammatory exudate. H&E staining. Original magnification ×100.
Conclusions and Future Directions
Peptides designed from the epitopes of the adhesion domain of CD2 protein inhibit cell adhesion interaction, and a conformationally constrained P3 peptide derived from CD2 binds to CD58 protein. A working model for peptide binding to CD58 protein was proposed based on the docking studies, which suggest that peptide P3 binds to CD58. Because P3 can block CD2–CD58 interactions, peptide P3 has the ability to suppress RA in the CIA mouse model. Future studies will be focused on modification of peptide P3 to enhance its efficacy by incorporating β-strand inducing organic moieties. Modifications in the peptide include introduction of Pro-(D)-Pro sequence and dibenzofuran moiety (37–39) at the β-turn region to induce β-strand in the peptide structure and also to stabilize the peptide against enzymatic degradation. This modification will be guided using the data from binding studies of P3 to CD58 using transfer NOE data in future studies.
Experimental
Peptides
The linear control peptide (Table 1) was designed and synthesized, and the cyclic peptides were purchased from Aroztech, LLC (Cincinnati, OH). The pure products were analyzed by HPLC, electrospray mass spectrometry (ESI-MS). and high resolution mass spectrometry (HR-MS). The HPLC chromatogram showed that the purities of the peptides were more than 90%, and ESI-MS showed the correct molecular ion for the peptides.
Cell Lines
The human colon adenocarcinoma cell lines (Caco-2) were obtained from the American Type Culture Collection (Rockville, MD). Caco-2 cells were maintained in minimum essential medium-α containing 10% FBS, 1% nonessential amino acids, 1 mM Na-pyruvate, 1% L-glutamine, and 100 mg/L of penicillin/streptomycin.
Fluorescence assay
Caco-2 cells were plated at a density of 1 × 10⁴ cells/well in a 96-well tissue culture plate and were incubated at 37°C with 5% CO2 for 24 hours. Various concentrations of FITC-P4 peptide (100 µM, 50 µM, and 10 µM), FITC, and FITC-anti-CD58 were prepared in PBS and diluted in PBS for appropriate concentrations. 100 µL of peptide, anti-CD58, and FITC were added to the well plates in triplicate. After the plates were incubated for 2 hours at room temperature and washed three times with deionized water, fluorescence was quantified using a fluorescence plate reader (FLx800, BioTek, Winooski, VT) with an excitation wavelength of 485 nm and emission wavelength at 535 nm. Statistical analysis of the data was performed by using JMP4 software (Texas Instruments, Cary, NC). One-way Anova analysis was performed on the data, and P values were calculated by comparing each data point at a particular concentration of FITC-P4 to data from cells only.
Fluorescence Microscopy
Green fluorescence emitted by the cell suspensions as well as fixed cells was examined under a fluorescence microscope (Olympus America Inc., Center Valley, PA) at 20× and 40× magnification. Cell suspensions prepared for microplate reading were observed under the microscope. For fixing the cells on slides, the following procedure was used. About 20,000 cells/mL of Caco-2 cells in appropriate medium were plated in each well of the multichamber slide and incubated for about 24 hours. At the end of the incubation period, cells were fixed with 100% methanol kept at a temperature of −20°C. The wells were dried at the end of 5 minutes and washed twice with PBS. Peptides and anti-CD58 stock solutions were prepared in PBS. 150–200 µL of different concentrations of peptide, FITC, and FITC-labeled antibody were added to the appropriate washed wells and incubated for about 2 hours. Dilutions of peptides, FITC, and FITC-labeled antibody were made in 2% normal blocking serum solution. At the end of 2 hours, cells were washed three times with PBS. 2% normal blocking serum solution was added. The wells were washed twice with PBS at the end of 30 minutes. The slide was then mounted with the fluorescence mounting medium and the images observed for fluorescence. Photographs were taken with 20× magnification. For final presentation, images from fixed cells were used.
Antibody binding inhibition assay
The objective of this experiment was to show that peptides derived from CD2 inhibit the binding of fluorescently labeled anti-CD58 with CD58 expressing Caco-2 cells. Stock solutions of peptides were prepared by dissolving the peptides in PBS and diluting with PBS to obtain the desired concentration. About 1 × 10⁴ Caco-2 cells were seeded in 96-well plates and incubated with 180 µM of P3 and P4 peptides for 1 h. Unbound peptide was removed by washing with PBS three times. Anti-CD58-FITC (2 µg/mL in PBS) (BD Biosciences, PharMingen, MD) was added to the cells, followed by incubation for 1 h. After incubation, unbound anti-CD58-FITC was removed by washing with PBS three times. The associated monolayer was lysed with 2% Triton X-100 in 0.1 M NaOH. 96-well plates for reading in a microplate fluorescence analyzer (Biotek) were prepared. Plates were read with an excitation wavelength of 485 nm and emission wavelength of 535 (±20) nm. Caco-2 cells without the peptide and a control peptide were used as controls. Values plotted are the mean of three independent experiments. P-value was calculated by comparing inhibition of P3 and P4 with control peptide.
Competitive binding of anti-CD58 and FITC-labeled P4 peptide to Caco-2 cells
The objective of this experiment was to evaluate the binding of FITC-labeled P4 to Caco-2 cells in the presence of anti-CD58. Experiments were carried out using different amounts of anti-CD58 with FITC-P4 at a fixed concentration, and at a fixed concentration of anti-CD58 and different amounts of FITC-P4. Antibody and FITC-labeled peptide solutions were prepared in PBS at desired concentrations. For the first set of experiments, about 1 × 10⁴ Caco-2 cells were seeded in 96-well plates and, after confluency, the cells were incubated with 1.25, 12.5, and 18.5 µg/mL concentrations of anti-CD58 for 1 h. Cells with only PBS and 100 µM of FITC-peptide in the absence of anti-CD58 were used as controls. After washing with PBS, 100 µL of FITC-labeled P4 was added in PBS and the cells were incubated for 1.5 hour. At the end of the incubation period, the cells were washed three times with PBS and 100 µL of fresh PBS was added to each well. The plate was read in a fluorescence plate reader with an excitation wavelength of 485 nm and emission wavelength of 535 (±20) nm. Values of fluorescence were subtracted from fluorescence due to cells only and plotted as the mean of three independent experiments.
In a second set of experiments, a fixed amount of anti-CD58 was added to wells with Caco-2 cells as mentioned above. After incubating the plate for 1 hr with 6.25 µg/mL of anti-CD58 and washing with PBS, different concentrations of FITC-P4 (200, 100, 50 and 10 µM) were added to each well. Cells with only PBS and 100 µM of FITC-peptide in the absence of anti-CD58 were used as controls. After incubation (1.5 hr) and washing, the plate was read in a fluorescence plate reader with an excitation wavelength of 485 nm and emission wavelength of 535 (±20) nm. Values of fluorescence were subtracted from the fluorescence due to cells only and plotted as the mean of three independent experiments. Statistical analysis of the data was carried out, and P values were used for comparison.
Cell Viability Assay
Peptides that exhibited effects on Jurkat-Caco-2 adherence were tested by MTT (28) and/or CellTiter-Glo assay (Promega Corporation Madison, WI) (29) to determine if their effects were due to toxicity. Peptide stock solutions were prepared in water and diluted with serum-free medium to obtain the desired concentration. Different concentrations (180, 150, 120, and 90 µM) of peptide were added to Caco-2 cells and incubated for 1.5 hours, which is the maximum time of exposure of Caco-2/Jurkat cells during the adherence assay. The cell viabilities were validated by CellTiter-Glo assay. After the compounds were incubated with cells, the wells were washed with PBS, and 100 µL of CellTiter-Glo reagent was added to cells containing 100 µL medium. The plates were equilibrated for 10 minutes, and luminescence from the cells with and without the compounds was read on a Biotek microplate reader using blank cells with 0.1% SDS and 1% DMSO. The luminescence values obtained at each concentration (triplicates for each run and two independent runs were carried out) were averaged and adjusted by subtraction of blank values (wells without cells). Cell viabilities were calculated.
NMR Spectroscopy
The sample for the NMR spectrum of P3 peptide was prepared by dissolving 1 mg of the peptide in 0.7 mL of 90% H2O/10% D2O. The pH of the sample was adjusted to 7.0 by adding aliquots of NaOD in D2O. One-dimensional NMR experiments were performed on a 700 MHz Spectrometer. Spectra were acquired at 291 K unless otherwise specified. For peptide P3, protein CD58 interaction studies, titration of protein CD58, was carried out by adding 10 µL of protein (recombinant CD58 protein, extracellular domain, R & D Systems, Minneapolis, MN) sample directly into the NMR tube containing peptide P3. The maximum total volume added was 50 µL, and the concentration of protein was 20 µM. 1D-NMR was acquired for different protein–to-peptide concentration ratios (1:1000 to 1: 80). Experiments were repeated for a control peptide (Table 1).
Docking
Docking of P3 and P4 peptides to CD58 protein was performed using AUTODOCK software (33). CD58 crystal structure was obtained from a protein databank (1QA9). The crystal structure of the complex of CD2–CD58 was downloaded, and CD2 molecule and solvent molecules were removed from the pdb file. Polar hydrogen atoms were added to the structure. A grid box with dimensions of 128×128×128 Å3 was used for calculations covering the residues 22–32 and CD2 binding surface of CD58 protein. Three-dimensional structures of P3 and P4 were determined as described earlier (23). Structures of P3 and P4 were saved as mol2 files and converted to pdbqt files in Autodock using Autodock tools. Ligands P3 and P4 were made flexible for docking calculations, which were performed in two stages. First, a trial was carried out with 10 runs and 250 thousand energy evaluations. In the second stage, 100 runs with 25 million evaluations were carried out using Lamarkian genetic algorithm for docking. Docking calculations were performed on Linux cluster on high performance supercomputers at LSU Baton Rouge. Docked structures were listed in increasing order of energy, and low energy clusters were used as the most probable binding models. Structures from low energy docking were displayed and analyzed using PyMol software (40). Amino acids from the peptide are designated with three-letter codes and amino acids from protein are designated with one-letter codes in the text for the sake of clarity.
In vivo studies
Female DBA/1 mice were obtained from Harlan Labs (Indianapolis, IN) for in vivo studies. Mice were placed into five groups with 12 mice in each group (Table 2) (G1-control, G2-arthritic mice, G3-arthritic mice treated with control peptide (note that the control peptide used in this case was CII-3 (QYMRADEADSTLR), a peptide that does not exhibit any RA suppression activity as reported earlier) (41), G4-arthritis mice treated with peptide P3, G5-arthritis mice treated with PBS. Out of 12 mice in each group, 8 mice were used for arthritis scoring and 4 mice were used for histopathology analysis. RA was induced in mice by intradermal injection of type II (CII) collagen formulation (CII emulsified in Freund’s complete adjuvant, CFA) using published procedures (8, 34, 35). The emulsion, containing 100 µg of CII (in 100 µL of formulation), was injected intradermally at the base of the tail for the first immunization. After 21 days, an emulsion of the same concentration (with incomplete Freund’s adjuvant, IFA) was made and injected intra-dermally as the second immunization (34, 35). Peptide P3 and control peptide were dissolved in PBS and diluted with PBS to obtain the desired concentrations. From the 22nd day to the 32nd day, the mice were injected with control peptide or P3 (Table 1) on alternate days (5 injections, daily dosing was not possible because of scarring in tail vein). Peptides or PBS were injected via i.v. route at the tail vein. The dosage of the peptide was 2.5 mg/kg in 100 µL total volume of PBS. All the mice were observed from day 21 to day 55 for signs of arthritis. The visual appearance of the limbs was graded on a scale of 0–4 as well as by measuring the swelling of limbs using a plethysmometer (34, 36). Plethysmometer is a microcontrolled volume meter, specially designed for accurate measurement of the rat/mouse paw swelling. The amount of water displaced due to the swelling of the limbs is an accurate method of objectively measuring the severity and the progression of the disease. The more swollen the limbs are, the more water is displaced. The change in the total volume displaced by the four limbs for each mouse was compared to baseline (no disease) (36). For final representation, graphs were plotted with change in volume of water with swelling of limbs as arthritis score vs. time in days. Statistical differences among the groups in clinical disease scores were determined by one-way analysis of variance followed by Fisher’s least significant difference. All analyses were performed using StatView (SAS Institute, Cary, NC). The mice were sacrificed on day 55. For histopathology analyses 4 mice from each group of mice described above were used. Their hind limbs were removed and fixed using 10% formalin before decalcification of the bone tissue. These samples were embedded in paraffin and sectioned into 5 µM thick slices for histological analysis. Sections were stained with haematoxylin and eosin (H & E).
Supplementary Material
Acknowledgments
Part of the work described in this paper was supported by the Louisiana Board of Regents grant LEQSF(2009–12)-RD-A-23(SJ). Docking calculations were performed using Dell Clusters, Louisiana Optical Network Initiative (LONI) computer resources. TJS was supported by NIH R01 AI063002 and BB was supported by NIH training grant T32 GM-08359. Ms. Sumana Giddu performed some preliminary studies on CIA mice models.
Footnotes
Supporting Information Available: HPLC, MS, purity data, and confocal microscopy data.
References
- 1.Springer TA. Adhesion receptors of the immune system. Nature. 1990;346:425–434. doi: 10.1038/346425a0. [DOI] [PubMed] [Google Scholar]
- 2.Bierer BE, Burakoff SJ. T cell adhesion molecules. FASEB J. 1998;2:2584–2590. doi: 10.1096/fasebj.2.10.2838364. [DOI] [PubMed] [Google Scholar]
- 3.Anderson ME, Siahaan TJ. Targeting ICAM-1/LFA-1 interaction for controlling autoimmune diseases: designing peptide and small molecule inhibitors. Peptides. 2003;24:487–501. doi: 10.1016/s0196-9781(03)00083-4. [DOI] [PubMed] [Google Scholar]
- 4.Kamradt T, Mitchison NA. Tolerance and autoimmunity. N Engl J Med. 2001;344:655–661. doi: 10.1056/NEJM200103013440907. [DOI] [PubMed] [Google Scholar]
- 5.Mcmurray RW. Adhesion molecules in autoimmune disease. Semin Arthritis Rheum. 1996;25:215–233. doi: 10.1016/s0049-0172(96)80034-5. [DOI] [PubMed] [Google Scholar]
- 6.Cemerski S, Shaw A. Immune synapse in T-cell activation. Curr Opin Immunol. 2006;18:1–7. doi: 10.1016/j.coi.2006.03.011. [DOI] [PubMed] [Google Scholar]
- 7.Van der Merwe PA, Davis SJ. Molecular interactions mediating T cell antigen. Annu Rev Immunol. 2003;21:659–684. doi: 10.1146/annurev.immunol.21.120601.141036. [DOI] [PubMed] [Google Scholar]
- 8.Kannan K, Ortmann RA, Kimpel D. Animal model of rheumatoid arthritis and their relevance to human disease. Pathophysiology. 2005;12:167–181. doi: 10.1016/j.pathophys.2005.07.011. [DOI] [PubMed] [Google Scholar]
- 9.Takahashi H, Soderstrom K, Nilsson E, Kiessling R, Patarroyo M. Integrins and other adhesion molecules on lymphocytes from synovial fluid and peripheral blood of rheumatoid arthritis patients. Eur J Immunol. 1992;22:2879–2885. doi: 10.1002/eji.1830221119. [DOI] [PubMed] [Google Scholar]
- 10.Hale LP, Martin ME, McCollum DE, Nunley JA, Springer TA, Singer KH, Haynes BF. Immunohistologic analysis of the distribution of cell adhesion molecules within the inflammatory synovial microenvironment. Arth Rheum. 1989;32:22–30. doi: 10.1002/anr.1780320105. [DOI] [PubMed] [Google Scholar]
- 11.Hoffmann JC, Bayer B, Zeidler H. Characterization of a soluble form of CD58 in synovial fluid of patients with rheumatoid arthritis (RA) Clin Exp Immunol. 1996;104:460–466. doi: 10.1046/j.1365-2249.1996.41749.x. [DOI] [PMC free article] [PubMed] [Google Scholar]
- 12.Mojcik CF, Shevach E. Adhesion molecules: a rheumatologic perspective. Arth Rheum. 1997;6:991–1004. doi: 10.1002/art.1780400602. [DOI] [PubMed] [Google Scholar]
- 13.Przepiorka D, Phillips GL, Ratanatharathorn V, Cottler-Fox M, Sehn LH, Antin JH, LeBherz D, Awwad M, Hope J, McClain JB. A phase II study of BTI-322, a monoclonal anti-CD2 antibody, for treatment of steroid-resistant acute graft-versus-host disease. Blood. 1998;92:4066–4071. [PubMed] [Google Scholar]
- 14.Hoffmann JC, Herklotz C, Zeidler H, Bayer B, Rosenthal H, Westermann J. Initiation and perpetuation of rat adjuvant arthritis is inhibited by the anti-CD2 monoclonal antibody (mAb) OX34. Ann Rheum Dis. 1997;56:716–722. doi: 10.1136/ard.56.12.716. [DOI] [PMC free article] [PubMed] [Google Scholar]
- 15.Sido B, Dengler TJ, Otto G. Differential immunosuppressive activity of monoclonal CD2 antibodies on allograft rejection versus specific antibody production. Eur J Immunol. 1998;28:1347–1357. doi: 10.1002/(SICI)1521-4141(199804)28:04<1347::AID-IMMU1347>3.0.CO;2-L. [DOI] [PubMed] [Google Scholar]
- 16.Squifflet JP, Besse T, Malaise J, Mourad M, Delcorde C, Hope JA, Pirson Y. BTI-322 for induction therapy after renal transplantation: a randomized study. Transplant Proc. 1997;29:317–319. doi: 10.1016/s0041-1345(96)00282-5. [DOI] [PubMed] [Google Scholar]
- 17.Mourad M, Besse T, Malaise J, Baldi A, Latinne D, Bazin H, Pirson Y, Hope J, Squifflet JP. BTI-322 for acute rejection after renal transplantation. Transplant Proc. 1997;29:2353–2353. doi: 10.1016/s0041-1345(97)00398-9. [DOI] [PubMed] [Google Scholar]
- 18.Mrowietz U. Treatment targeted to cell surface epitopes. Clin Exp Derm. 2002;27:591–596. doi: 10.1046/j.1365-2230.2002.01171.x. [DOI] [PubMed] [Google Scholar]
- 19.Braun J, Sieper J. Role of novel biological therapies in psoriatic arthritis: effects on joints and skin. Biodrugs. 2003;17:187–199. doi: 10.2165/00063030-200317030-00005. [DOI] [PubMed] [Google Scholar]
- 20.Leader B, Baca QJ, Golan DE. Protein therapeutics: a summary and pharmacological classification. Nat Rev Drug Discov. 2008;7:21–39. doi: 10.1038/nrd2399. [DOI] [PubMed] [Google Scholar]
- 21.Hruby VJ. Designing peptide receptor agonists and antagonists. Nat Rev Drug Discov. 2002;1:847–856. doi: 10.1038/nrd939. [DOI] [PubMed] [Google Scholar]
- 22.Liu J, Li C, Ke S, Satyanarayanajois SD. Structure-based rational design of beta-hairpin peptides from discontinuous epitopes of cluster of differentiation 2 (CD2) protein to modulate cell adhesion interaction. J Med Chem. 2007;50:4038–4047. doi: 10.1021/jm0700868. [DOI] [PubMed] [Google Scholar]
- 23.Giddu S, Subramanian V, Yoon HS, Satyanarayanajois SD. Design of beta-hairpin peptides for modulation of cell adhesion by beta-turn constraint. J Med Chem. 2009;52:726–736. doi: 10.1021/jm8008212. [DOI] [PubMed] [Google Scholar]
- 24.Li C, Satyanarayanajois SD. Structure-function studies of peptides for cell adhesion inhibition: identification of key residues by alanine mutation and peptide-truncation approach. Peptides. 2007;28:1498–1508. doi: 10.1016/j.peptides.2007.07.003. [DOI] [PubMed] [Google Scholar]
- 25.Wang J, Smolyar A, Tan K, Liu J, Kim M, Sun ZJ, Wagner G, Reinherz EL. Structure of a heterophilic adhesion complex between the human CD2 and CD58 (LFA-3) counterreceptors. Cell. 1999;97:791–803. doi: 10.1016/s0092-8674(00)80790-4. [DOI] [PubMed] [Google Scholar]
- 26.Davis SJ, Davies EA, Tucknott MG, Jones EY, van der Merwe PA. The role of charged residues mediating low affinity protein-protein recognition at the cell surface by CD2. Proc Natl Acad Sci USA. 1998;95:5490–5494. doi: 10.1073/pnas.95.10.5490. [DOI] [PMC free article] [PubMed] [Google Scholar]
- 27.Kim M, Sun ZY, Byron O, Campbell G, Wagner G, Wang J, Reinherz EL. Molecular dissection of the CD2–C58 counter-receptor interface identifies CD2 Tyr86 and CD58 Lys34 residues as the functional "hot spot". J Mol Biol. 2001;312:711–720. doi: 10.1006/jmbi.2001.4980. [DOI] [PubMed] [Google Scholar]
- 28.Mosmann T. Rapid colorimetric assay for cellular growth and survival: application to proliferation and cytotoxicity assays. J Immunol Methods. 1983;5:55–63. doi: 10.1016/0022-1759(83)90303-4. [DOI] [PubMed] [Google Scholar]
- 29.Riss T, Moravec R, Niles A. Selecting cell-based assays for drug discovery screening. Cell Notes. 2005;13:16–21. [Google Scholar]
- 30.Moore JM. NMR Techniques for characterization of ligand binding: Utility for lead generation and optimization in drug discovery. Biopolymers. 1999;51:221–243. doi: 10.1002/(SICI)1097-0282(1999)51:3<221::AID-BIP5>3.0.CO;2-9. [DOI] [PubMed] [Google Scholar]
- 31.Post CB. Exchange-transferred NOE spectroscopy and bound ligand structure determination. Curr Opin Struct Biol. 2003;13:581–588. doi: 10.1016/j.sbi.2003.09.012. [DOI] [PubMed] [Google Scholar]
- 32.Wuthrich K. NMR of Proteins and Nucleic Acids. New York: John Wiley & Sons; 1986. [Google Scholar]
- 33.Morris GM, Goodsell DS, Halliday RS, Huey R, Hart WE, Belew RK, Olson AJ. Automated docking using a Lamarckian genetic algorithm and empirical binding free energy function. J Comput Chem. 1998;19:1639–1662. [Google Scholar]
- 34.Brand DD, Latham KA, Rosloniec EF. Collagen-induced arthritis. Nature Protoc. 2007;2:1269–1275. doi: 10.1038/nprot.2007.173. [DOI] [PubMed] [Google Scholar]
- 35.Srinivasan M, Eri R, Zunt SL, Summerlin D-J, Brand DD, Blum JS. Suppression of immune responses in collagen-induced arthritis by a rationally designed CD80-binding peptide agent. Arthritis & Rheumatism. 2007;56:498–508. doi: 10.1002/art.22324. [DOI] [PubMed] [Google Scholar]
- 36.Morris CJ. Carrageenan-Induced Paw Edema in the Rat and Mouse in Methods. In: Winyard PG, Willoughby DA, editors. Molecular Biology: Inflammation Protocols. vol. 225. Totowa, NJ: Humana Press Inc.; 2003. pp. 115–121. [DOI] [PubMed] [Google Scholar]
- 37.Alba ED, Rico M, Jimenez MA. The turn sequences directs beta-strand alignment in designed beta-hairpins. Protein Science. 1999;8:2234–2244. doi: 10.1110/ps.8.11.2234. [DOI] [PMC free article] [PubMed] [Google Scholar]
- 38.Rai R, Aravinda S, Kanagarajadurai K, Raghothama S, Shamala N, Balaram P. Diproline templates as folding nuclei in designed peptides. Conformational analysis of synthetic peptide helices containing amino terminal Pro-Pro segments. J. Am. Chem. Soc. 2006;128:7916–7928. doi: 10.1021/ja060674v. [DOI] [PubMed] [Google Scholar]
- 39.Mayo KH, Dings RPM, Flader C, Nesmelova I, Hargittai B, van der Schaft DWJ, van Eijk LI, Walek D, Haseman J, Hoye TR, Griffioen AW. Design of a Partial peptide mimetic of anginex with antiangiogenic and anticancer activity. J. Biol. Chem. 2003;278:45746–45746. doi: 10.1074/jbc.M308608200. [DOI] [PubMed] [Google Scholar]
- 40.DeLano WL. The PyMOL Molecular Graphics System. San Carlos, CA USA: DeLano Scientific; 2002. http://www.pymol.org.Pymol. [Google Scholar]
- 41.Kobayashi N, Kobayashi H, Gu L, Malefyt T, Siahaan TJ. Antigen-specific suppression of experimental autoimmune encephalomyelitis by a novel bifunctional peptide inhibitor. J Pharmacol Exp Ther. 2007;322:879–886. doi: 10.1124/jpet.107.123257. [DOI] [PubMed] [Google Scholar]
Associated Data
This section collects any data citations, data availability statements, or supplementary materials included in this article.


