

Abstract
The conformational change observed upon ligand binding and phosphorylation for the cAMP-dependent protein kinase (protein kinase A—PKA) is of high importance for the regulation of its activity. We calculate pKa values and net charges for 18 3D structures of PKA in various conformations and liganded states to examine the role of electrostatics in ligand binding and activation. We find that the conformational change of PKA takes place without any significant net proton uptake/release at all pH values, thus indicating that PKA has evolved to reduce any pH-dependent barriers to the conformational motion. We furthermore find that the binding of ligands induces large changes in the net charge of PKA at most pH values, but significantly, we find that the net charge difference at physiological pH is close to zero, thus indicating that the active-site pKa values have been preorganized for substrate binding. We are unable to unequivocally resolve the identity of the groups responsible for determining the pH-activity profile of PKA but speculate that the titration of Lys 168 or the titration of ATP itself could be responsible for the loss of activity at high pH values. Finally, we examine the effect of point mutations on the pKa values of the PKA catalytic residues and find these to be relatively insensitive to both noncharge-altering and charge-altering mutations.
Keywords: PKA, pKa values, ligand binding, conformational changes, protein electrostatics, pKa calculations
Introduction
Protein kinases (PKs)1 alter the function of proteins and enzymes by phosphorylating these on alcoholic amino acid side chains. PKs play a major role in almost all intracellular signaling pathways in eukaryotic cells and therefore constitute a class of important drug targets.2 Scientific studies of the molecular mechanisms of PKs are abundant in scientific literature,3 and many of research laboratories focus their efforts on achieving a better understanding of one or more PKs.4 Of particular interest are the mechanisms responsible for the tight regulation of PK activity. In general, PKs are only able to catalyze their target reaction if they have been activated in some way, typically by phosphorylation. Phosphorylation and binding of substrates result in a large conformational change that positions the catalytic residues correctly and allows for catalysis to take place.
In this article, we explore how the conformational change, the binding of ligands, and the phosphorylation of PK residues affect the pKa values in the PK catalytic domain. We use the murine cAMP-dependent PK (protein kinase A—PKA) for our studies because the PDB holds a large number of X-ray structures of this protein in different conformations. The existence of many PKA structures makes it possible to explicitly determine the influence on protein structure plasticity on calculated pKa values without using molecular dynamics (MD)-generated snapshots that may or may not represent true conformational states. In our analysis, we are particularly interested in identifying possible proton uptake/release events upon ligand binding and protein conformational change as a number of recent studies have identified significant changes in protonation state upon protein–protein and protein–ligand complexation.5–8
In our analysis, we furthermore examine the catalytic machinery of PKA with a view to identifying the deprotonation event responsible for the loss of activity that PKA displays at high pH. In a related analysis, we explore the sensitivity of the active-site pKa values of PKA to investigate if PKA has evolved to “protect” the pKa values of certain important residues against the effect of single-point mutations, that is, that the network of electrostatic interactions in the active site in PKA is constructed in such a way that it buffers the pKa values of the residues involved in the catalytic reaction. We use a Poisson–Boltzmann-based pKa calculation algorithm9 to calculate titration curves for all titratable groups in PKA and evaluate these using a set of analysis procedures. Although the electrostatics of PKA has been examined before,10 we use an improved calculation scheme to arrive at new conclusions concerning the electrostatic- and pH-dependent features of PKA.
The activation process of murine PKA
The conformational change accompanying ligand binding and phosphorylation of PKA is remarkably well studied. A total of 101 crystal structures of PKA are available in the PDB, and 18 of these are of the murine PKA. PKA exists in a large number of conformational states ranging from an open (inactive) state to a closed (active) state. Three distinct states (open, intermediate, and closed) have been captured by X-ray crystallography, and these most likely correspond to the most populated states both in vivo and in vitro.
PKA consists of 350 amino acid residues, and the structure contains a small N-terminal domain and a larger C-terminal domain.11 The active site and the ATP-binding pocket is positioned at the interface of these two domains, whereas the peptide-binding cleft is formed mostly by residues in the C-terminal domain. The three conformational states of PKA differ mainly in the structure of the N-terminal domain, which rotates and opens away from the C-terminal, whereas the C-terminal domain itself remains largely unperturbed. Especially, the so-called “glycine-rich loop” undergoes a significant displacement of 6.5 Å (Ser 53 Cα), but also the β-strands of the N-terminal domain change position. It is beyond the scope of this article to provide an in-depth description of the conformational changes of PKA, and the reader is referred to several reviews and to the PDB files themselves.12–14 Significantly, the open state is less ordered than the two other states, and the wild-type enzyme can be crystallized in the open conformation only if neither MgATP nor a peptide substrate/inhibitor is present. It should be noted that the open state also has been observed for the E230Q mutation of PKA, thus pointing to a crucial role for this residue in regulating the conformational state of the molecule.15
The intermediate state is populated when MgATP or an ATP/ADP analog is present, and the closed active state is observed when both MgATP and a peptide substrate/inhibitor are present.12 However, the presence of MgATP and a substrate/inhibitor is not sufficient for stabilization of the closed conformation; PKA itself must also be phosphorylated on two residues: Thr 197 and Ser 338. Although Ser 338 is removed from the active-site cleft and seems only to stabilize the general structure, Thr 197 effectively bridges the mouth of the active-site cleft and thus significantly stabilizes the closed conformation. PKA is inactive if either Thr 197 or Ser 338 is dephosphorylated, and no X-ray structures of a dephosphorylated PKA have been determined.12,13
The catalytic mechanism of PKA
Catalysis in PKA proceeds via a linear tripartite transition state where the ATP-leaving phosphate group is positioned directly in between the accepting alcoholic oxygen and the donating oxygen on the β-phosphate of ATP.3,13,16 Several protein residues contribute to the stabilization of the transition state. Chief among these is Asp 166, whose negative charge oxygen stabilizes the lone pair on the accepting alcoholic, but also Lys 168 and Asp 184 contribute vital transition state-specific interactions. In addition to these residues, a host of residues provide interactions with ATP and the protein/peptide substrate. Many of the residues that are crucial to substrate binding and transition-state stabilization are titratable groups, and these are required to occupy a specific protonation state to provide the interactions required. The collective protonation state of these residues is called the catalytically competent protonation state (CCPS),17 and the CCPS of an enzyme can typically be determined by visually inspecting an X-ray structure of a substrate-bound form of the enzyme. Inspection of the PKA X-ray structure 1ATP reveals that the titratable groups of Lys 72, Glu 91, Glu 127, Asp 166, Lys 168, and Asp 184 play a direct role in binding MgATP or the transition state. In addition, the protonation state of the γ-phosphate is also critical. All of the aforementioned titratable groups are required to be in their charged state for substrate binding and catalysis to take place, but the charged state of these groups is destabilized because many of these groups are deeply buried in the PKA–MgATP–substrate complex. The burial of these groups is essential because the groups have to bind the substrate and facilitate catalysis, and PKA must therefore compensate for the destabilization of the charge on these residues by providing interactions that stabilize the charges essential for substrate binding and catalysis. It should be noted that in the enzyme–substrate complex some charges are likely stabilized by the substrates themselves (MgATP and the peptide substrate), but that it nevertheless is favorable to preorganize the protonation state of the enzyme for substrate binding.
In this article, we examine the mechanisms that PKA uses to perform this charge stabilization by calculating the effect that individual titratable groups and amino acid side chains have on the pKa values of the residues in the CCPS.
Protecting the CCPS
PKA occupies a key position in cell signaling as evidenced by its multiple roles.18 It is therefore important for the cell to maintain a functioning PKA molecule in its genome. In this respect, it is essential to maintain the appropriate pKa values for the active-site residues so that the PKA CCPS is populated and that PKA can catalyze its target reaction. Spontaneous point mutations occur many times during the evolution life time of a molecule, and mutations of the catalytic residues will normally render the molecule inactive. However, because only a small fraction of side chains are critical for function, the risk that these residues are mutated is quite small. The situation is slightly different when one considers the effect of introducing and removing titratable groups in the protein and the effect that this potentially has on the population of the CCPS. Because electrostatic interactions are long range and because networks of titratable groups often behave counterintuitively, it is not inconceivable that the insertion or removal of a single titratable group, or indeed the modification of the environment of a titratable group, could have a significant deleterious effect on the population of the PKA CCPS. This effect could be magnified or diminished depending on the exact way that the network of titratable groups is constructed. In this article, we examine if the network of titratable groups in PKA is particularly sensitive or insensitive to the removal of its constituent titratable groups. Specifically, we look for residues or networks of residues that “buffer” the effect that removal of a titratable group has on the pKa values of key residues in the CCPS.
Structure-based pKa calculations
A pKa value is fundamentally a description of the free energy difference between the protonated and deprotonated forms of a titratable group. pKa values can easily be measured in solution for compounds with a single titratable group using classic chemical titration techniques, but these methods are virtually useless for compounds containing more than a handful of titratable groups. Proteins sometimes contain hundreds of titratable groups, and it is therefore necessary to use time-consuming experimental procedures such as NMR spectroscopy19–21 to measure pKa values in proteins. pKa values have been measured for numerous proteins,22,23 but the difficulty of obtaining good NMR spectra for larger proteins combined with the cost associated with the experiments and the time needed is often prohibitive to obtaining experimental pKa values.
Structure-based pKa calculations aim to predict pKa values for titratable groups in proteins and currently achieve an accuracy of ±0.75 pKa units when benchmarked against a large set of pKa values.24 Various methods are used for calculating pKa values in proteins, but common to all of them is that the pKa value of the titratable group in solution is used as a starting point for the calculation.25 The solution pKa value for a titratable group is often referred to as the “model pKa value,” and structure-based pKa calculation techniques predict the pKa value of the titratable group in the protein by calculating how much the protein environment changes the energy difference between the protonated and deprotonated forms of the group.
The methods that pKa calculation algorithms use to calculate this perturbation are quite different, with Poisson–Boltzmann equation (PBE) solvers,26–28 empirical force fields,29 and MD simulations30–32 being used in various algorithms. Presently, there is no compelling difference in the performance of algorithms based on the underlying energy calculation methods (MD, PBE, etc.), and in this article, we use a validated PBE-based algorithm,9,33 which uses optimization of the hydrogen-bond network to achieve realistic modeling of the pH-dependent changes in the protonation state of the protein. Protein pKa value calculations have been used extensively to observe protonation state changes due to ligand binding7,8,34 and protein–protein binding5,34 and have proven to be a valuable analysis tool in these applications.
Results
The catalytic subunit of the murine cAMP-dependent PK (murine protein kinase A—mPKA)11 is one of the most well-characterized PKs, and the PDB contains a large number of X-ray structures of this protein in several conformational states. This makes mPKA an ideal target for analyzing the effect of the PK conformational on the pKa values in the enzyme. Because several X-ray structures are available for each conformational state, we have access to important data on the structural variation of each conformational state, in addition to the information regarding the conformational differences between states. In the following, we therefore analyze the variation of calculated pKa values for each conformational state (open, intermediate, and closed state). This analysis gives us information on the variation of pKa values within a conformational state. Using this information, we compare pKa values between states to identify residues that change protonation state when PKA switches conformation.
We also examine the effects that ligand binding and phosphorylation have on the pKa values of the closed form of PKA and use this information to analyze how the PKA CCPS is maintained in the enzyme. Specifically, we investigate which residues and titratable groups have an impact on the pKa values of the residues constituting the CCPS. We examine if the murine PKA has evolved to protect the protonation states of specific residues against point mutations as outlined in the introduction. We calculate the effects (the ΔpKa values) of removing a single titratable group on the pKa values of the residues constituting the CCPS. We calculate how the set of interacting titratable groups in PKA respond to the change, and we compare this with the response produced if the titratable groups in PKA are not allowed to interact (see later). This analysis allows us to study the role of the PKA electrostatic network in modulating mutation-induced ΔpKa values.
pKa values of the open, intermediate, and closed forms of apo PKA
We begin our analysis by considering the pKa values of the closed state of PKA in the absence of ligands. Figure 1 shows the span of pKa values for the PKA titratable groups as calculated from the nine structures of PKA in its closed conformation (see Materials and Methods). Before calculation, all ligands and phosphate groups were stripped from these PDB files, and in the following, we refer to these calculations as being performed on “apo-generated” structures.
Figure 1.

Average calculated pKa values ± 1 standard deviation for the nine apo calculations of PKA in its closed form. The pKa value distribution is displayed as a bar centered on the average pKa value and extending to −1 standard deviation to +1 standard deviation. Only pKa values for residues with a heavy atom within 10 Å of ATP or Mg2+ in the 1ATP X-ray structure are shown. Supporting Information Figure S1 shows calculated pKa values for all residues.
Variability of calculated pKa values
Supporting Information Figure S2 shows large variation in the calculated pKa values for a large number of residues, and one can identify four structural regions with differing degrees of variability (Fig. 2). Regions I and II display high and medium variability in pKa values (average standard deviations of 1.0 and 0.75 pKa units, respectively), whereas regions III and IV display low variability (average maximum differences of 0.5 and 0.6 pKa units). Region I comprises residues in the N-terminal domain (residues 15–127) and the titratable groups in this region generally display a high variability in their pKa values (average standard deviation 1.0 units), especially for the basic residues.
Figure 2.
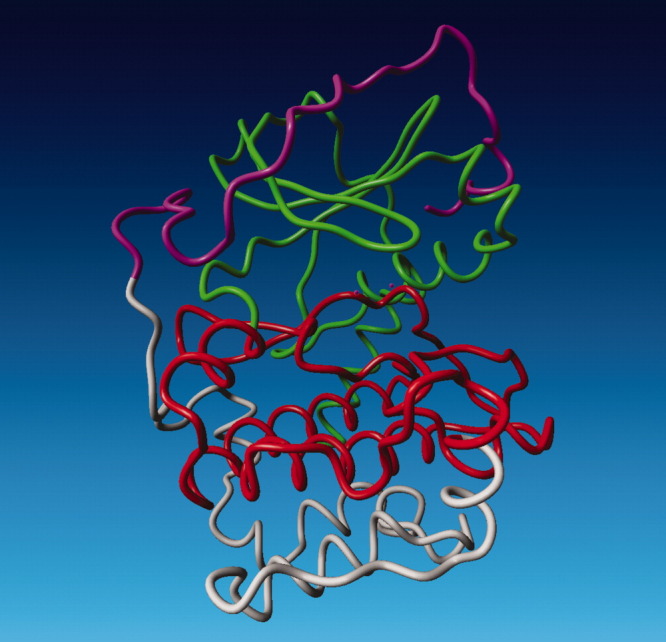
The four structural regions that can be identified from pKa calculations on the apo-generated structures of PKA. Region I: residues 1–127 (green), region II: residues 128–247 (red), region III: residues 248–317 (white), and region IV: residues 318–350 (magenta). Figure produced with Yasara.35
The residues in region II (residues 127–247) display a lower variability in the pKa values of the titratable groups typically charged at pH 7.0 (Asp, Glu, His, Arg, and Lys), reflecting the more stable structure of the C-terminal domain. However, a large number of buried Tyr residues in this region display a highly variable pKa values, thus indicating that the pKa values of these residues are very sensitive to the details of the protein environment. None of these Tyr residues are predicted to be charged at physiological pH values, and the variability in their calculated pKa values is therefore of little practical consequence.
The residues in regions III (residues 247–317) and IV (residues 317–350) display a low variability in the calculated pKa values and are characterized by the absence of Tyr residues because of the higher surface exposure of the residues in these regions. Region III forms the “bottom” of the C-terminal domain, whereas region IV (residues 317–350) constitutes the C-terminal end that wraps around the N-terminal domain. Interestingly, the variability of the calculated pKa values in region IV is much lower than that observed for region I, thus indicating that the structural variability observed for region I does not influence the pKa values in region IV despite the proximity of the two regions. The variability of the calculated pKa values mirrors the structural heterogeneity observed for PKA in its closed form. Residues in the N-terminal domain display larger variability because this domain is more dynamic and flexible than the C-terminal domain. The exception from this relationship is region IV, which displays a low variability in its constituent pKa values despite a relatively high structural heterogeneity and its proximity to the N-terminal domain.
Figure 1 shows the same values as Figure S1 for the subset of titratable residues with a heavy atom within 10.0 Å of an atom in the ATP molecule or the Mg2+ ions in the 1ATP PDB file. These residues comprise the ATP-binding residues and the catalytic machinery of PKA. It is noteworthy that the catalytic Asp 166 consistently is predicted to have a very low pKa value when PKA occupied the closed conformation.
pKa value changes induced by conformational changes
We now turn our attention to differences in pKa values and overall charge of the three conformational states of pKa. Figure 3 displays the average charge difference at pH 7.0 between the three different states (open, intermediate, and closed) when calculating pKa values using apo structures and apo-generated structures (see Materials and Methods). The average charge difference between the three states is less than 1.5 e at all pH values, and the standard deviation of the charge of the closed state exceeds the mean difference between states at all pH values below 7.0. Above pH 7, the open state becomes slightly more negatively charged than the closed state, and the intermediate state is briefly more positively charged. However, overall there are no large charge differences between the three conformations due to a change in the protein structure. Figure 4 shows all titratable groups for which the average charge difference between the closed state and either the intermediate and open states exceeds 0.02 e. When taking the standard deviations of the average charges into account, the only significant change in charge is observed for Glu 170 between the closed and intermediate states. Although the change in charge is larger than 1 standard deviation, it only amounts to 0.14 e and is therefore not likely to be of any particular significance given the general accuracy of the pKa calculation algorithm used here.
Figure 3.

The average calculated charge of apo PDB files (ligands not present in PDB file or ligands removed before pKa calculation) classified as being in the open, intermediate, or closed state. The average charge is reported as the difference to the average charge of the structures in the closed conformation. Error bars indicate the standard deviation of the average charge for each state.
Figure 4.
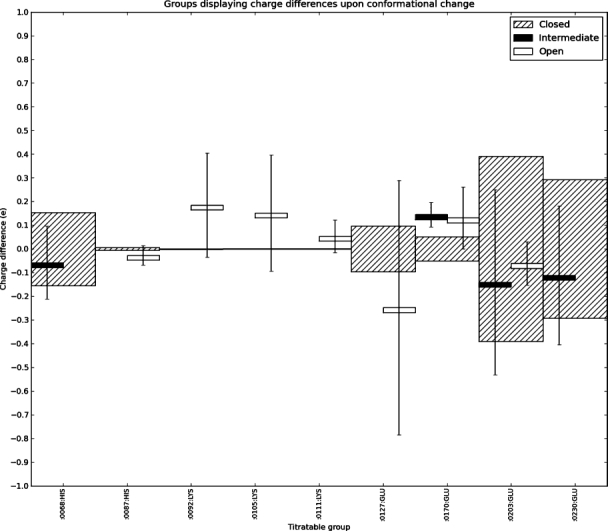
Titratable groups that change their fractional degree of protonation at pH 7.0 more than 0.02 e when PKA changes conformation in the absence of ligands and phosphate groups. The striped bars are centered on 0.0 and display the standard deviation of the fractional charge of groups in the closed conformation as calculated from the nine apo-generated structures. The black and white boxes display the average charge differences for the intermediate and open structures, respectively, with the corresponding standard deviations indicated by black lines.
Remarkably, the PKA conformational change itself thus occurs without any significant change in the net charge of the protein and, furthermore, occurs without any internal transfer of protons between titratable groups. In terms of energetics, there are, thus, no proton uptake/release barriers between the three observed conformational states for PKA. Proteins that undergo large conformational changes upon ligand binding have been found to sample the conformation of the ligand-bound state even in their apo form and in this way facilitate ligand binding. It is tempting to speculate that PKA has evolved to allow such sampling of its conformational states and enable ligand binding by always maintaining the same charge state for its titratable groups. Note that the calculations discussed here consider only the effect of changes in the protein coordinates and that the introduction of charges by phosphorylation and substrate binding is excluded from these calculations.
Phosphorylation and the binding of ligands to PKA
The binding of ligands to PKA and the phosphorylation is expected to perturb the pKa values of PKA significantly and alter the net charge of the molecule. When examining the influence of ligands, we consider their effects on the protonation states of the protein residues without “counting” the charges on the ligands themselves. Figure 5, thus, shows the change in the charge of protein titratable groups only when the pKa values are recalculated on structures derived from 1ATP with various combinations of ligands and phosphate groups present. Note that the ligands carry full charges in the calculations (although those charges are not allowed titrate) and that the net charges in Figure 5 thus have been adjusted for ligand charges to better allow for a comparison of the effect of ligands on the protein titratable groups. It is remarkable that the protonation states of only two groups are affected significantly by the binding of ligands and the presence of the phosphate groups, His 87 and Lys 168 (Fig. 6). The positive charge on His 87 is stabilized by the interaction with the phosphorylated Thr 197 (−2 charge), whereas Lys 168 is predicted to become neutral in the calculation with ATP2− when both MgATP and PKI (or the substrate) are bound. The effect on His 87 is clear and is easily explained by examining the X-ray structure, whereas the loss of the positive charge on Lys 168 is somewhat more puzzling and can be traced to be a result of the weak charge on ATP (−2) in this particular calculation. The calculation predicts the charged state to be disfavored by a very strong interaction with the nearby Mg2+ ions, that is not compensated adequately by the interactions with the phosphate groups of ATP, Asp 166, and Asp 184 and by a hydrogen bond from Thr 201 Oγ. However, this conclusion is highly dependent on the charge state used for ATP. In the calculations where the charge of ATP is −3 and −4 (these are the most realistic charge states for ATP bound to PKA) the pKa value of Lys 168 increases to 8.8 and 19.7, respectively, thus effectively disproving the loss of the charge on Lys 168 observed in the ATP2− calculations. Calculations where ATP and the phosphate groups are allowed to titrate indicate that the phosphate groups on Thr 197 and Ser 338 only exist in the −2 state from pH 4 to 10, and that ATP similarly also only exists in the −4 state. Interestingly, the calculations show that the large unfavorable desolvation energy for ATP4− is easily compensated by the favorable interaction provided by multiple hydrogen bonds and the two Mg2+ ions present.
Figure 5.

Ligand-induced charge differences in PKA residues. Note that only 98 titratable groups present in all PKA structures are considered, charges on the ligands are not included.
Figure 6.

Titratable groups that change their charge when ligands bind to PKA.
The CCPS of PKA
From previous experimental studies and from the calculations above, it is clear that a number of titratable residues have to be maintained in a specific protonation state for catalysis to occur. Most importantly, Asp 166 has to be negatively charged to facilitate the transfer of the phosphate group, and the titratable groups Lys 72, Glu 91, Lys 168, and Asp 184 are positioned so close to the active site that also these groups will have to occupy a specific protonation state for catalysis to occur. In this work, we assume that the CCPS for PKA is as follows: K72+, E91−, D166−, K168+, D184−, which is supported by the pKa calculations above and by various mechanistic studies. The pH dependence of the population of the CCPS generally determines the pH-activity profile, which in the case of PKA displays a bell-shaped kcat/Km pH-activity profile with limiting pKa values of 6.2 and 8.5. It is likely that the acidic limb of the pH-activity profile of PKA is limited by the titration of the terminal phosphate of ATP, which occurs with a pKa value of 6.6–7.2. Although this value is slightly higher than the pKa value observed for PKA catalysis, the uncertainty of the PKA measurements means that this value is within the experimental uncertainty. It is unknown which residue is responsible for limiting the activity of PKA at high pH. This study points to a possible reason for the loss of activity of PKA at high pH: the titration of Lys 168 as indicated by the pKa value of 8.8 in the ATP3− calculation. Although ATP almost certainly carries four negative charges, the high sensitivity of Lys 168 to the charges and the environment makes it likely that Lys 168 indeed could titrate with a pKa value around 8 given slight geometric alterations.
Although we cannot resolve the question of the origin of the pH-dependent PKA catalytic activity, it is nevertheless of interest to examine how the PKA CCPS is stabilized. In the following, we examine the PKA CCPS stabilization in two ways:
Stabilization by charge–charge interactions
Stabilization by noncharge interactions.
Table I lists the charge–charge titratable groups that, when removed, cause a change in the calculated titration curves of a CCPS group equivalent to at least 1.0 pKa unit. The calculation is performed on the 1ATP apo-generated structure. It is evident that the many strong interactions in the PKA active site play an important role in maintaining the population of the CCPS in the apo state of the enzyme. Furthermore, it is clear that the strong interactions cause the system of titratable groups to behave in a nonlinear fashion as evident by the asymmetry of the ΔpKa values in Table I. This now poses the interesting question of whether this strongly charged system has evolved so as to be resistant to perturbation in the form of point mutations outside the active site. In other words, “is the system of titratable groups able to act as a “charge buffer” and thus insulate the active-site residues against outside perturbations?” Alternatively, there is also the possibility of the extended system of charged groups simply making the active site more sensitive to changes in the electrostatics of the molecule as they occupy a large volume in the protein.
Table I.
Largest Influences on CCPS Residue pKa Values
| Group | Lys 72 | His 87 | Glu 91 | Arg 165 | Asp 166 | Lys 168 | Glu 170 | Asp 184 | Asp 220 |
|---|---|---|---|---|---|---|---|---|---|
| Lys 72 | −6.9 | −1.1 | −3.0 | ||||||
| Glu 91 | 7.6 | 1.1 | −1.1 | ||||||
| Asp 166 | 1.3 | 4.7 | −1.3 | ||||||
| Lys 168 | −4.0 | −1.3 | −1.5 | ||||||
| Asp 184 | 2.0 | −1.5 | −2.6 | 1.4 |
Rows list the titratable groups in the CCPS, whereas columns list the titratable groups that have an effect on a CCPS residue pKa value ≥ 1.0 units. Each cell contains the ΔpKa value that the CCPS residue experiences when the group at the top of the column is removed from the interaction energy matrix. The group with the largest influence on the pKa value of Asp 166 is Lys 168 (value is given in bold). Note that the ΔpKa values are calculated by integrating the differences in titration curves and not by subtracting pKa values.
To examine the role of the active-site electrostatic network for e.g. Asp 166, we calculate the ΔpKa value for Asp 166 when removing all titratable groups in the molecule individually. Each time we remove a titratable group we calculate the ΔpKa that the CCPS groups experience when they are embedded in the PKA system of titratable groups. We also calculate the ΔpKa that the CCPS group would experience as a result of the removal of the titratable group if there were no other titratable groups in PKA than this specific pair of groups. Note that the electrostatic interaction energy between the removed group and the CCPS group in question in both cases is the same, and it therefore only is the indirect effect of all other titratable groups we are measuring. Table II lists the results of this analysis and shows that Lys 72 to a large extent is insulated by the system to outside changes, Asp 166 is exposed to changes, whereas the remaining of the groups display roughly similar instances of being exposed to versus insulated against charge removal.
Table II.
Incidence of a CCPS Titratable Group Displaying Insulated, Exposed, or Normal Behavior to the Removal of a Titratable Group Other Than Those Comprising the CCPS
| Group/γ ratio | Insulated (γ < 0.9) | Exposed (γ > 1.1) | Normal (0.9 ≤ γ ≤ 1.1) |
|---|---|---|---|
| Lys 72 | 18 (16%) | 0 (0%) | 1 (0%) |
| Glu 91 | 13 (11%) | 10 (9%) | 2 (1%) |
| Asp 166 | 2 (1%) | 8 (7%) | 1 (0%) |
| Lys 168 | 7 (6%) | 6 (5%) | 1 (0%) |
| Asp 184 | 7 (6%) | 5 (4%) | 2 (1%) |
The type of behavior is determined by calculating the γ ratio  as defined in Materials and Methods.
Stabilization by noncharge–charge interactions
The charge–charge interactions in PKA play a large role in maintaining the CCPS as above, but in addition to being influenced by charge–charge interactions, pKa values are determined by desolvation effects and the so-called “background interaction energies”—interactions with permanent charges and dipoles in the protein. To examine the role that noncharge–charge interactions play in stabilizing the CCPS of PKA, we perform an in silico alanine scan of pKa and measure the effect that each alanine mutation has on the pKa values of the titratable groups defining the CCPS. Table III lists all residues that give rise to a change in CCPS pKa values of more than 0.5 units and convincingly shows that very few nontitratable groups are of major importance for stabilizing the CCPS of PKA. It should be stressed that this analysis does not model structural relaxation in other residues than the mutated one and thus only reports the sensitivity of the CCPS to the removal of side chains when it is assumed that the rest of the protein structure remains unchanged. This assumption is reasonable as evidenced by many X-ray structures of mutant proteins, but occasionally conformational/structural changes do occur, and in these cases the analysis will yield inaccurate results.
Table III.
Residues That, When Mutated to Alanine, Give Rise to a ΔpKa of More Than 0.5 Units to One or More CCPS Groups
| CCPS group | Mutations giving a ΔpKa > 0.5 |
|---|---|
| Lys 72 | — |
| Glu 91 | M118A, H87A, D184A, F350A, K72A |
| Asp 166 | K168A |
| Lys 168 | — |
| Asp 184 | R165A, H87A, E91A, D166A, K168A, K72A |
Nontitratable residues are underlined.
Discussion
At the onset of our work, we set out to examine a number of questions regarding the pKa values of PKA as detailed in the introduction. We established that the catalytic Asp 166 has a significantly depressed pKa value in all forms of the enzyme, and that this residue thus is ideally suited to facilitate the phosphate transfer reaction. We furthermore established that there is no significant change in pKa values when PKA changes confirmation, and that the protein motion in itself therefore occurs without any need for proton uptake and release.
The binding of ligands furthermore occurs with protonation state changes detected only for Lys 168 and His 87. The protonation state of Lys 168 was seen to change only when both MgATP and PKI/the peptide substrate were bound, and we furthermore established that the pKa value of Lys 168 was sensitive to the charge on the ATP molecule, with the change in charge being observed only for ATP2− and not for ATP3− and ATP4−.
When inspecting the charge pH profiles of ligand binding (Fig. 5), it is remarkable to see that the binding of ligands requires the smallest proton release/uptake around pH 7.0–8.0. Physiological pH is therefore the pH value where the energy difference between the bound and unbound states reaches its minimum. It is unknown whether this observation has any real implications for the biology involving PKA, but one can speculate that fast substrate binding and product release is dependent on minimal proton transfer/binding requirements, and that the pKa values in PKA therefore have been optimized to provide for efficient transfer of molecules in and out of the active site.
The low charge differences upon ligand binding are furthermore evidence for electrostatic preorganization of the active site in terms of pKa values so as to facilitate fast catalytic rates and easy ligand binding. Although other studies5,7,8,34 have emphasized the uptake of protons upon ligand binding and protein–protein association, it is more plausible that a significant fraction of proteins and enzymes have evolved to minimize change in protonation states when binding their natural substrates and interaction partners. Such an argument is in agreement with the studies of electrostatic preorganization as championed by Warshel and Florian,36 especially in the cases where the charge distribution in the enzymatic transition state is similar to the charge distribution of the ground states. We expect changes in protonation states upon ligand binding to be more prevalent when examining non-natural ligands and interaction partners. We furthermore believe that a proper analysis of the issue requires the calculation of proton uptake calculations over a full pH range similar to the ones we present in Figures 3 and 5, because calculating proton uptake/release for just one or two pH values gives no information on which pH value is the most favorable for ligand binding.
We finally examine the hypothesis that the PKA active site had evolved to “protect” the pKa values of its catalytically active groups by engineering a buffer zone of titratable groups around the active site. We found no solid evidence of such a mechanism, with the electrostatic network being deemed equally hypersensitive and insulating depending on which groups were examined. It is possible that a more rigorous examination of this phenomenon including the insertion of charges at various positions, alternative definitions of the insulating network (here, we simply used the residues defining the CCPS) could lead to a different conclusion. We nevertheless succeeded in identifying both hypersensitive aspects and insulating aspects of the electrostatic network in the active site of PKA, thus proving that such characteristics can be produced by networks of titratable groups.
Materials and Methods
Selection and preparation of X-ray structures
The PDB37 holds 18 structures of the catalytic domain (C-PKA) of the murine cAMP-dependent PK in various conformations. A single chain of C-PKA was extracted from each PDB file. All missing protein atoms were rebuilt using WHAT IF.38 Nine structures occupy the closed, active conformation (PDB IDs: 1ATP, 1L3R, 1FMO, 1JBP, 2ERZ, 1RDQ, 1APM, 2CPK, and 2QCS), six are in the intermediate conformation (PDB IDs: 1JLU, 1BKX, 1BX6, 1RE8, 1REJ, and 1REK), and three structures are in the open, inactive conformation (PDB IDs: 1J3H, 1SYK, and 2QVS). Sixteen of the C_PKA structures contain coordinates for residues 15–350 (118 titratable groups), but 1J3H and 2QVS contain coordinates only for residues 15–318 and therefore contain only 102 titratable groups. Only charges of the 102 titratable groups common to all structures were used when calculating the effect of the conformational change on the net charge of the protein.
Apo-generated structures were constructed by removing all atoms part of the ligand and phosphate groups.
All calculations measuring the effect of including ligands were performed on structures derived from 1ATP. The different liganded states were generated simply by deleting one more phosphate groups and ligands.
pKa calculations
The WHAT IF pKa calculation package (WIpKa) was used to calculate the pKa values as described previously,9 except that a uniform protein dielectric constant of 8 was used. A dielectric constant of 80 was used for the solvent, and the ionic strength was set to 0.144M. The WHAT IF pKa calculation routines use DelPhi II26 to solve the PBE and use a hydrogen-bond optimization algorithm39 to achieve realistic modeling of the protonation states.
Net charges of conformational states were calculated by adding the raw titration curves predicted by WIpKa. The charges on ATP were calculated using the PRODRG server40 (see Supporting Information Fig. S2), and radii were assigned according to the following list: H: 1.0 Å, C: 1.875 Å, O: 1.480 Å, N: 1.625 Å, and P: 1.875 Å. In all calculations, phosphate groups were modeled using a −2 state, because the pKa values of phosphoserine (SEP) and phosphothreonine (TPO) are assumed to be around 5–6 in proteins.41,42
Calculations where SEP, TPO, and ATP were performed with the following parameters: model pKa value: SEP: 7.0, TPO: 7.0, and ATP: 6.8. Only the transitions from −1 to −2 (SEP and TPO) and −3 to −4 (ATP) were allowed to titrate.
ΔpKa calculations
The full calculation of all pKa values for an enzyme using a PBE-based method as outlined above is time consuming, and it is therefore impractical to recalculate all PKA pKa values to determine the effect of removing a single residue. We therefore use a set of fast ΔpKa value calculation routines43 that uses an intelligent procedure to estimate which parts of a full pKa calculation have to be repeated when removing a side chain or a titratable group. We model the removal of a titratable group simply by zeroing all pair-wise electrostatic interaction energies involving this group in the site–site matrix and then proceed by recalculating all titration curves from the intrinsic pKa values and the modified site–site interaction energy matrix. When studying the effect of removing an entire side chain, we remove the pair-wise interactions as describe above, and additionally we recalculate the intrinsic pKa value of all titratable groups that are within 20 Å of an atom in the removed group. Collectively, these assumptions give a considerable speed-up in the calculation of ΔpKa values with a negligible effect on the accuracy of the final pKa values.43,44
Calculation of  and
and 
The change in pKa value of a titratable group (A) upon removal of another titratable group (B) that both are embedded of a system of titratable groups (S) is calculated in two ways:
-

The pKa value of A is calculated in the presence of B and S pKa[A,B + S] and recalculated only in the presence of S pKa[A,S].
is defined as pKa[A,S] − pKa[A,B + S]. -

The pKa value of A is calculated in the presence of B but in the absence of S (pKa[A,B]). The pKa value of A is recalculated in isolation (i.e., neither S nor B is present: pKa[A]).
The ratio  shows if the removal of B affects the pKa value of A more in the presence of the system of titratable groups (S)—in this case γ > 1.0, if the effect is the same γ = 1, or if the effect is stronger in the absence of S (γ < 1.0).
Group A can be said to be insulated by S if γ < 1.0 and hyperexposed if γ > 1.0.
References
- 1.Manning G, Whyte DB, Martinez R, Hunter T, Sudarsanam S. The protein kinase complement of the human genome. Science. 2002;298:1912–1934. doi: 10.1126/science.1075762. [DOI] [PubMed] [Google Scholar]
- 2.Cohen P. Protein kinases—the major drug targets of the twenty-first century? Nat Rev Drug Discov. 2002;1:309–315. doi: 10.1038/nrd773. [DOI] [PubMed] [Google Scholar]
- 3.Cheng Y, Zhang Y, McCammon JA. How does the cAMP-dependent protein kinase catalyze the phosphorylation reaction: an ab initio QM/MM study. J Am Chem Soc. 2005;127:1553–1562. doi: 10.1021/ja0464084. [DOI] [PubMed] [Google Scholar]
- 4.Kolch W, Pitt A. Functional proteomics to dissect tyrosince kinase signalling pathways in cancer. Nat Rev Cancer. 2010;10:618–629. doi: 10.1038/nrc2900. [DOI] [PubMed] [Google Scholar]
- 5.Mason AC, Jensen JH. Protein-protein binding is often associated with changes in protonation state. Proteins. 2008;71:81–91. doi: 10.1002/prot.21657. [DOI] [PubMed] [Google Scholar]
- 6.Kundrotas PJ, Alexov E. Electrostatic properties of protein-protein complexes. Biophys J. 2006;91:1724–1736. doi: 10.1529/biophysj.106.086025. [DOI] [PMC free article] [PubMed] [Google Scholar]
- 7.Czodrowski P, Sotriffer CA, Klebe G. Protonation changes upon ligand binding to trypsin and thrombstructural interpretation based on pK(a) calculations and ITC experiments. J Mol Biol. 2007;367:1347–1356. doi: 10.1016/j.jmb.2007.01.022. [DOI] [PubMed] [Google Scholar]
- 8.Bas DC, Rogers DM, Jensen JH. Very fast prediction and rationalization of pKa values for protein-ligand complexes. Proteins. 2008;73:765–783. doi: 10.1002/prot.22102. [DOI] [PubMed] [Google Scholar]
- 9.Nielsen JE, Vriend G. Optimizing the hydrogen-bond network in Poisson-Boltzmann equation-based pK(a) calculations. Proteins. 2001;43:403–412. doi: 10.1002/prot.1053. [DOI] [PubMed] [Google Scholar]
- 10.Tsigelny I, Grant BD, Taylor SS, Ten Eyck LF. Catalytic subunit of cAMP-dependent protein kinase: electrostatic features and peptide recognition. Biopolymers. 1996;39:353–365. doi: 10.1002/(SICI)1097-0282(199609)39:3%3C353::AID-BIP7%3E3.0.CO;2-N. [DOI] [PubMed] [Google Scholar]
- 11.Knighton DR, Zheng JH, Ten Eyck LF, Ashford VA, Xuong NH, Taylor SS, Sowadski JM. Crystal structure of the catalytic subunit of cyclic adenosine monophosphate-dependent protein kinase. Science. 1991;253:407–414. doi: 10.1126/science.1862342. [DOI] [PubMed] [Google Scholar]
- 12.Taylor SS, Yang J, Wu J, Haste NM, Radzio-Andzelm E, Anand G. PKA: a portrait of protein kinase dynamics. Biochim Biophys Acta. 2004;1697:259–269. doi: 10.1016/j.bbapap.2003.11.029. [DOI] [PubMed] [Google Scholar]
- 13.Johnson DA, Akamine P, Radzio-Andzelm E, Madhusudan M, Taylor SS. Dynamics of cAMP-dependent protein kinase. Chem Rev. 2001;101:2243–2270. doi: 10.1021/cr000226k. [DOI] [PubMed] [Google Scholar]
- 14.Akamine P, Madhusudan Wu J, Xuong NH, Ten Eyck LF, Taylor SS. Dynamic features of cAMP-dependent protein kinase revealed by apoenzyme crystal structure. J Mol Biol. 2003;327:159–171. doi: 10.1016/s0022-2836(02)01446-8. ** [DOI] [PubMed] [Google Scholar]
- 15.Wu J, Yang J, Kannan N, Madhusudan, Xuong NH, Ten Eyck LF, Taylor SS. Crystal structure of the E230Q mutant of cAMP-dependent protein kinase reveals an unexpected apoenzyme conformation and an extended N-terminal A helix. Protein Sci. 2005;14:2871–2879. doi: 10.1110/ps.051715205. ** [DOI] [PMC free article] [PubMed] [Google Scholar]
- 16.Bossemeyer D, Engh RA, Kinzel V, Ponstingl H, Huber R. Phosphotransferase and substrate binding mechanism of the cAMP-dependent protein kinase catalytic subunit from porcine heart as deduced from the 2.0 A structure of the complex with Mn2+ adenylyl imidodiphosphate and inhibitor peptide PKI(5-24) EMBO J. 1993;12:849–859. doi: 10.1002/j.1460-2075.1993.tb05725.x. [DOI] [PMC free article] [PubMed] [Google Scholar]
- 17.Nielsen JE. Analyzing enzymatic pH activity profiles and protein titration curves using structure-based pKa calculations and titration curve fitting. Methods Enzymol. 2009;454:233–258. doi: 10.1016/S0076-6879(08)03809-3. [DOI] [PubMed] [Google Scholar]
- 18.Shabb JB. Physiological substrates of cAMP-dependent protein kinase. Chem Rev. 2001;101:2381–2411. doi: 10.1021/cr000236l. [DOI] [PubMed] [Google Scholar]
- 19.McIntosh LP, Hand G, Johnson PE, Joshi MD, Korner M, Plesniak LA, Ziser L, Wakarchuk WW, Withers SG. The pKa of the general acid/base carboxyl group of a glycosidase cycles during catalysis: a 13C-NMR study of Bacillus circulans xylanase. Biochemistry. 1996;35:9958–9966. doi: 10.1021/bi9613234. [DOI] [PubMed] [Google Scholar]
- 20.Joshi MD, Hedberg A, McIntosh LP. Complete measurement of the pKa values of the carboxyl and imidazole groups in Bacillus circulans xylanase. Protein Sci. 1997;6:2667–2670. doi: 10.1002/pro.5560061224. [DOI] [PMC free article] [PubMed] [Google Scholar]
- 21.Bartik K, Redfield C, Dobson CM. Measurement of the individual pKa values of acidic residues of hen and turkey lysozymes by two-dimensional 1H NMR. Biophys J. 1994;66:1180–1184. doi: 10.1016/S0006-3495(94)80900-2. [DOI] [PMC free article] [PubMed] [Google Scholar]
- 22.Toseland CP, McSparron H, Davies MN, Flower DR. PPD v1.0—an integrated, web-accessible database of experimentally determined protein pKa values. Nucleic Acids Res. 2006;34:D199–D203. doi: 10.1093/nar/gkj035. [DOI] [PMC free article] [PubMed] [Google Scholar]
- 23.Farrell D, Miranda ES, Webb H, Georgi N, Crowley PB, McIntosh LP, Nielsen JE. Titration_DB: storage and analysis of NMR-monitored protein pH titration curves. Proteins. 2010;78:843–857. doi: 10.1002/prot.22611. [DOI] [PubMed] [Google Scholar]
- 24.Davies MN, Toseland CP, Moss DS, Flower DR. Benchmarking pK(a) prediction. BMC Biochem. 2006;7:18. doi: 10.1186/1471-2091-7-18. [DOI] [PMC free article] [PubMed] [Google Scholar]
- 25.Yang AS, Gunner MR, Sampogna R, Sharp K, Honig B. On the calculation of pKas in proteins. Proteins. 1993;15:252–265. doi: 10.1002/prot.340150304. [DOI] [PubMed] [Google Scholar]
- 26.Nicholls A, Honig B. A rapid finite difference algorithm, utilizing successive over-relaxation to solve the Poisson-Boltzmann equation. J Comput Chem. 1991;12:435–445. [Google Scholar]
- 27.Baker NA, Sept D, Joseph S, Holst MJ, McCammon JA. Electrostatics of nanosystems: application to microtubules and the ribosome. Proc Natl Acad Sci USA. 2001;98:10037–10041. doi: 10.1073/pnas.181342398. [DOI] [PMC free article] [PubMed] [Google Scholar]
- 28.Warwicker J, Watson HC. Calculation of the electric potential in the active site cleft due to alpha-helix dipoles. J Mol Biol. 1982;157:671–679. doi: 10.1016/0022-2836(82)90505-8. [DOI] [PubMed] [Google Scholar]
- 29.Li H, Robertson AD, Jensen JH. Very fast empirical prediction and rationalization of protein pK(a) values. Proteins. 2005;61:704–721. doi: 10.1002/prot.20660. [DOI] [PubMed] [Google Scholar]
- 30.Baptista AM, Martel PJ, Petersen SB. Simulation of protein conformational freedom as a function of pH: constant-pH molecular dynamics using implicit titration. Proteins. 1997;27:523–544. [PubMed] [Google Scholar]
- 31.Mongan J, Case DA, McCammon JA. Constant pH molecular dynamics in generalized Born implicit solvent. J Comput Chem. 2004;25:2038–2048. doi: 10.1002/jcc.20139. [DOI] [PubMed] [Google Scholar]
- 32.Khandogin J, Brooks CL., III Toward the accurate first-principles prediction of ionization equilibria in proteins. Biochemistry. 2006;45:9363–9373. doi: 10.1021/bi060706r. [DOI] [PubMed] [Google Scholar]
- 33.Nielsen JE, McCammon JA. On the evaluation and optimisation of protein X-ray structures for pKa calculations. Protein Sci. 2003;12:313–326. doi: 10.1110/ps.0229903. [DOI] [PMC free article] [PubMed] [Google Scholar]
- 34.Aguilar B, Anandakrishnan R, Ruscio JZ, Onufriev AV. Statistics and physical origins of pK and ionization state changes upon protein-ligand binding. Biophys J. 98:872–880. doi: 10.1016/j.bpj.2009.11.016. **(YEAR) [DOI] [PMC free article] [PubMed] [Google Scholar]
- 35.Krieger E, Koraimann G, Vriend G. Increasing the precision of comparative models with YASARA NOVA—a self-parameterizing force field. Proteins. 2002;47:393–402. doi: 10.1002/prot.10104. [DOI] [PubMed] [Google Scholar]
- 36.Warshel A, Florian J. Computer simulations of enzyme catalysis: finding out what has been optimized by evolution. Proc Natl Acad Sci USA. 1998;95:5950–5955. doi: 10.1073/pnas.95.11.5950. [DOI] [PMC free article] [PubMed] [Google Scholar]
- 37.Berman HM, Westbrook J, Feng Z, Gilliland G, Bhat TN, Weissig H, Shindyalov IN, Bourne PE. The Protein Data Bank. Nucleic Acids Res. 2000;28:235–242. doi: 10.1093/nar/28.1.235. [DOI] [PMC free article] [PubMed] [Google Scholar]
- 38.Vriend G. WHAT IF: a molecular modeling and drug design program. J Mol Graph. 1990;8:29, 52–56. doi: 10.1016/0263-7855(90)80070-v. [DOI] [PubMed] [Google Scholar]
- 39.Hooft RW, Sander C, Vriend G. Positioning hydrogen atoms by optimizing hydrogen-bond networks in protein structures. Proteins. 1996;26:363–376. doi: 10.1002/(SICI)1097-0134(199612)26:4<363::AID-PROT1>3.0.CO;2-D. [DOI] [PubMed] [Google Scholar]
- 40.Schuttelkopf AW, van Aalten DM. PRODRG: a tool for high-throughput crystallography of protein-ligand complexes. Acta Cryst D. 2004;60:1355–1363. doi: 10.1107/S0907444904011679. [DOI] [PubMed] [Google Scholar]
- 41.Kitchen J, Saunders RE, Warwicker J. Charge environments around phosphorylation sites in proteins. BMC Struct Biol. 2008;8:19. doi: 10.1186/1472-6807-8-19. [DOI] [PMC free article] [PubMed] [Google Scholar]
- 42.Andrew CD, Warwicker J, Jones GR, Doig AJ. Effect of phosphorylation on alpha-helix stability as a function of position. Biochemistry. 2002;41:1897–1905. doi: 10.1021/bi0113216. [DOI] [PubMed] [Google Scholar]
- 43.Tynan-Connolly BM, Nielsen JE. Re-designing protein pKa values. Protein Sci. 2007;16:239–249. doi: 10.1110/ps.062538707. [DOI] [PMC free article] [PubMed] [Google Scholar]
- 44.Tynan-Connolly B, Nielsen JE. pKD: re-designing protein pKa values. Nucleic Acids Res. 2006;34:W48–W51. doi: 10.1093/nar/gkl192. [DOI] [PMC free article] [PubMed] [Google Scholar]