

With more efficient penetration in biological tissues, near-infrared (NIR) excitation and/or emission between 1000 nm and 1350 nm opens a second window for in vivo imaging with low tissue autofluorescence.[1] Along with the development of red fluorescence proteins,[2] nanoparticles (NPs) have also been reported as imaging agents for multi-photon excitation microscopy. Examples include second harmonic generation (SHG) from ZnO nanowires[3, 4] and nanorods;[5] third harmonic generation (THG) and four wave mixing from Ag NPs[6], Au NPs,[7] Au nanorods,[8, 9] and NP antennas;[10] as well as multi-photon luminescence from Au nanorods,[11, 12] Au NPs,[13, 14] Au nanoshells,[15] and Au nanowires.[16, 17] These intrinsic signals have enabled nanoscale imaging,[18] surface plasmon-mediated photolithography,[19] monitoring the cellular uptake of NPs[20, 21] and nanorods,[22] imaging tumor cells in a matrix,[23] mapping the 3D distribution of nanoshells in tumors,[15] and probing circulating nanorods in living animals.[24] In this paper we report bright three-photon luminescence (3PL) from Au-Ag alloyed nanocages prepared by the galvanic replacement reaction.[25] With a large one-photon plasmon absorption cross section, the nanocages have been demonstrated as a contrast enhancement agent in optical coherence tomography[26] and photoacoustic tomography,[27] and as a photothermal therapeutic agent in cancer treatment.[28] The plasmon field of nanocages has also been used for surface-enhanced Raman scattering.[29]
The current work explores the nonlinear optical (NLO) properties of Au-Ag nanocages using a multimodal multi-photon microscope.[30] By excitation with a femtosecond (fs)laser at 1290 nm, we observed a THG peak at 430 nm, together with a broad 3PL that is one order of magnitude stronger than that from pure Au or Ag NPs. 3PL with a similar profile and intensity was also observed in solid NPs made of a Au-Ag alloy. With the laser excitation far away from the plasmon resonance peaks of the alloyed nanostructures, the 3PL allows for live cell imaging with undetectable photothermal toxicity.
The Au-Ag nanocages were synthesized using the galvanic replacement reaction as reported previously.[25] Two compositions were prepared by controlling the amount of HAuCl4 added to the suspension of Ag nanocubes: Ag (49%)-Au (51%) and Ag (85%)-Au (15%), where the atomic percentages were determined by Energy Dispersive X-ray (EDX). The extinction spectra (Fig. 1, a and b) revealed that the surface plasmon resonance peaks of the two samples were located at 760 nm and 640 nm, respectively. Scanning electron microscopy (SEM) images showed that the two samples had similar dimensions (ca. 43 nm in edge length), with more pores on the surface of the first sample (see the insets for SEM images).
Figure 1.
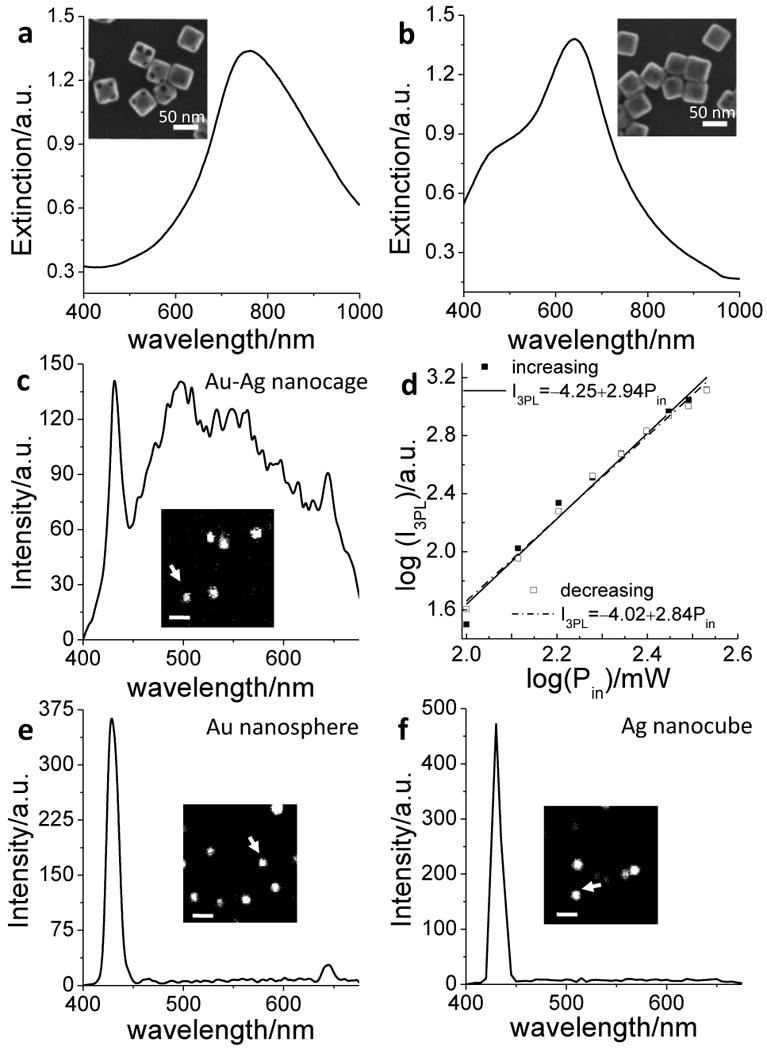
THG and 3PL from Au-Ag nanocages, Au nanospheres, and Ag nanocubes. (a, b) Extinction spectra of Au-Ag nanocages with (a) 49% Ag-51% Au and (b) 85% Ag-15% Au. Inset: SEM images of the nanocages. Scale bar = 50 nm. (c) Emission spectrum from a Au-Ag nanocage (49%Ag-51%Au) indicated by an arrow in the inset luminescence image, excited by a 1290-nm laser. (d) Dependence of the luminescence intensity on the excitation power. The data was obtained by decreasing the excitation power from 8.3 mW to 2.4 mW, then increasing the power accordingly. The slopes for decreasing and increasing power were 2.84 and 2.94, respectively. (e) Emission spectrum from a Au nanosphere (60 nm in size) indicated by an arrow in the inset THG image. (f) Emission spectrum from a Ag nanocube (40 nm in size) indicated by an arrow in the inset THG image. Scale bar = 2 μm.
By fs laser excitation at 1290 nm and λ-scan imaging,[30] we recorded the NLO signals from Au-Ag nanocages spin-coated on a coverslip. We observed a THG peak at 430 nm, a SHG peak at 645 nm, and a broad luminescence in the visible region (Fig. 1c). The NLO nature of the luminescence was confirmed by examination of the dependence of luminescence intensity on the excitation power. The luminescence signals were recorded as the incident beam power decreased from 8.3 mW to 2.4 mW at the sample and then increased accordingly. As shown in Figure 1d, a cubic dependence of the signal intensity on the excitation power was shown, with slope values of 2.84 and 2.94, respectively, for decreasing and increasing powers, indicative of a three-photon excitation process. No obvious intensity drop was observed when the excitation power returned to the same level, which demonstrates little photo-bleaching or photothermal degradation of the nanocages. Under the same condition, pure Au nanospheres (Fig. 1e), Ag nanocubes (Fig. 1f), Ag nanospheres and Au nanorods (Fig. S1) showed an intense THG peak at 430 nm and a very weak luminescence.
We quantitatively compared the THG and 3PL signals from Au-Ag nanocages, pure Au nanospheres, and pure Ag nanocubes. Under the same condition, the THG intensity from Ag nanocubes was found to be the highest, followed by Au nanospheres and Au-Ag nanocages (Fig. 2, a to d). Significantly, the 3PL intensity from Au-Ag nanocages was about one order of magnitude higher than that from Au nanospheres or Ag nanocubes (Fig. 2, e to h). We further compared the two nanocage samples with different compositions. It was found that the nanocages with higher Ag% (Fig. 2d) exhibited a stronger THG signal than the ones with lower Ag% (Fig. 2c), while the 3PL intensities were at the same level (Fig. 2, g and h).
Figure 2.

Quantitative comparison of THG and 3PL intensities from the Au-Ag nanocages (NCs), Au nanospheres, and Ag nanocubes, excited by a fs laser at 1290 nm. THG and 3PL images were acquired by an external detector with bandpass filters of 430/40 nm and 520/70 nm, respectively. (a-d) THG images of (a) 60-nm Au nanospheres, (b) 40-nm Ag nanocubes, (c) Au-Ag NCs with 49% Ag and 51% Au, and (d) Au-Ag NCs with 85% Ag and 15% Au. (e-h) 3PL images of (e) Au nanospheres, (f) Ag nanocubes, (g) Au-Ag NCs with 49% Ag and 51% Au, and (h) Au-Ag NCs with 85% Ag and 15% Au in the same area as in (a-d). Scale bar = 5 μm. Intensity distributions for NPs were plotted under each image. For all images, the laser power was 4.5 mW after objective.
Because local E-field enhancement has been shown to arise from the pinholes on the surface of NPs,[31] we questioned whether the hollow and porous structure of nanocages contributed to the enhanced 3PL. To test such a possibility, we imaged solid NPs made of Au-Ag alloys by THG (Fig. 3a) and 3PL (Fig. 3b). Broad 3PL with a similar intensity profile to the nanocages was observed (Fig. 3c). Both THG and 3PL signal intensities from the Au-Ag NPs (Fig. 3, d and e) were slightly higher than those from the Au-Ag nanocages with a similar composition (Fig. 2, c and g), which might be due to the larger volume of metal in the solid Au-Ag NPs than in the thin-walled nanocages. These results suggest that it is the Au-Ag alloy composition rather than the hollow and/or porous structure that contributed to the enhanced 3PL. In the alloyed nanostructures Au and Ag atoms have been shown uniformly distributed.[32] A pair of Au and Ag atoms could be considered as a dipole, and oscillation of the coupling dipoles may create a great field when exposed to laser irradiation. Therefore, in a microscopic view, the enhanced 3PL from Au-Ag nanocages and solid NPs could be ascribed to the interplay between Au and Ag at the atomic level.
Figure 3.

NLO properties of solid NPs made of a Au-Ag alloy with 50% Ag and 50% Au. (a) THG and (b) 3PL images of solid Au-Ag NPs spin-coated on a cover slip. Scale bar = 5 μm. (c) Emission spectrum from a solid Au-Ag NP excited by a fs laser at 1290 nm. (d) THG intensity distribution for the solid Au-Ag NPs. (e) 3PL intensity distribution for the solid Au-Ag NPs.
Macroscopically the luminescence excited by the 1290-nm laser could arise from a three-photon absorption process, followed by radiative transitions between excited electrons and holes. However, because the 1290-nm excitation is completely off the plasmon resonance, the three-photon absorption cross section should be negligible compared to the parametric THG process, especially because Z-scan measurements have shown a larger third-order susceptibility from Au-Ag alloy nanoshells than pure Ag NPs.[33] With these considerations, we suggest an alternative mechanism for the enhancement of 3PL, by which the generated THG photons might be re-absorbed by the same particle to produce the luminescence. This mechanism is supported by our observation of a weaker THG from Au-Ag alloyed nanostructures along with the enhanced 3PL. As additional supporting evidence, we were able to generate luminescence from the Au-Ag alloyed nanostructures using light at 430 nm (Fig. S2). Although both Au-Ag alloyed nanocages and solid NPs were found to display similar 3PL profiles, technically, it is much easier to prepare Au-Ag alloyed nanocages with a wide range of tunable compositions and plasmon resonance peaks.[34] Therefore, we focused on the Au-Ag alloyed nanocages for the in vitro and ex vivo studies described in the following sections.
Similar to Au nanorods and nanoshells, Au-Ag nanocages also emit a two-photon luminescence (2PL).[35] The 2PL signal excited with 0.6 mW fs laser at 760 nm showed the same intensity level as the 3PL signal excited with 4.3 mW fs laser at 1290 nm (Fig. S3). Although the 2PL process is more efficient owing to the plasmon resonance enhancement, 3PL is advantageous over 2PL for cellular imaging in the phototoxicity aspect. In a plasmon resonant TPL process with nanorods or nanocages, a significant portion of the incident photons were absorbed by the plasma and converted into heat,[36, 37] causing thermal degradation of the NPs[38, 39] and damage to the surrounding tissues.[28, 40-44] The thermal instability and photothermal toxicity make 2PL less attractive for bio-imaging. When the NIR excitation is off the plasmon resonance as in the case of 3PL, the absorbed photons are more effectively used for generation of luminescence, either via three-photon absorption or via the parametric THG process. Consequently, much less thermal energy is produced in the 3PL process. We have experimentally compared the efficiency and photothermal toxicity of 2PL and 3PL for imaging Au-Ag nanocages in living cells. We incubated KB cells in a medium supplemented with Au-Ag nanocages for 12 h to allow cellular internalization. Two cells with similar density of nanocages were selected and illuminated by a 760-nm laser at 1.9 mW for 2PL imaging and a 1290-nm laser at 4.0 mW for 3PL imaging. As shown in Figure 4, a and b, nanocages in cells could be visualized by both 2PL and 3PL (red) with the same level of intensity. To check the photothermal toxicity, we irradiated the KB cells by repetitive raster scanning of the same area. After 90-s scanning with the 760-nm laser, we observed membrane blebbing and compromised integrity of plasma membrane as indicated by ethidium bromide staining, together with a reduced 2PL intensity from nanocages (Fig. 4c). In the contrary, neither damage to the plasma membrane nor reduction of 3PL intensity was observed during 90-s 3PL imaging (Fig. 4d) even though a higher laser power was used in this study.
Figure 4.

Comparison of 2PL and 3PL imaging of Au-Ag nanocages in (a-d) KB cells and (e, f) liver tissues. (a) 2PL image and (b) 3PL image of Au-Ag nanocages (red) in KB cells before laser scanning. (c) Image of the same cell in (a) after scanning with 760-nm fs laser for 90 s. The laser power after objective was 1.9 mW. After scanning, membrane blebbing (arrowed) and compromised membrane integrity indicated by ethidium bromide labeling (green) were observed. (d) 3PL image of the same cell in (b) after scanning with 1290-nm fs laser for 90 s. The laser power after objective was 4.0 mW. No morphological change or plasma membrane damage was observed. (e) 3PL imaging of Au-Ag nanocages (indicated by white circles) in liver tissue. (f) 2PL imaging of Au-Ag nanocages (indicated by white circles) in liver tissue at the same area as (e). White arrow: Anomalously strong autofluorescence from tissue. For both 2PL and 3PL imaging of nanocages in liver, the laser power was 7 mW after objective. Composition of the Au-Ag nanocages: 49% Ag and 51% Au. Scale bar = 10 μm.
The 3PL further enabled us to map the distribution of intravenously injected Au-Ag nanocages in the liver of a mouse. The nanocages appeared as bright dots in the 3PL image of a sliced liver tissue (Fig. 4e). Without autofluorescence background, the 3PL signal can be potentially used to determine the amount of nanocages deposited in the liver and other organs. In contrary, by fs laser excitation at 760 nm, both nanocages and hepatocytes were simultaneously visualized by 2PL and two-photon excited autofluorescence, respectively (Fig. 4f). The autofluorescence spot, indicated by the arrow in Figure 4f, made it difficult to selectively identify the nanocages.
In summary, we have shown that Au-Ag nanocages emit bright 3PL in the visible region when excited by a fs laser at 1290 nm. The 3PL was one order of magnitude stronger than that from pure Au or Ag NPs. The enhancement was found not due to the hollow and porous structure but possibly due to the Au-Ag alloy composition. 3PL imaging showed little tissue autofluorescence background and exhibited undetectable photothermal toxicity because the NIR excitation laser was way off the plasmon resonance peak of nanocages. The strong and intrinsic 3PL makes Au-Ag alloyed nanostructures a class of exciting NLO imaging agents for the study of trafficking of NPs in cells and bio-distribution of nanocarriers in small animals.
Experimental Section
Details about preparation of metal nanostructures, optical setup, cell culture, cell imaging, and tissue imaging can be found in Supporting Information.
Supplementary Material
Footnotes
This work was supported in part by an NSF grant (CBET-0828832) to JXC, an AHA predoctoral fellowship to L.T., and a 2006 NIH Director's Pioneer Award (DP1 OD000798) to YX.
Supporting information for this article is available on the WWW under http://www.angewandte.org or from the author.
Contributor Information
Ling Tong, Department of Chemistry, Purdue University, West Lafayette, IN 47907 (USA), Fax: (+1) 765 496 1902.
Claire M. Cobley, Department of Biomedical Engineering, Washington University, Saint Louis, MO 63130 (USA), Fax: (+1) 314 935 7448
Dr. Jingyi Chen, Department of Biomedical Engineering, Washington University, Saint Louis, MO 63130 (USA), Fax: (+1) 314 935 7448
Prof. Younan Xia, Email: xia@biomed.wustl.edu, Department of Biomedical Engineering, Washington University, Saint Louis, MO 63130 (USA), Fax: (+1) 314 935 7448.
Prof. Ji-Xin Cheng, Email: jcheng@purdue.edu, Department of Chemistry, Purdue University, West Lafayette, IN 47907 (USA), Fax: (+1) 765 496 1902; Weldon School of Biomedical Engineering, Purdue University, West Lafayette, IN 47907 (USA).
References
- 1.Smith AM, Mancini MC, Nie S. Nat Nano. 2009;4:710. doi: 10.1038/nnano.2009.326. [DOI] [PMC free article] [PubMed] [Google Scholar]
- 2.Drobizhev M, Tillo S, Makarov NS, Hughes TE, Rebane A. J Phys Chem B. 2009;113:855. doi: 10.1021/jp8087379. [DOI] [PMC free article] [PubMed] [Google Scholar]
- 3.Johnson JC, Yan H, Schaller RD, Petersen PB, Yang P, Saykally RJ. Nano Lett. 2002;2:279. [Google Scholar]
- 4.Pedersen K, Fisker C, Pedersen TG. Physica Status Solidi (c) 2008;5:2671. [Google Scholar]
- 5.Kumar Das S, Bock M, O'Neill C, Grunwald R, Lee KM, Lee HW, Lee S, Rotermund F. Appl Phys Lett. 2008;93:181112. [Google Scholar]
- 6.Tai SP, Wu Y, Shieh DB, Chen LJ, Lin KJ, Yu CH, Chu SW, Chang CH, Shi XY, Wen YC, Lin KH, Liu TM, Sun CK. Adv Mater. 2007;19:4520. [Google Scholar]
- 7.Lippitz M, van Dijk MA, Orrit M. Nano Lett. 2005;5:799. doi: 10.1021/nl0502571. [DOI] [PubMed] [Google Scholar]
- 8.Jung Y, Chen H, Tong L, Cheng JX. J Phys Chem C. 2009;113:2657. [Google Scholar]
- 9.Schwartz O, Oron D. Nano Lett. 2009;9:4093. doi: 10.1021/nl902305w. [DOI] [PubMed] [Google Scholar]
- 10.Palomba S, Danckwerts M, Novotny L. J Optic Pure Appl Optic. 2009;11:114030. [Google Scholar]
- 11.Wang H, Huff TB, Zweifel DA, He W, Low PS, Wei A, Cheng JX. Proc Natl Acad Sci USA. 2005;102:15752. doi: 10.1073/pnas.0504892102. [DOI] [PMC free article] [PubMed] [Google Scholar]
- 12.Imura K, Nagahara T, Okamoto H. J Phys Chem B. 2005;109:13214. doi: 10.1021/jp051631o. [DOI] [PubMed] [Google Scholar]
- 13.Farrer RA, Butterfield FL, Chen VW, Fourkas JT. Nano Lett. 2005;5:1139. doi: 10.1021/nl050687r. [DOI] [PubMed] [Google Scholar]
- 14.Eichelbaum M, Schmidt BE, Ibrahim H, Rademann K. Nanotechnology. 2007;18:355702. [Google Scholar]
- 15.Park J, Estrada A, Sharp K, Sang K, Schwartz JA, Smith DK, Coleman C, Payne JD, Korgel BA, Dunn AK, Tunnell JW. Opt Express. 2008;16:1590. doi: 10.1364/oe.16.001590. [DOI] [PubMed] [Google Scholar]
- 16.Kim H, Xiang C, Güell AG, Penner RM, Potma EO. J Phys Chem C. 2008;112:12721. [Google Scholar]
- 17.Wang QQ, Han JB, Guo DL, Xiao S, Han YB, Gong HM, Zou XW. Nano Lett. 2007;7:723. doi: 10.1021/nl062964f. [DOI] [PubMed] [Google Scholar]
- 18.Nakayama Y, Pauzauskie PJ, Radenovic A, Onorato RM, Saykally RJ, Liphardt J, Yang P. Nature. 2007;447:1098. doi: 10.1038/nature05921. [DOI] [PubMed] [Google Scholar]
- 19.Zijlstra P, Chon JWM, Gu M. Nature. 2009;459:410. doi: 10.1038/nature08053. [DOI] [PubMed] [Google Scholar]
- 20.Nagesha D, Laevsky GS, Lampton P, Banyal R, Warner C, DiMarzio C, Sridhar S. Int J Nanomedicine. 2007;2:813. [PMC free article] [PubMed] [Google Scholar]
- 21.Qu X, Wang J, Yao C, Zhang Z. Chin Opt Lett. 2008;6:879. [Google Scholar]
- 22.Huff TB, Hansen MN, Zhao Y, Cheng JX, Wei A. Langmuir. 2007;23:1596. doi: 10.1021/la062642r. [DOI] [PMC free article] [PubMed] [Google Scholar]
- 23.Durr NJ, Larson T, Smith DK, Korgel BA, Sokolov K, Ben-yakar A. Nano Lett. 2007;7:941. doi: 10.1021/nl062962v. [DOI] [PMC free article] [PubMed] [Google Scholar]
- 24.Tong L, He W, Zhang Y, Zheng W, Cheng JX. Langmuir. 2009;25:12454. doi: 10.1021/la902992w. [DOI] [PMC free article] [PubMed] [Google Scholar]
- 25.Skrabalak SE, Au L, Li X, Xia Y. Nat Protocols. 2007;2:2182. doi: 10.1038/nprot.2007.326. [DOI] [PubMed] [Google Scholar]
- 26.Chen J, Saeki F, Wiley BJ, Cang H, Cobb MJ, Li ZY, Au L, Zhang H, Kimmey MB, Li, Xia Y. Nano Lett. 2005;5:473. doi: 10.1021/nl047950t. [DOI] [PubMed] [Google Scholar]
- 27.Yang X, Skrabalak SE, Li ZY, Xia Y, Wang LV. Nano Lett. 2007;7:3798. doi: 10.1021/nl072349r. [DOI] [PubMed] [Google Scholar]
- 28.Chen J, Wang D, Xi J, Au L, Siekkinen A, Warsen A, Li ZY, Zhang H, Xia Y, Li X. Nano Lett. 2007;7:1318. doi: 10.1021/nl070345g. [DOI] [PMC free article] [PubMed] [Google Scholar]
- 29.Rycenga M, Hou KK, Cobley CM, Schwartz AG, Camargo PHC, Xia Y. Phys Chem Chem Phys. 2009;11:5903. doi: 10.1039/b903533h. [DOI] [PubMed] [Google Scholar]
- 30.Chen H, Wang H, Slipchenko MN, Jung Y, Shi Y, Zhu J, Buhman KK, Cheng JX. Opt Express. 2009;17:1282. doi: 10.1364/oe.17.001282. [DOI] [PMC free article] [PubMed] [Google Scholar]
- 31.Hao E, Li S, Bailey RC, Zou S, Schatz GC, Hupp JT. J Phys Chem B. 2004;108:1224. [Google Scholar]
- 32.Sun Y, Xia Y. J Am Chem Soc. 2004;126:3892. doi: 10.1021/ja039734c. [DOI] [PubMed] [Google Scholar]
- 33.Li Z, Xue-Feng Y, Xiao-Feng F, Zhong-Hua H, Kai-Yang L. Chin Phys Lett. 2008;25:1776. [Google Scholar]
- 34.Skrabalak SE, Chen J, Sun Y, Lu X, Au L, Cobley CM, Xia Y. Acc Chem Res. 2008;41:1587. doi: 10.1021/ar800018v. [DOI] [PMC free article] [PubMed] [Google Scholar]
- 35.Au L, Zhang Q, Cobley CM, Gidding M, Schwartz AG, Chen J, Xia Y. ACS Nano. 2010;4:35. doi: 10.1021/nn901392m. [DOI] [PMC free article] [PubMed] [Google Scholar]
- 36.Link S, El-Sayed MA. Int Rev Phys Chem. 2000;19:409. [Google Scholar]
- 37.Chou CH, Chen CD, Wang CRC. J Phys Chem B. 2005;109:11135. doi: 10.1021/jp0444520. [DOI] [PubMed] [Google Scholar]
- 38.Link S, Wang ZL, El-Sayed MA. J Phys Chem B. 2000;104:7867. [Google Scholar]
- 39.Petrova H, Juste JP, Pastoriza-Santos I, Hartland GV, Liz-Marzan LM, Mulvaney P. Phys Chem Chem Phys. 2006;8:814. doi: 10.1039/b514644e. [DOI] [PubMed] [Google Scholar]
- 40.Hirsch LR, Stafford RJ, Bankson JA, Sershen SR, Rivera B, Price RE, Hazle JD, Halas NJ, West JL. Proc Natl Acad Sci USA. 2003;100:13549. doi: 10.1073/pnas.2232479100. [DOI] [PMC free article] [PubMed] [Google Scholar]
- 41.Takahashi H, Niidome T, Nariai A, Niidome Y, Yamada S. Chem Lett. 2006;35:500. [Google Scholar]
- 42.Huang X, El-Sayed IH, Qian W, El-Sayed MA. J Am Chem Soc. 2006;128:2115. doi: 10.1021/ja057254a. [DOI] [PubMed] [Google Scholar]
- 43.Tong L, Zhao Y, Huff TB, Hansen MN, Wei A, Cheng JX. Adv Mater. 2007;19:3136. doi: 10.1002/adma.200701974. [DOI] [PMC free article] [PubMed] [Google Scholar]
- 44.Norman RS, Stone JW, Gole A, Murphy CJ, Sabo-Attwood TL. Nano Lett. 2008;8:302. doi: 10.1021/nl0727056. [DOI] [PubMed] [Google Scholar]
Associated Data
This section collects any data citations, data availability statements, or supplementary materials included in this article.