

Abstract
Functional characterization of Arabidopsis thaliana GAT1 in heterologous expression systems, i.e. Saccharomyces cerevisiae and Xenopus laevis oocytes, revealed that AtGAT1 (At1g08230) codes for an H+-driven, high affinity γ-aminobutyric acid (GABA) transporter. In addition to GABA, other ω-aminofatty acids and butylamine are recognized. In contrast to the most closely related proteins of the proline transporter family, proline and glycine betaine are not transported by AtGAT1. AtGAT1 does not share sequence similarity with any of the non-plant GABA transporters described so far, and analyses of substrate selectivity and kinetic properties showed that AtGAT1-mediated transport is similar but distinct from that of mammalian, bacterial, and S. cerevisiae GABA transporters. Consistent with a role in GABA uptake into cells, transient expression of AtGAT1/green fluorescent protein fusion proteins in tobacco protoplasts revealed localization at the plasma membrane. In planta, AtGAT1 expression was highest in flowers and under conditions of elevated GABA concentrations such as wounding or senescence.
γ-Aminobutyric acid (GABA)3 is a four-carbon non-protein amino acid present in prokaryotes and eukaryotes. Although GABA was discovered in 1949 as a constituent of potato tubers, research on GABA metabolism and transport advanced much faster in the animal system as GABA turned out to be the most abundant inhibitory neurotransmitter in the central nervous system (1). Uptake of GABA into neurons and glia has been investigated in detail and shown to be mediated by Na+-dependent and Cl−-facilitated GABA transporters (GATs), thus regulating concentration and duration of the neurotransmitter GABA in the synapse (2, 3). In addition to its function as a neurotransmitter, GABA plays a role in the development of the nervous system, influencing proliferation, migration, and differentiation (4).
With the exception of the general amino acid permease BraRI from Rhizobium leguminosarum, which belongs to the ATP binding cassette (ABC) transporters, GABA uptake in Gram-negative and Gram-positive bacteria as well as in Saccharomyces cerevisiae is mediated by members of the APC (amino acid/polyamine/organocation) superfamily of transporters (5, 6). In both bacteria and yeast, GABA uptake and biosynthesis are mainly involved in nitrogen and carbon metabolism (7-9), although other functions such as GABA synthesis for pH regulation in Escherichia coli and for normal oxidative stress tolerance in S. cerevisiae have also been postulated (10, 11).
Much less is known about the role of GABA and its transport across the plasma membrane in plants. GABA rapidly accumulates under various stress conditions such as low temperature, mechanical stimulation, and oxygen deficiency (12, 13). As in other organisms, GABA is synthesized in plants primarily by decarboxylation of glutamate and degraded via succinic semialdehyde to succinate, a pathway that is also called the GABA shunt (12). Alternatively, succinic semialdehyde can be further catabolized to γ-hydroxybutyrate (14). In plants GABA and the GABA shunt have been discussed as important for regulation of cytosolic pH, nitrogen storage and metabolism, protection against oxidative stress, development, and deterrence of insects (12, 13, 15). GABA might also act as a compatible solute, and more recently its involvement in pollen tube guidance has been demonstrated, suggesting a role in intercellular signaling in plants (13, 16, 17). Such functions require both intra- and intercellular transport of GABA. Indeed, both cellular and vascular transport of GABA have been documented in physiological experiments (18-20).
So far, only transporters mediating low affinity uptake of GABA (Km in the millimolar range) have been identified in plants. These GABA transporters (AtAAP3, ProTs), which belong to the amino acid/auxin transporter (AAAP) or amino acid transporter (ATF) superfamily (21, 22), might not transport GABA in planta, as their affinity for amino acids (AtAAP3) (23, 24) or for the compatible solutes proline and glycine betaine (ProTs) (23, 25), respectively, are considerably higher than for GABA.
In this study we have reported the identification and characterization of the first high affinity GABA transporter from Arabidopsis, designated AtGAT1. Characterization in heterologous expression systems showed that kinetic properties and substrate selectivity of AtGAT1 are similar but distinct from mammalian, bacterial, and S. cerevisiae GABA transporters described so far.
EXPERIMENTAL PROCEDURES
Plant Material, Growth Conditions, and Stress Treatment
Arabidopsis thaliana L. ecotype Col-0 was grown in soil in a growth chamber at 22 °C/18 °C, 65% humidity, and 16 h of light. For induction of wounding response, rosette leaves of 4–5-week-old plants were wounded by scratching them with tweezers. Two 1–1.5-cm-long scratches parallel to the midrib were made, and wounded leaves were harvested 2, 4, and 24 h after wounding. Low and high temperature treatments were performed by keeping plants in the dark at 4 and 37 °C, respectively; anoxic stress was applied by submerging whole Arabidopsis plants in water. Leaves were harvested 2, 4, and 24 h after onset of the treatment. For dark induction of senescence, green leaves were excised and incubated on moistened filter paper for 3 or 6 days in the dark. Alternatively, senescence of attached leaves was assayed by harvesting two batches of yellowing leaves of different stages of senescence from the same plants. ~20% of the leaf area was yellowing in stage I senescent leaves, whereas ~50% of the leaf area was yellowing in stage II leaves.
Chlorophyll Extraction
Plant material was extracted three times with 80% acetone containing 1 μm KOH, and the chlorophyll content of the extract was measured spectrophotometrically (26).
Determination of GABA Concentration
150–200 mg of plant material was extracted with 500 μl of a mixture of methanol:chloroform:water (12:5:3). After centrifugation, the supernatant was recovered and 188 μl of water and 125 μl of chloroform were added. The upper phase of the mixture was dried at room temperature using a speed vacuum apparatus. The pellet was dissolved in 200 μl of water and 300 μl of acetonitrile, and phases were separated by centrifugation. The supernatant was dried, dissolved in 200 μl of water, and purified using a Sep-Pak Vac 1cc C18 cartridge (Waters, Milford, MA). The eluate was dried, and GABA content was measured by high performance liquid chromatography using a modified protocol according to Bidlingmeyer et al. (27).
DNA and RNA Work
The AtGAT1-cDNA was isolated by RT-PCR using primers 5′-ACTTATAAAAGTGAGTAGCACC-3′, 5′-CTCACTTTGCTTTGCATGTTC-3′ and RNA extracted from flowers of A. thaliana L. ecotype Col-0 as template. The AtGAT1-cDNA was cloned in the EcoRV site of pSK and verified by sequencing. For S. cerevisiae complementation assays the AtGAT1-cDNA was transferred into pDR196 using PstI and XhoI (28). The cDNA of At5g41800 was isolated by RT-PCR using primers 5′-TATATAAATCATTCACTTGTAG-3′, 5′-TTTATGTTTTTATCACACTATC-3′ and RNA extracted from flowers of A. thaliana L. ecotype Col-0 as template. The At5g41800-cDNA was cloned in the SmaI site of pDR196 and verified by sequencing.
For translational fusions with GFP, the open reading frame of the AtGAT1 cDNA was amplified by PCR and cloned in pUC18-spGFP6 and pUC18-GFP5Tsp.4 AtGAT1-GFP fusion: 5′-CTAGCTAGCATGGGTGGAGAAGAGAGATC-3′, 5′-GAAGATCTACATCCGCAAACAACTTATAC-3′ (open reading frame cloned into SpeI/BglII site). GFP-AtGAT1 fusion: 5′-CTAGCTAGCATGGGTGGAGAAGAGAGATC-3′, 5′-CCGCTCGAGTTATACATCCGCAAACAAC-3′ (open reading frame cloned into NheI/SalI site). Sequence identity of all PCR-amplified fragments was verified by sequencing.
For electrophysiological studies AtGAT1 was transferred from pDR196 to pBF1 (29) using BamHI and ClaI. AtGAT1-GFP and GFP-AtGAT1 were transferred from pUC18-vectors to pBF1 using XmaI and PstI. cRNA was synthesized using the AMBION SP6 mMessage mMachine kit (Ambion, Austin, TX) following the manufacturer’s instructions.
For quantification of expression, RNA was extracted using a method based on phenol extraction (30) including an additional DNase I treatment. Reverse transcription was performed using the RETROscript kit (Ambion) according to the manufacturer’s instructions with oligo(dT) primers and 2 μg of total RNA as template. Relative quantification using real-time PCR was performed on a LightCycler instrument (Roche Diagnostics). The FastStart DNA Master SYBR Green I kit (Roche Diagnostics) was used according to the manufacturer’s instructions with MgCl2 at a final concentration of 4 mm and 10 pmol of each primer (AtGAT1: 5′-ATACCTGAAATTCAGGCAACAA-3′, 5′-TAGGTTGTAGGTATACCACAG-3′). Actin (AtAct2) was used as a reference gene (5′-ATTCAGATGCCCAGAAGTCTTGTT-3′, 5′-GAAACATTTTCTGTGAACGATTCCT-3′). AtSag12 was used as a marker for senescence (5′-CGAAGGCGGTTTAATGGATA-3′, 5′-CACCTCCTTCAATTCCAACG-3′).
Yeast Growth, Transformation, and Selection
S. cerevisiae strain 22574d (MATα ura3–1, gap1–1, put4–1, uga4–1) (31) was transformed according to Dohmen et al. (32), and transformants were selected on synthetic dextrose minimal medium (33). To test for substrate specificity, transformants were selected on minimal medium supplemented with 20 g/liter of glucose and 1 g/liter of proline, GABA, or citrulline as sole nitrogen source.
Transport Assays
Transport assays using S. cerevisiae were done essentially as described previously (34) using a final concentration of ~2 × 10⁸ cells/ml, 1.85–55.5 kBq 3H-GABA (Amersham Biosciences) and appropriate amounts of the respective unlabeled GABA.
Expression in Xenopus Oocytes
Stage V-VI Xenopus laevis oocytes were injected with 50 ng (50 nl) of AtGAT1 cRNA and were maintained in Barth’s medium (88 mm NaCl, 1 mm KCl, 0.33 mm Ca(NO3)2, 0.41 mm CaCl2, 0.82 mm MgSO4, 2.4 mm NaHCO3, 10 mm HEPES, pH7.4, 50 μg/ml of gentamicin, 100 μg/ml of streptomycin, and 100 units/ml of penicillin) at 18 °C for 1–3 days until used in experiments. All of the experiments were performed at 21 ± 1 °C. Experiments were performed in a NaCl buffer containing (in mm): 100 NaCl, 2 KCl, 1 CaCl2, 1 MgCl2, 10 PIPES, and 10 HOMOPIPES, pH 7.4. Substrates were added to the buffer solutions as indicated, and the necessary pH adjustments were made. All reagents were purchased from Sigma.
Oocytes were voltage clamped by using the Warner Oocyte Clamp (OC-725C; Warner Instrument Corp., Hamden, CT). In the recording experimental chamber, oocytes were initially stabilized in the NaCl buffer, and the composition of the bath was changed as indicated. In all of the experiments, the reference electrodes were connected to the experimental oocyte chamber via agar bridges (3% agar in 3 m KCl). For continuous holding current measurements, the oocyte membrane potential (Vm) was clamped at −50 mV unless otherwise indicated. Currents were low pass filtered at 100 Hz (LPF 8; Warner Instrument Corp.), sampled at 10 Hz (pCLAMP 8.1; Axon Instruments, Union City, CA). Substrate-induced currents were determined by subtracting the base-line current present in NaCl buffer from the evoked current observed after addition of the substrate.
The effects of substrate concentration on the steady-state kinetics were determined by non-linear curve fitting of the induced currents (I) to the Michaelis-Menten equation as shown in Equation 1,
| (Eq. 1) |
where S is the substrate, is the maximal substrate-induced current, and is the substrate concentration at half (half-maximal concentration). Curve fittings were performed by using SigmaPlot (SPSS Science, Chicago, IL).
Transient Expression in Protoplasts
Transient expression of GFP fusion proteins in tobacco protoplasts was done as described previously (35), and the samples were examined by using a SP2 AOBS confocal microscope (Leica Microsystems, Wetzlar, Germany). Filter settings were 500–520 nm for GFP and 628–768 nm for chlorophyll epifluorescence detection.
RESULTS
The Arabidopsis genome contains two members of the ATF amino acid transporter gene family, At1g08230 (AtGAT1) and At5g41800, which exhibit a higher degree of homology to the proline/compatible solute transporters (ProTs) than to members of other subfamilies (Fig. 1) (22, 36). Interestingly, AtGAT1 showed higher homology to a rice protein (OJ1402_H07.15; 62.3% amino acid identity) than to its closest Arabidopsis homolog, At5g41800 (45.8% amino acid identity). Similarly, At5g41800 showed highest homology to a partial mRNA from chickpea (Cicer arietinum AJ004959) and to two rice proteins (OJ1007_H05.2 and P0407B12.25). This is in contrast to members of the ProT subfamily, where proteins from tomato, mangrove, rice, and Arabidopsis display a higher degree of homology within a species than between species. Similar to predictions for other ATF family members, AtGAT1 and At5g41800 encode proteins with a molecular mass of 49.69 and 49.86 kDa, respectively, and 9–12 predicted transmembrane domains (37). Based on the relatively low sequence identity of AtGAT1 and At5g41800 to ProTs (26–27.2% identity), we wondered whether the newly identified genes code for compatible solute transporters or represent a separate group of amino acid transporters.
FIGURE 1. Phylogenetic relationship between AtGAT1 and related proteins.
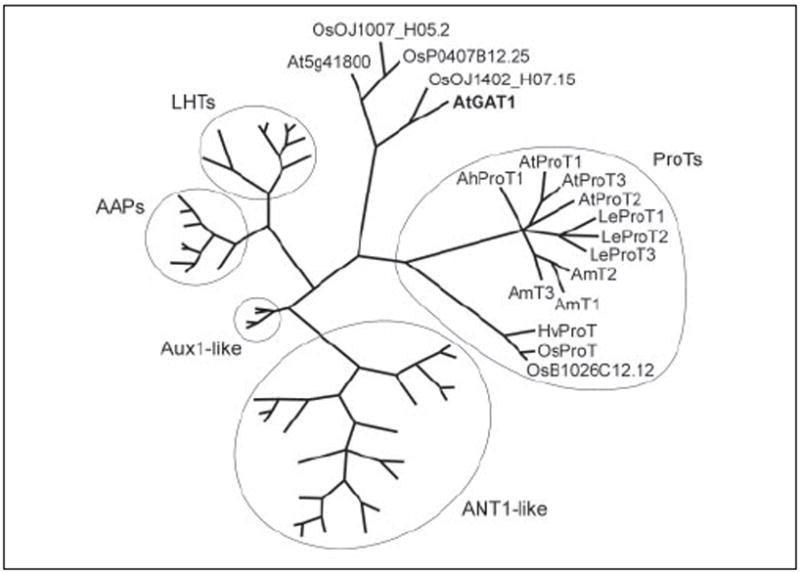
The analysis was performed using the aligned protein sequences of the Arabidopsis ATF gene family that contains several groups of amino acid permeases (AAPs, LHTs, ANT-like proteins) and proline or compatible solute transporters (ProTs) as well as potential auxin transporters (AUX1-like) (22, 25, 36, 63). Proteins from other plant species were included for the ProT-like (AmT1–3, (64), LeProT1–3, (34), OsProT, (65), HvProT1, (66), AhProT1, AAF76897) and the AtGAT1-like proteins from rice (Oryza sativa OJ1402_H07.15, OJ1007_H05.2, P0407B12.25). The partial AtGAT1-like protein from Cicer arietinum (AJ004959) was not included in the alignment. Maximum parsimony analysis was performed using PAUP 4.0b10 with all characters unweighted and gaps scored as missing characters (67). The complete alignment was based on 800 amino acids; 575 characters were parsimony informative. AUX1 was used as outgroup.
AtGAT1 Transports GABA with High Affinity
To determine whether AtGAT1 differs in its substrate specificity from members of the ProT gene family, the cDNAs of AtGAT1 (At1g08230) and At5g41800 were isolated by RT-PCR. Subsequently, AtGAT1 and At5g41800 were expressed under the control of the strong PMA1 promoter (vector pDR196) in the S. cerevisiae strain 22574d (28, 31). The S. cerevisiae mutant 22574d carries mutations in the general amino acid (gap1), proline (put4), and GABA (uga4) permeases and therefore is unable to grow on citrulline, proline, or GABA as the sole nitrogen source. As control, strain 22574d was transformed with the expression vector pDR196 and pDR195 harboring the cDNAs of the proline/compatible solute transporter AtProT2 or of the amino acid permease AtAAP2 (38, 39). Growth under selective conditions showed that, like AtProT2, AtGAT1 was able to mediate growth on GABA. However, AtGAT1 could not mediate growth on proline or citrulline (Fig. 2 and data not shown) and histidine was not a substrate for AtGAT1 (data not shown; strain JT16) (40). This behavior distinguished AtGAT1 from all transporters of the ATF family characterized so far. In contrast, At5g41800 could not mediate growth on any of the tested substrates. Therefore, At5g41800 was not included in further functional studies.
FIGURE 2. Complementation of an S. cerevisiae strain (22574d) deficient in the uptake of proline and GABA by AtGAT1.
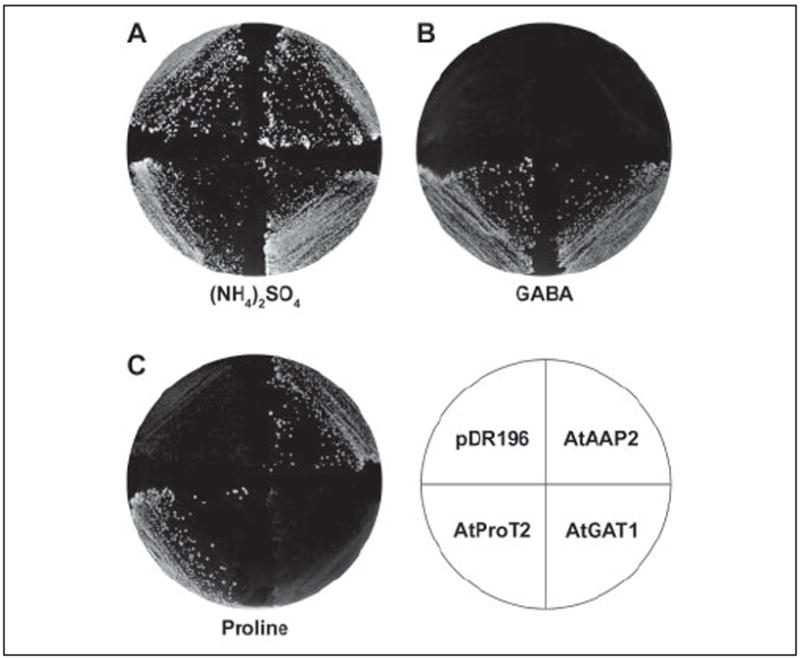
Growth of 22574d cells expressing AtGAT1, the proline/compatible solute transporter AtProT2 (23, 39), the amino acid permease AtAAP2 (38), and the strain transformed with the vector pDR196 is shown. Minimal medium supplemented with 5 g/liter ammonium sulfate (A), 1 g/liter GABA (B), or 1 g/liter proline (C) as sole nitrogen source.
Previous studies described the ProTs as low affinity GABA transporters (Km, 1.7–5 mm) (23, 25). To examine whether AtGAT1 differed in its kinetic properties, 3H-GABA uptake experiments were performed in 22574d cells expressing AtGAT1. Transport assays showed that AtGAT1 has a much higher affinity for GABA (Km 10 ± 3 μm) than any of the plant transporters characterized before (Fig. 3A). As shown for other transporters of the ATF family, transport rates increased with decreasing pH (Fig. 3B) (39, 41). Competition experiments for 3H-GABA uptake in the presence of a 5-fold excess of competitors showed that the GABA-related compounds β-aminobutyric acid and β-alanine reduced GABA transport rates by ~30%, whereas α-aminobutyric acid did not compete for GABA transport (Fig. 3C). In addition, compounds involved in GABA metabolism (i.e. glutamate, succinic semialdehyde, and succinate) were not competitors for AtGAT1-mediated GABA uptake. Alanine slightly reduced GABA transport rates, whereas histidine as well as compounds that were good competitors for ProT-mediated GABA transport (i.e. d- and l-proline, glycine betaine, and choline) did not reduce GABA uptake activity (23). That none of the substrates tested efficiently competed for GABA uptake suggested that AtGAT1 is a highly selective, high affinity GABA transporter.
FIGURE 3. Biochemical properties of AtGAT1 expressed in S. cerevisiae.
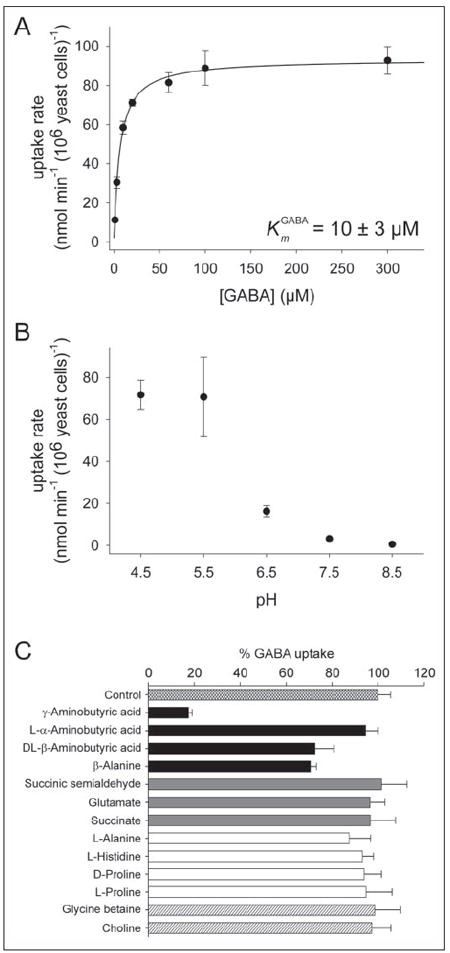
A, 3H-GABA uptake into S. cerevisiae (22574d) expressing AtGAT1. B, pH dependence of AtGAT1-mediated GABA uptake. C, competition of 3H-GABA uptake in the presence of a 5-fold excess of the respective substrate (GABA-related compounds, black bars; components of the GABA shunt, gray bars; amino acids, white bars; quaternary ammonium compounds, hatched bars). The uncompeted uptake rate was taken as 100% corresponding to 82.7 nmol GABA*min−1*(106 yeast cells)−1. A–C, all values shown are mean ± S.D. from at least three independent experiments. GABA concentrations used were 1–300 μm (A) and 100 μm (B and C).
Electrophysiological Assay of AtGAT1 GABA Transport Kinetics
To determine whether weakly competing compounds were substrates of AtGAT1 and to examine the kinetic properties of AtGAT1 in more detail, substrate-induced currents were analyzed in X. laevis oocytes injected with AtGAT1 cRNA. At a membrane potential of −50 mV and a pH of 5.0, addition of 1 mm GABA to the bathing medium of AtGAT1-expressing oocytes induced inward currents ranging from 96 to 191 nA (Fig. 4B). Current amplitude was dependent on the batch of oocytes and incubation time after cRNA injection. As is commonly observed with many other electrogenic transporters expressed in X. laevis oocytes, the AtGAT1 substrate-evoked current reached a peak followed by slow decay in the presence of the substrate (Fig. 4B) (e.g. Refs. 42 and 43). No GABA-evoked currents were observed in control oocytes (Fig. 4A).
FIGURE 4. pH-dependent, GABA-evoked currents of oocytes expressing AtGAT1.
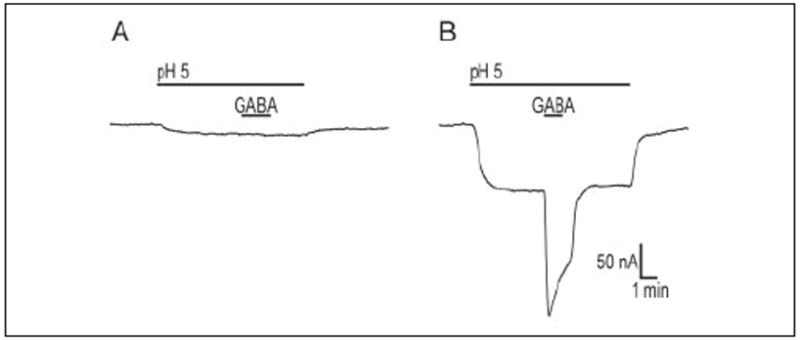
Current traces were recorded from a control oocyte (A) and an oocyte injected with AtGAT1 cRNA (B) maintained at Vm −50 mV. Oocytes were initially incubated in a solution at pH 7.5, and at the time indicated by the bar the oocyte was perfused with a solution at pH 5.0. In both the control cell and AtGAT1-expressing cell, the increase in the external H+ concentration caused an inward current. The magnitude of this current was greater in AtGAT1-expressing cells, suggesting that AtGAT1 may sustain an H+ leak in the absence of GABA. The lack of a specific inhibitor of AtGAT1 did not allow us to examine this feature further. At high H+ concentration, addition of GABA (1 mm) to the bathing medium of AtGAT1-expressing cell caused an inward current (~180 nA). The GABA-evoked current reached a peak followed by slow decay. No GABA-evoked currents were observed in control oocytes.
Fig. 5A shows the GABA activation curve at a holding potential of −50 mV and an external proton concentration ([H+]out) of 10 μm (pH 5). The apparent affinity of AtGAT1 for GABA was 43 ± 7 μm (n = 3). Likewise, the H+ activation curve at −50 mV and 1 mm GABA was hyperbolic with a K0.5 of 440 ± 40 nm (Fig. 5D). The apparent affinity for GABA ( ) appeared not to be voltage dependent in the range from −90 to −10 mV (Fig. 5B), whereas the maximum transport rate ( ) increased slightly at depolarized membrane potentials (Fig. 5C).
FIGURE 5. Kinetics of GABA transport.
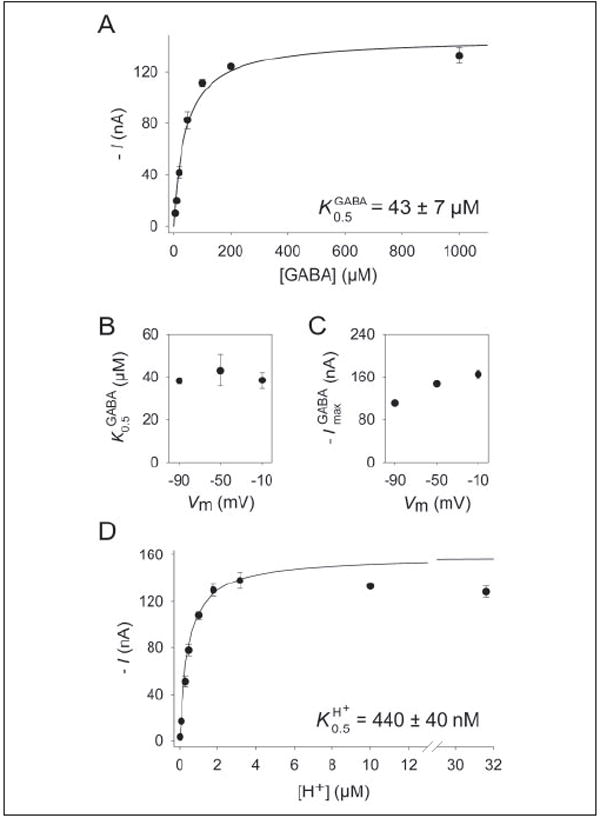
A, GABA-induced currents are plotted as a function of the external GABA concentration ([H+]out 10 μm and Vm −50 mV). B, voltage dependence of at 10 μm [H+]out. C, voltage dependence of at 10 μm [H+]out. D, GABA-induced currents (1 mm) as a function of the external H+ concentration (Vm−50 mV). A–D, values represent the mean ± S.E. of three experiments.
Substrate Selectivity of AtGAT1
Uptake studies such as those shown in Fig. 3C demonstrate whether a compound can alter AtGAT1-mediated GABA transport, presumably by competing for the GABA binding site of AtGAT1. However, these competition studies do not reveal whether a tested compound is in fact a transported substrate of AtGAT1. Thus, to further examine the substrate selectivity of AtGAT1, electrophysiological assays were performed (Fig. 6). GABA, GABA analogs, and other substrates were applied at a concentration of 1 mm, whereas [H+]out was 10 μm and Vm was −50 mV (Fig. 6). An inward current evoked by a substrate was taken as H+-driven, AtGAT1-mediated substrate translocation into the cell. l-Alanine, β-aminobutyric acid, and β-alanine, which only weakly competed for GABA uptake in S. cerevisiae (see Fig. 3C), induced inward currents comparable in magnitude with that induced by GABA. Other GABA-related compounds with longer carbon chains, such as 5-aminovaleric acid, 6-aminocaproic acid, and 8-aminocaprylic acid, were also good substrates. Interestingly, the current induced by butylamine, which lacks the carboxyl group, was similar to that induced by GABA. None of these substrates induced currents in control oocytes.
FIGURE 6. Substrate selectivity of AtGAT1.
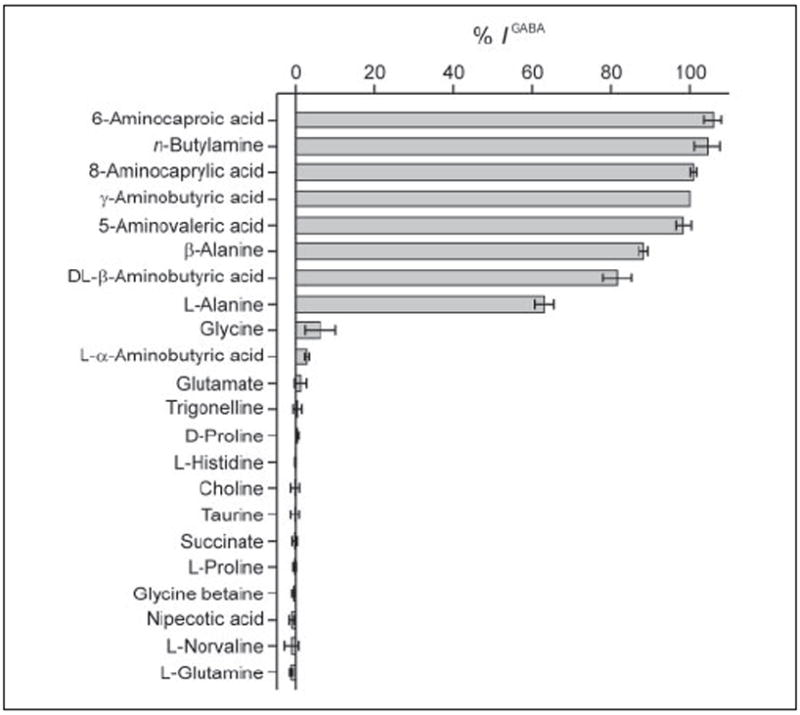
Substrate-induced currents in AtGAT1-expressing oocytes were recorded at substrate concentrations of 1 mm. The holding potential (Vm) was −50 mV, and [H+]out was 10 μm. Substrate-induced currents were normalized with respect to that evoked by GABA (1 mm). No evoked currents were detected when these substrates were tested in control oocytes (data not shown). Values are mean ± S.E. from at least three oocytes. See Table 1 for the structure of compounds.
Similar to competition experiments using S. cerevisiae, d- and l-proline as well as glycine betaine and choline were not recognized as substrates (see Figs. 3C and 6). In addition, substrates of the GABA shunt (succinate and glutamate) did not induce currents in AtGAT1-expressing oocytes. Moreover, trigonelline, a betaine present at high concentrations in many legume seeds (44), and the amino acids histidine, glutamine, and norvaline were not transported. The rigid GABA analog nipecotic acid and the amino sulfonate taurine, both substrates of neuronal GABA transporters in mouse (mGAT3 and mGAT4) (2, 45, 46), did not induce currents in AtGAT1-expressing oocytes.
We reasoned that the compounds that did not compete for GABA uptake in S. cerevisiae but induced currents in AtGAT1-expressing oocytes were low affinity substrates of AtGAT1. Thus, we determined the affinity of AtGAT1 for various substrates. Substrate-induced currents were measured during applications of substrates at concentrations between 5 μm and 100 mm. Currents were plotted against the substrate concentration, and curves were fitted to Equation 1. The apparent affinity of AtGAT1 for individual substrates varied by a factor of 1000 (Table 1). AtGAT1 showed the highest affinity for butylamine with a K0.5 2-fold lower than that for GABA. Moving the amino group closer to the carboxyl group (such as in β-aminobutyric acid and α-aminobutyric acid) progressively reduced the apparent affinity (see Table 1). Increasing the carbon chain backbone from GABA to 8-aminocaprylic acid only marginally affected the K0.5 values (30–80 μm). In addition, 5-aminolevulinic acid was transported with an affinity comparable with that of GABA. Reducing the carbon chain length (e.g. β-alanine) resulted in a much lower substrate affinity (K0.5 200 μm).A similar affinity was determined for 4-aminophenylacetic acid, a peptide mimic lacking a peptide bond (47). For compounds with even shorter carbon chains (i.e. l-alanine), the affinity dropped even further. The apparent affinity for l-glycine and l-α-aminobutyric acid, which had been shown to induce currents in AtGAT1-expressing oocytes (Fig. 6), as well as for l-2,4-diaminobutyric acid and the dipeptide glycyl-glycine, was >10 mm. Although the K0.5 values of the different substrates varied considerably, the maximum transport rate ( ) for all substrates remained relatively constant (± 20%) (see Table 1).
TABLE 1. Kinetics of AtGAT1-mediated substrate transport.
Substrate-induced currents were recorded at Vm = −50 mV and 10 μm [H+]out, and the apparent affinities (K0.5) were determined according to Equation 1. For each substrate, the maximum transport rate was normalized with respect to that observed for GABA in the same cell. Values are mean ± S.E. from at least three independent experiments.
| Substance | Chemical structure | K0.5(μM) | ||
|---|---|---|---|---|
| n-Butylamine | 27 ± 1 | 114 ± 1 | ||
| γ-Aminobutyric acid | 43 ± 7 | 100 | ||
| 5-Aminovaleric acid | 73 ± 3 | 109 ± 2 | ||
| 6-Aminocaproic acid | 52 ± 13 | 110 ± 1 | ||
| 7-Aminoheptanoic acid | 33 ± 6 | 102 ± 5 | ||
| 8-Aminocaprylic acid | 39 ± 7 | 117 ± 2 | ||
| 5-Aminolevulinic acid | 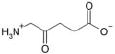 |
81 ± 13 | 110 ± 1 | |
| 4-Aminophenylacetic acid | 210 ± 15 | 86 ± 1 | ||
| β-Alanine | 218 ± 27 | 116 ± 5 | ||
| β-Aminobutyric acid | 228 ± 38 | 111 ± 5 | ||
| Alanine |  |
621 ± 11 | 100 ± 1 | |
| Glycine | 11446 ± 2905 | 77 ± 9 | ||
| α-Aminobutyric acid |  |
16313 ± 3277 | 84 ± 3 | |
| 2,4-Diaminobutyric acid |  |
48299 ± 2631 | 94 ± 4 | |
| Gly-Gly | 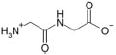 |
37121 ± 5693 | 98 ± 4 |
AtGAT1 Is Localized at the Plasma Membrane
Functional complementation of the S. cerevisiae GABA transport mutant by AtGAT1 and functional expression in X. laevis oocytes showed that at least a fraction of the protein is targeted to and localized at the plasma membrane in both heterologous expression systems. To assess its cellular localization in planta, fusion proteins of AtGAT1 and GFP were transiently expressed in tobacco protoplasts under the control of the cauliflower mosaic virus 35S promoter (Fig. 7). Fluorescent images obtained by confocal laser scanning microscopy showed that the signal from the GFP-AtGAT1 fusion protein was present as a single fluorescent ring at the periphery of the protoplast, suggestive of its localization at the plasma membrane (Fig. 7A). In addition, the protoplasts showed some GFP fluorescence on internal membranes. Similar results were obtained for the AtGAT1-GFP fusion (data not shown). Free GFP localized to the cytosol (Fig. 7C). When expressed in Xenopus oocytes, both fusion proteins, AtGAT1-GFP and GFP-AtGAT1, were able to mediate GABA transport with affinities comparable with that of AtGAT1 ( was 58 ± 6 μm for AtGAT1-GFP and 36 ± 5 μm for GFP-AtGAT1; n = 3).
FIGURE 7. Localization of the GFP-AtGAT1 fusion protein at the plasma membrane of tobacco protoplasts.
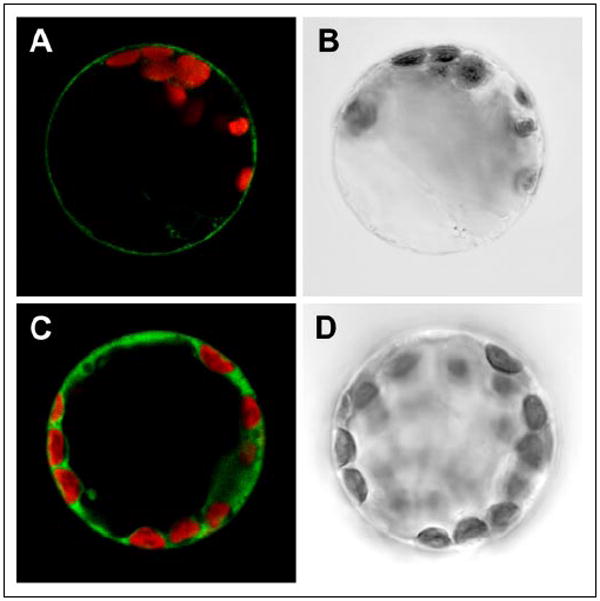
A and C, confocal laser scanning microscope images. B and D, corresponding bright field images of tobacco protoplasts transiently expressing GFP-AtGAT1 (A, B) or GFP (C, D). Merged images show GFP fluorescence (green) and chlorophyll fluorescence (red). Diameter of protoplasts is ~40 μm.
AtGAT1 Expression in Arabidopsis Is Induced by Wounding and during Senescence
AtGAT1 expression in Arabidopsis was extremely weak and hardly detectable by RNA gel blot analysis. Relative quantification using real-time PCR, with the actin mRNA (AtACT2) as a reference, demonstrated the highest levels of AtGAT1 expression in flowers and low expression levels in roots, leaves, and stems (Fig. 8A). Microarray analyses (48) showed that in flowers AtGAT1 expression is highest in sepals, lower in petals and carpels, and very low in stamen. In agreement with our own data, only low AtGAT1 transcript levels were found in pollen (data not shown). It was shown previously that GABA accumulates under various stress conditions (12). However, cold, heat, and anoxia did not significantly alter AtGAT1 mRNA levels (not shown). Mechanical wounding caused a transient increase of AtGAT1 transcript levels that dropped below control values after 24 h (Fig. 8B). A similar time course of AtGAT1 expression after wounding has been observed in microarray analyses (TAIR Accession: ExpressionSet 1007966439). Interestingly, AtGAT1 expression also increased during leaf senescence of both detached and naturally senescing leaves (Fig. 8C), corresponding to results obtained in microarray analyses (48). Differences in induction during dark-induced and natural senescence might result from impaired export of compounds in detached leaves or may reflect differences in carbon:nitrogen ratio as described for other genes (49). In both experiments, the increase in AtGAT1 expression correlates with an increase in GABA content in the corresponding tissue (Fig. 8C).
FIGURE 8. Expression analysis of AtGAT1 in Arabidopsis.
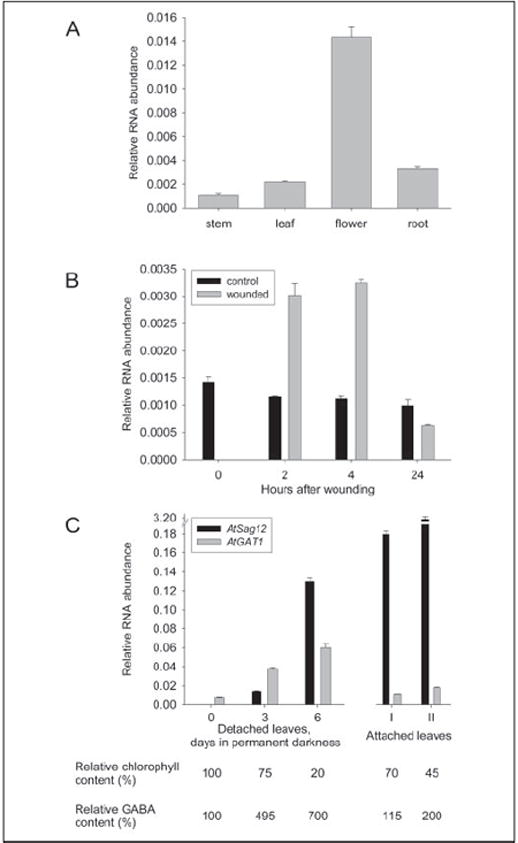
Expression was analyzed by relative quantification using real-time PCR with the actin mRNA (At3g18780) as a reference. Expression of AtGAT1 is given relative to actin mRNA levels and is the mean of three replicates ± S.E. Similar results were obtained using RNAs from three independent experiments as template. A, RNA from source leaves, stems, roots, and flowers of soil-grown plants was analyzed. B, AtGAT1 expression in control plants (black bars) and wounded plants (gray bars) 2, 4, and 24 h after treatment. C, RNA from senescing leaves was analyzed for AtGAT1 expression (gray bars) using both detached and naturally senescing leaves at different stages of senescence (see “Experimental Procedures”). Progression of senescence was monitored by measuring the expression of AtSag12 (black bars), a marker gene for senescence (68), and determining the content of chlorophyll. Additionally, GABA concentration in leaves was determined. 100% chlorophyll content corresponds to 0.8 μg of chlorophyll/mg of fresh weight; 100% GABA content corresponds to 34 pmol GABA/mg of fresh weight. Comparable results were obtained in three independent experiments.
DISCUSSION
Expression of AtGAT1 in S. cerevisiae and Xenopus oocytes enabled us to demonstrate that AtGAT1 mediates H+-dependent, high affinity transport of GABA and GABA-related compounds. The characteristics of AtGAT1 differ significantly from those of the most closely related proteins of the ProT-family, as glycine betaine and proline are not recognized and as GABA is transported with very high affinity. Amino acids, which are substrates for other members of the ATF family, are not recognized by AtGAT1 (24). The comparison of the substrate selectivity of AtGAT1 determined in S. cerevisiae and Xenopus oocytes showed that some compounds that only weakly (β-Ala, β-ABA) or marginally (l-Ala) competed for GABA uptake in S. cerevisiae induced currents in AtGAT1-expressing oocytes. It was determined that these compounds were transported in Xenopus oocytes with medium or low apparent affinity, thus corroborating the substrate selectivity determined using S. cerevisiae.
GABA transporters that evolved in bacteria, yeast, and mammals belong to different gene families and do not show sequence homology to AtGAT1. Although both the primary structure and driving force for transport (ATP, Na+, or H+ gradient) are diverse, their high affinity for GABA is a common feature of GABA transporters from the different kingdoms, whereas their affinity for other substrates is less conserved.
GABA transporters from mammals5 and E. coli (50) have been shown to transport 5-aminovaleric acid in addition to GABA. Similarly, AtGAT1 was able to recognize GABA-related compounds with longer carbon backbone. Interestingly, not only 5-aminovaleric acid but also 6-aminocaproic acid, 7-aminoheptanoic acid, and 8-aminocaprylic acid induced currents with similar apparent affinities as GABA. In mammals, 7-aminoheptanoic acid and 8-aminocaprylic acid are not transported by members of the GAT family.5 The proton-coupled animal peptide transporter PepT1 does not recognize GABA but transports both 5-aminovaleric acid and 6-aminocaproic acid, and even 8-aminocaprylic acid and 11-amino-undecanoic acid were recognized (51). However, these long chain ω-aminofatty acids are not substrates for other peptide transporters (i.e. for animal PepT2, Lactococcus lactis DtpT, or Arabidopsis AtPTR1) and thus their transport is not a general feature of peptide transporters (35, 52, 53). In addition, δ-aminolevulinic acid, a precursor of porphyrin biosynthesis, is transported not only by AtGAT1 and GABA transporters from mammals (GATs) (54) and S. cerevisiae (Uga4) (55) but also by proton-coupled intestinal and renal peptide transporters (PEPT1 and PEPT2) (56).
Unlike the E. coli GabP, animal GATs, or AtGAT1, the GabP-mediated GABA transport in B. subtilis is not inhibited by the larger GABA analog 5-aminovaleric acid and shows equal preference for the 3-carbon β-alanine and the 4-carbon GABA. In addition, transport is not inhibited by conformationally constrained compounds such as nipecotic acid. Thus it was suggested that B. subtilis has a more stringent and less spacious domain for substrate recognition than the other GABA transporters (50). The functional characteristics of AtGAT1 with a preference for longer chain GABA-related compounds and a reduced affinity for 3- and 2-carbon amino acids place AtGAT1 closer to E. coli GabP and the animal GATs than to B. subtilis GabP. Nevertheless, AtGAT1 differs substantially from these transporters in its inability to transport nipecotic acid and its high affinity for several long chain ω-aminofatty acids as discussed above. Additionally, in contrast to the neuronal GABA transporters mGAT3 and mGAT4 from mouse,5 the aminosulfonic acid taurine was not able to induce currents in AtGAT1-expressing oocytes (Fig. 6). Thus, a sulfate group cannot substitute for a carboxyl group. However, the carboxyl group is not required for substrate recognition by AtGAT1, as butylamine was able to induce currents with high apparent affinity. Concentrations of butylamine and long chain ω-aminofatty acids in plants are unknown, but it is assumed that concentrations are rather low. Therefore, in planta, AtGAT1 might function primarily as a GABA transporter.
Potential Function of AtGAT1 in Arabidopsis
GABA is present in the cytosol, where it is synthesized, but can also be found in chloroplasts, the vacuole, and in the apoplast (57). In addition, GABA has to be translocated to the mitochondria for degradation. Thus, GABA transporters are required at several cellular membranes. Our results demonstrate that the AtGAT1/GFP fusion proteins are targeted to the plasma membrane when transiently expressed in protoplasts, indicating that in Arabidopsis AtGAT1 mediates GABA uptake from the apoplast and might be important in the reallocation or retrieval of GABA.
High GABA concentrations have been detected under a variety of stress conditions such as low temperature, mechanical stimulation, and oxygen deficiency (12, 13). In soybean plants, GABA concentrations increase under water stress in all plant tissues. Elevated GABA concentrations can also be found in the xylem of nodulated soybean subjected to drought or hypoxic stress (58). In anoxically grown Ricinus communis seedlings, GABA is one of the main amino acids in the phloem (20), indicating that translocation of GABA in the phloem might be increased under stress conditions. Although in our experiments no induction of AtGAT1 expression was detectable under low oxygen availability, elevated AtGAT1 mRNA levels were found upon wounding and during senescence, two conditions under which GABA concentrations are elevated (59, 60).
Under non-stress conditions, AtGAT1 expression was higher in flowers when compared with other organs. Palanivelu et al. (17) showed that a GABA gradient is important for pollen tube growth and guidance through female tissue to the micropyle. AtGAT1 expression was very low in pollen and only slightly elevated in carpels, thus not strongly supporting a role of AtGAT1 in this process. However, AtGAT1 might be expressed in germinating pollen, and AtGAT1 activity in carpels might contribute in establishing such a GABA gradient important for pollen tube guidance. Thus, a possible role of AtGAT1 in this process remains to be further investigated. The higher AtGAT1 transcript levels in sepals and petals correlate with increased expression of other senescence-associated genes, e.g. pheophorpide a oxygenase, which again points to a role of AtGAT1 during senescence (61, 62). The role of GABA during senescence is not clear, but Bouché and Fromm (13) speculated that GABA might act as a signaling molecule to coordinate carbon:nitrogen balance in changing nutrient environments, as it occurs during senescence (49). In addition, GABA may play an anaplerotic role during senescence (60).
In summary, our data show that AtGAT1 is an H+-driven, plasma membrane-localized transporter that recognizes GABA and several GABA-related compounds with high affinity. The expression implicates a role of AtGAT1 in conditions with elevated GABA concentrations as observed during senescence and wounding.
Acknowledgments
We thank Michael J. Errico, William Lee, Erik B. Malarkey, and Stefan Meier for preparation of oocytes and Christopher Ball and Rebecca Alder for taking care of the plants.
Footnotes
This work was supported by Grants 31-64918.01 and 3100A0-107507 from the Swiss National Foundation (to A. M., S. G., and D. R.) and National Institutes of Health Grant S06 GM53933 (to S. E.).
The abbreviations used are: GABA, γ-aminobutyric acid; AAP, amino acid permease; ATF, amino acid transporter family; GAT, GABA transporter; GabP, GABA permease; GFP, green fluorescent protein; PIPES, 1,4-piperazinediethanesulfonic acid; HOMOPIPES, homopiperazine-1,4-bis(2-ethanesulfonic acid); ProT, proline transporter.
M. Suter Grotemeyer and D. Rentsch, unpublished information.
S. R. Spencer, O. R. Padilla, and S. Eskandari, unpublished data.
References
- 1.Steward FC, Thompson JF, Dent CE. Science. 1949;110:439–440. [Google Scholar]
- 2.Borden LA. Neurochem Int. 1996;29:335–356. doi: 10.1016/0197-0186(95)00158-1. [DOI] [PubMed] [Google Scholar]
- 3.Chen N-H, Reith MA, Quick M. Pflugers Arch Eur J Physiol. 2004;447:519–531. doi: 10.1007/s00424-003-1064-5. [DOI] [PubMed] [Google Scholar]
- 4.Owens DF, Kriegstein AR. Nat Rev Neurosci. 2002;3:715–727. doi: 10.1038/nrn919. [DOI] [PubMed] [Google Scholar]
- 5.Jack DL, Paulsen IT, Saier MH. Microbiology. 2000;146:1797–1814. doi: 10.1099/00221287-146-8-1797. [DOI] [PubMed] [Google Scholar]
- 6.Hosie AHF, Allaway D, Galloway CS, Dunsby HA, Poole PS. J Bacteriol. 2002;184:4071–4080. doi: 10.1128/JB.184.15.4071-4080.2002. [DOI] [PMC free article] [PubMed] [Google Scholar]
- 7.Shaibe E, Metzer E, Halpern YS. J Bacteriol. 1985;163:933–937. doi: 10.1128/jb.163.3.933-937.1985. [DOI] [PMC free article] [PubMed] [Google Scholar]
- 8.Kumar S, Punekar NS. Mycol Res. 1997;101:403–409. [Google Scholar]
- 9.Solomon PS, Oliver RP. Planta. 2002;214:414–420. doi: 10.1007/s004250100632. [DOI] [PubMed] [Google Scholar]
- 10.Coleman ST, Fang TK, Rovinsky SA, Turano FJ, Moye-Rowley WS. J Biol Chem. 2001;276:244–250. doi: 10.1074/jbc.M007103200. [DOI] [PubMed] [Google Scholar]
- 11.Yohannes E, Barnhart DM, Slonczewski JL. J Bacteriol. 2004;186:192–199. doi: 10.1128/JB.186.1.192-199.2004. [DOI] [PMC free article] [PubMed] [Google Scholar]
- 12.Shelp BJ, Bown AW, McLean MD. Trends Plant Sci. 1999;4:446–452. doi: 10.1016/s1360-1385(99)01486-7. [DOI] [PubMed] [Google Scholar]
- 13.Bouché N, Fromm H. Trends Plant Sci. 2004;9:110–115. doi: 10.1016/j.tplants.2004.01.006. [DOI] [PubMed] [Google Scholar]
- 14.Breitkreuz KE, Allan WL, Van Cauwenberghe OR, Jakobs C, Talibi D, André B, Shelp BJ. J Biol Chem. 2003;278:41552–41556. doi: 10.1074/jbc.M305717200. [DOI] [PubMed] [Google Scholar]
- 15.Bouché N, Fait A, Bouchez D, Moller SG, Fromm H. Proc Natl Acad Sci U S A. 2003;100:6843–6848. doi: 10.1073/pnas.1037532100. [DOI] [PMC free article] [PubMed] [Google Scholar]
- 16.Bouché N, Lacombe B, Fromm H. Trends Cell Biol. 2003;13:607–610. doi: 10.1016/j.tcb.2003.10.001. [DOI] [PubMed] [Google Scholar]
- 17.Palanivelu R, Brass L, Edlund AF, Preuss D. Cell. 2003;114:47–59. doi: 10.1016/s0092-8674(03)00479-3. [DOI] [PubMed] [Google Scholar]
- 18.Servaites JC, Schrader LE, Jung DM. Plant Physiol. 1979;64:546–550. doi: 10.1104/pp.64.4.546. [DOI] [PMC free article] [PubMed] [Google Scholar]
- 19.Chung I, Bown AW, Shelp BJ. Plant Physiol. 1992;99:659–664. doi: 10.1104/pp.99.2.659. [DOI] [PMC free article] [PubMed] [Google Scholar]
- 20.van Dongen JT, Schurr U, Pfister M, Geigenberger P. Plant Physiol. 2003;131:1529–1543. doi: 10.1104/pp.102.017202. [DOI] [PMC free article] [PubMed] [Google Scholar]
- 21.Young GB, Jack DL, Smith DW, Saier MH., Jr Biochim Biophys Acta. 1999;1415:306–322. doi: 10.1016/s0005-2736(98)00196-5. [DOI] [PubMed] [Google Scholar]
- 22.Wipf D, Ludewig U, Tegeder M, Rentsch D, Koch W, Frommer WB. Trends Biochem Sci. 2002;27:139–147. doi: 10.1016/s0968-0004(01)02054-0. [DOI] [PubMed] [Google Scholar]
- 23.Breitkreuz KE, Shelp BJ, Fischer WN, Schwacke R, Rentsch D. FEBS Lett. 1999;450:280–284. doi: 10.1016/s0014-5793(99)00516-5. [DOI] [PubMed] [Google Scholar]
- 24.Fischer WN, Loo DD, Koch W, Ludewig U, Boorer KJ, Tegeder M, Rentsch D, Wright EM, Frommer WB. Plant J. 2002;29:717–731. doi: 10.1046/j.1365-313x.2002.01248.x. [DOI] [PubMed] [Google Scholar]
- 25.Grallath S, Weimar T, Meyer A, Gumy C, Suter-Grotemeyer M, Neuhaus JM, Rentsch D. Plant Physiol. 2005;137:117–126. doi: 10.1104/pp.104.055079. [DOI] [PMC free article] [PubMed] [Google Scholar]
- 26.Strain HH, Cope BT, Svec WA. Methods Enzymol. 1971;23:452–476. [Google Scholar]
- 27.Bidlingmeyer BA, Cohen SA, Tarvin TL. J Chromatogr. 1984;336:93–104. doi: 10.1016/s0378-4347(00)85133-6. [DOI] [PubMed] [Google Scholar]
- 28.Rentsch D, Laloi M, Rouhara I, Schmelzer E, Delrot S, Frommer WB. FEBS Lett. 1995;370:264–268. doi: 10.1016/0014-5793(95)00853-2. [DOI] [PubMed] [Google Scholar]
- 29.Baukrowitz T, Tucker SJ, Schulte U, Benndorf K, Ruppersberg JP, Fakler B. EMBO J. 1999;18:847–853. doi: 10.1093/emboj/18.4.847. [DOI] [PMC free article] [PubMed] [Google Scholar]
- 30.Sambrook J, Fritsch EF, Maniatis T. Molecular Cloning: A Laboratory Manual. Cold Spring Harbor Laboratory Press; Cold Spring Harbor, NY: 1989. pp. 7.10–7.11. [Google Scholar]
- 31.Jauniaux JC, Vandenbol M, Vissers S, Broman K, Grenson M. Eur J Biochem. 1987;164:601–606. doi: 10.1111/j.1432-1033.1987.tb11169.x. [DOI] [PubMed] [Google Scholar]
- 32.Dohmen RJ, Strasser AWM, Höner CB, Hollenberg CP. Yeast. 1991;7:691–692. doi: 10.1002/yea.320070704. [DOI] [PubMed] [Google Scholar]
- 33.Burke D, Dawson D, Stearns T. Methods in Yeast Genetics. Cold Spring Harbor Laboratory Press; Cold Spring Harbor, NY: 2000. p. 172. [Google Scholar]
- 34.Schwacke R, Grallath S, Breitkreuz KE, Stransky E, Stransky H, Frommer WB, Rentsch D. Plant Cell. 1999;11:377–392. doi: 10.1105/tpc.11.3.377. [DOI] [PMC free article] [PubMed] [Google Scholar]
- 35.Dietrich D, Hammes U, Thor K, Suter-Grotemeyer M, Fluckiger R, Slusarenko AJ, Ward JM, Rentsch D. Plant J. 2004;40:488–499. doi: 10.1111/j.1365-313X.2004.02224.x. [DOI] [PubMed] [Google Scholar]
- 36.Fischer W-N, Andre B, Rentsch D, Krolkiewicz S, Tegeder M, Breitkreuz K, Frommer WB. Trends Plant Sci. 1998;3:188–195. [Google Scholar]
- 37.Schwacke R, Schneider A, Van Der Graaff E, Fischer K, Catoni E, Desimone M, Frommer WB, Flugge UI, Kunze R. Plant Physiol. 2003;131:16–26. doi: 10.1104/pp.011577. [DOI] [PMC free article] [PubMed] [Google Scholar]
- 38.Kwart M, Hirner B, Hummel S, Frommer WB. Plant J. 1993;4:993–1002. doi: 10.1046/j.1365-313x.1993.04060993.x. [DOI] [PubMed] [Google Scholar]
- 39.Rentsch D, Hirner B, Schmelzer E, Frommer WB. Plant Cell. 1996;8:1437–1446. doi: 10.1105/tpc.8.8.1437. [DOI] [PMC free article] [PubMed] [Google Scholar]
- 40.Tanaka J, Fink GR. Gene. 1985;38:205–214. doi: 10.1016/0378-1119(85)90219-7. [DOI] [PubMed] [Google Scholar]
- 41.Fischer WN, Kwart M, Hummel S, Frommer WB. J Biol Chem. 1995;270:16315–16320. doi: 10.1074/jbc.270.27.16315. [DOI] [PubMed] [Google Scholar]
- 42.Forster IC, Loo DD, Eskandari S. Am J Physiol. 1999;276:F644–F649. doi: 10.1152/ajprenal.1999.276.4.F644. [DOI] [PubMed] [Google Scholar]
- 43.Whitlow RD, Sacher A, Loo DDF, Nelson N, Eskandari S. J Biol Chem. 2003;278:17716–17726. doi: 10.1074/jbc.M207582200. [DOI] [PubMed] [Google Scholar]
- 44.Zheng X-Q, Hayashibe E, Ashihara H. J Exp Bot. 2005;56:1615–1623. doi: 10.1093/jxb/eri156. [DOI] [PubMed] [Google Scholar]
- 45.Liu QR, Lopez-Corcuera B, Mandiyan S, Nelson H, Nelson N. J Biol Chem. 1993;268:2106–2112. [PubMed] [Google Scholar]
- 46.Kragler A, Hofner G, Wanner KT. Eur J Pharmacol. 2005;519:43–47. doi: 10.1016/j.ejphar.2005.06.053. [DOI] [PubMed] [Google Scholar]
- 47.Temple CS, Stewart AK, Meredith D, Lister NA, Morgan KM, Collier ID, Vaughan-Jones RD, Boyd CA, Bailey PD, Bronk JR. J Biol Chem. 1998;273:20–22. doi: 10.1074/jbc.273.1.20. [DOI] [PubMed] [Google Scholar]
- 48.Schmid M, Davison TS, Henz SR, Pape UJ, Demar M, Vingron M, Scholkopf B, Weigel D, Lohmann JU. Nat Genet. 2005;37:501–506. doi: 10.1038/ng1543. [DOI] [PubMed] [Google Scholar]
- 49.Buchanan-Wollaston V, Page T, Harrison E, Breeze E, Lim PO, Nam HG, Lin JF, Wu SH, Swidzinski J, Ishizaki K, Leaver CJ. Plant J. 2005;42:567–585. doi: 10.1111/j.1365-313X.2005.02399.x. [DOI] [PubMed] [Google Scholar]
- 50.Brechtel CE, King SC. Biochem J. 1998;333:565–571. doi: 10.1042/bj3330565. [DOI] [PMC free article] [PubMed] [Google Scholar]
- 51.Döring F, Will J, Amasheh S, Clauss W, Ahlbrecht H, Daniel H. J Biol Chem. 1998;273:23211–23218. doi: 10.1074/jbc.273.36.23211. [DOI] [PubMed] [Google Scholar]
- 52.Theis S, Hartrodt B, Kottra G, Neubert K, Daniel H. Mol Pharmacol. 2002;61:214–221. doi: 10.1124/mol.61.1.214. [DOI] [PubMed] [Google Scholar]
- 53.Fang G, Konings WN, Poolman B. J Bacteriol. 2000;182:2530–2535. doi: 10.1128/jb.182.9.2530-2535.2000. [DOI] [PMC free article] [PubMed] [Google Scholar]
- 54.Bermudez Moretti M, Correa Garcia S, Perotti C, Batlle A, Casas A. Br J Cancer. 2002;87:471–474. doi: 10.1038/sj.bjc.6600481. [DOI] [PMC free article] [PubMed] [Google Scholar]
- 55.Bermudez Moretti M, Correa Garcia S, Ramos E, Batlle A. Cell Mol Biol. 1996;42:519–523. [PubMed] [Google Scholar]
- 56.Döring F, Walter J, Will J, Focking M, Boll M, Amasheh S, Clauss W, Daniel H. J Clin Investig. 1998;101:2761–2767. doi: 10.1172/JCI1909. [DOI] [PMC free article] [PubMed] [Google Scholar]
- 57.Tilsner J, Kassner N, Struck C, Lohaus G. Planta. 2005;221:328–338. doi: 10.1007/s00425-004-1446-8. [DOI] [PubMed] [Google Scholar]
- 58.Serraj R, Shelp BJ, Sinclair TR. Physiol Plant. 1998;102:79–86. doi: 10.1034/j.1399-3054.1998.1020111.x. [DOI] [PubMed] [Google Scholar]
- 59.Wallace W, Secor J, Schrader LE. Plant Physiol. 1984;75:170–175. doi: 10.1104/pp.75.1.170. [DOI] [PMC free article] [PubMed] [Google Scholar]
- 60.Diaz C, Purdy S, Christ A, Morot-Gaudry JF, Wingler A, Masclaux-Daubresse C. Plant Physiol. 2005;138:898–908. doi: 10.1104/pp.105.060764. [DOI] [PMC free article] [PubMed] [Google Scholar]
- 61.Rubinstein B. Plant Mol Biol. 2000;44:303–318. doi: 10.1023/a:1026540524990. [DOI] [PubMed] [Google Scholar]
- 62.Pruzinska A, Tanner G, Aubry S, Anders I, Moser S, Muller T, Ongania KH, Krautler B, Youn JY, Liljegren SJ, Hortensteiner S. Plant Physiol. 2005;139:52–63. doi: 10.1104/pp.105.065870. [DOI] [PMC free article] [PubMed] [Google Scholar]
- 63.Chen L, Ortiz-Lopez A, Jung A, Bush DR. Plant Physiol. 2001;125:1813–1820. doi: 10.1104/pp.125.4.1813. [DOI] [PMC free article] [PubMed] [Google Scholar]
- 64.Waditee R, Hibino T, Tanaka Y, Nakamura T, Incharoensakdi A, Hayakawa S, Suzuki S, Futsuhara Y, Kawamitsu Y, Takabe T. J Biol Chem. 2002;277:18373–18382. doi: 10.1074/jbc.M112012200. [DOI] [PubMed] [Google Scholar]
- 65.Igarashi Y, Yoshiba Y, Takeshita T, Nomura S, Otomo J, Yamaguchi-Shinozaki K, Shinozaki K. Plant Cell Physiol. 2000;41:750–756. doi: 10.1093/pcp/41.6.750. [DOI] [PubMed] [Google Scholar]
- 66.Ueda A, Shi W, Sanmiya K, Shono M, Takabe T. Plant Cell Physiol. 2001;42:1282–1289. doi: 10.1093/pcp/pce166. [DOI] [PubMed] [Google Scholar]
- 67.Swofford DL. PAUP*, Phylogenetic Analysis Using Parsimony (*and Other Methods), Version 4.0b10. Sinauer Associates; Sunderland, MA: 2003. [Google Scholar]
- 68.Noh YS, Amasino RM. Plant Mol Biol. 1999;41:181–194. doi: 10.1023/a:1006342412688. [DOI] [PubMed] [Google Scholar]