Abstract
We demonstrated a method to accurately measure the zeta potentials and surface charges of individual particles by surface plasmon resonance microscopy (SPRM). The principle is based on the sensitive dependence of surface plasmons in a metal surface on the distance between a particle and the surface. By applying a periodic (ac) electric field to the metal surface, the charged particle oscillates, which is measured with SPRM, from which the zeta potential and the surface charge of the particle can be determined. The ac method reduces the electro-osmotic effect and noises induced by Brownian motions and allows for the rapid determination of the zeta potentials of individual particles.
Particulate matter is a unique form of materials that exists everywhere in nature. It includes inorganic and organic particles and also biological substances, such as cells, bacteria, and viruses, with size ranging from a few tens of nanometers to a few tens of microns. The surface charge density of a particle is a basic quantity that determines the interactions of the particle with a surface and with other particles.1, 2 The most widely used method to measure the surface charge density is electrophoresis.2, 3, 4 While popular, the method is difficult to measure individual particles with different surface charges. A capability of measuring the surface charge of a single particle is important because of the inhomogeneity of particles in most practical settings.
In this work, we report on a method to accurately measure the surface charge of individual small particles with surface plasmon resonance (SPR). SPR is a surface sensitive technique that is widely used to study molecular binding processes onto a surface. Recently, SPR has been used to measure surface charge density5 and to map local surface impedance6 and electrochemical current.7 The basic principle of our single particle surface charge measurement relies on the sensitive dependence of surface plasmon waves propagating along a metal surface on a small particle near the surface. We have found that the SPR signal provides an accurate measurement of the vertical position of the particle. By applying an ac potential to the metal surface, we create an oscillating electric field that drives the particle to move up and down near the metal surface, which is measured with SPR, allowing for accurate determination of the surface charge of the particle. In order to simultaneously measure many particles, we use an objective-based SPR imaging8 setup that can image particles as small as a few tens of nanometers.9
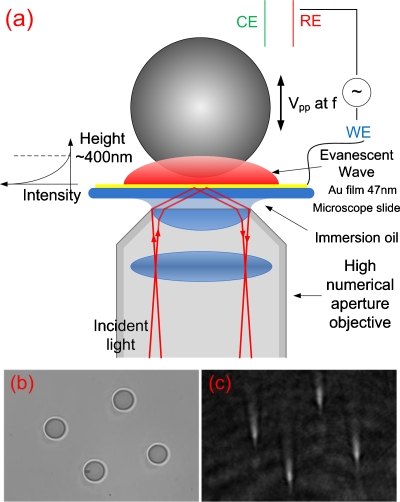
Figure 1a shows a schematic diagram of the setup. The SPR microscope (SPRM) was constructed based on an inverted microscope (Olympus IX81, Center Valley, PA) using a high numerical aperture oil-immersed objective (numerical aperture: 1.49) to achieve high incident angle for surface plasmon excitation.8 A Teflon solution cell was placed on the Au film (47 nm). The electrical potential of the Au film was controlled and modulated with a potentiostat (Pine Instruments, Grove City, PA) using the standard three-electrode electrochemical configuration (with Ag and Pt wires as quasi-reference and counter electrodes, respectively). Silica particles (Bangs Laboratories, Inc., Fishers, IN) of different sizes (4.74, 2.34, and 1.61 μm) were rinsed with de-ionized water five times and then dissolved in 0.5 mM NaF solution before each experiment.
Figure 1.
(a) Schematic diagram of the experimental setup. (b) Transmitted image of small particles near a gold surface. (c) Simultaneously recorded SPR image of the small particles. The particle size is 4.74 μm and the solution is 0.5 mM NaF.
In each experiment, 600 μl of 0.5 mM NaF solution containing 0.05% (by mass) silica particles was introduced into the cell. The particles moved toward the Au film under the influence of gravity but eventually counterbalanced by the electrostatic repulsion between the negatively charged particles and negatively charged Au film, and the equilibrium height of the particles is determined by the surface charges of the particles and Au surface, and size and mass density of the particles.5 Figures 1b, 1c show the transmitted and SPRM images of 4.74 μm silica particles in 0.5 mM NaF solution. Each particle in the SPRM image is a bright spot with a very long tail along the propagation direction of the surface plasmon waves.9
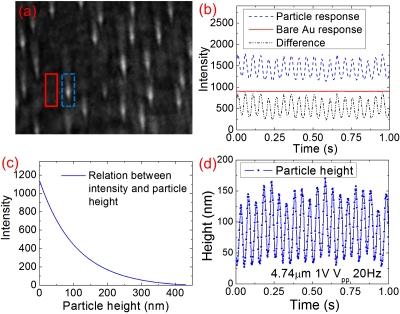
The SPRM image contrast arises from the perturbation of the evanescent wave by the particle. Because the evanescent wave decays rapidly from the Au surface, the image contrast provides a sensitive measurement of the particle height, which is used to determine the surface charge density of small particles with the following procedures. We applied an ac potential modulation to the Au film and recorded the responses of the particles to the modulation electric field with the SPRM. Figure 2a is a snapshot of the SPRM video showing individual silica particles (0.05% 4.74 μm bare silica particles in 0.5 mM NaF, 1 V peak-to-peak, at 20 Hz). Figure 2b shows the SPR responses of a particle and an adjacent bare Au region [marked by rectangles in Fig. 2a]. The SPRM intensity of the particle exhibits a large periodic oscillation due to the change in the particle height as the charged particle is driven toward and away from the Au surface by the ac electric field [Fig. 2b]. The SPR intensity of the bare Au region shows a small but measurable periodic response, which is due to the dependence of SPR on the surface charge density of the Au film.6
Figure 2.
Converting SPR signals to particle height. (a) SPR image of 4.74 μm particles. Two regions of interest, one containing a particle and one showing background bare Au, are marked with a dashed line and solid line rectangles, respectively. (b) SPR response (intensity) of the two regions shown in (a). (c) Relationship between the SPR intensity of a particle and the particle height. (d) Particle height oscillation.
The relationship between SPRM intensity and particle height can be determined numerically and calibrated experimentally.5 As shown in Fig. 2c, the SPRM intensity decays exponentially with the particle height with a decay constant of ∼200 nm, providing sensitive measurement of the particle height. For example, for a particle located 50 nm away from the Au surface, a change of the particle height by 1 nm leads to 0.58% intensity change, which can be accurately measured. Using the relationship between SPRM intensity and particle height, we can transform the oscillating SPRM intensity shown in Fig. 2b into particle height oscillation [Fig. 2d].
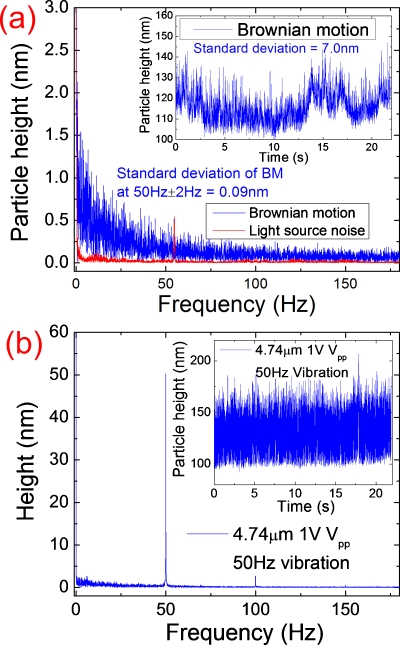
Note that although the oscillating amplitude of the particle height shown in Fig. 2d is uniform, the equilibrium height, due to the Brownian motion, fluctuates. The inset in Fig. 3a shows more clearly the random particle height fluctuations due to the Brownian motion. The standard deviation of the particle height due to the Brownian motion is about 7 nm. The Brownian motion deserves further study on its own right, but it is a source of noise in the single particle charge density measurement. For example, for a particle with equilibrium height of 116 nm [inset in Fig. 3a], the signal-to-noise ratio is limited to ∼17 by the Brownian motion. However, the noise spectrum of the Brownian motion decreases with frequency, so one can reduce the Brownian noise by modulating the potential at high frequencies. Figure 3a shows the fast Fourier transform (FFT) of the Brownian motion of a 4.74 μm particle. At 50 Hz, the standard deviation of the Brownian motion is only 0.09 nm.
Figure 3.
(a) Fourier transforms of particle height variation of a 4.74 μm particle due to Brownian motion. For comparison, the light source noise is also shown. Inset: height variations due to Brownian motion in time domain. (b) Fourier transform of the particle driven into oscillation with an applied potential (1 Vp.p. and 50 Hz), where the sharp peak at 50 Hz is due to the particle height oscillation. The inset shows the particle height oscillation in time domain.
The above noise analysis indicates that ac modulation at high frequencies can significantly reduce the dominant Brownian noise and provides an accurate measurement of particle surface charge density than simple dc methods. The inset in Fig. 3b shows the height response of a 4.74 μm to a 50 Hz ac potential modulation (1 V peak-to-peak sine wave). The FFT of the height response [Fig. 3b] shows a sharp peak at 50 Hz due to the height response to the ac potential modulation. The signal-to-noise ratio is as high as 558, allowing us to determine height variation below 0.1 nm. Note that a small peak appeared near 100 Hz, which is due to the nonlinear response of the particle height to the applied ac electric field.
Since the Debye length of the 0.5 mM solution is small (∼20 nm) compared to particle sizes studied here, the electrophoretic force due to the electric field within the double layer can be ignored. Another important consideration is that the solution impedance (∼17.2 kΩ) is much larger than the interfacial impedance (∼135 Ω) due to the double layer charging effect, so most of the applied voltage drop occurs in the solution rather than at the solid-liquid interface. We will focus on the particle motion caused by the electric field within the solution, which allows us to express the particle velocity in terms of electric field by3, 4, 10
| (1) |
where μ, η, εr, ε0, ξEP, ω, E(t), and E0 are the mobility of particle, dynamic viscosity, dielectric constant of solution, permittivity of free space, zeta potential of particle, angular frequency of the applied electric field, electric field, and amplitude of electric field, respectively. Because the particle moves only vertically, there is no electro-osmotic flow, which simplifies the analysis.
The maximum amplitude of oscillation height is given by
| (2) |
where f is the modulation frequency. The zeta potential of a particle is given by
| (3) |
where E0 can be calculated from E0=imax∕σ, where imax is the maximum current density and σ is the solution conductivity. The zeta potential of a particle can be easily calculated from Eq. 3. For example, at 50 Hz and 1 Vp.p., the particle shown in Fig. 3b has an oscillation amplitude of 52.3 nm at E0=112.9 V∕m. The zeta potential calculated from Eq. 3 is −101.6 mV, which is in excellent agreement with the average zeta potential, −107.2 mV, measured by Zetasizer Nano (Malvern Inc., Malvern, UK). Knowing the zeta potential, the surface charge of the particle can be calculated with the Smoluchowski equation.11 We found that the surface charge of the particle shown in Fig. 3b is −4.1×10⁻¹³ C.
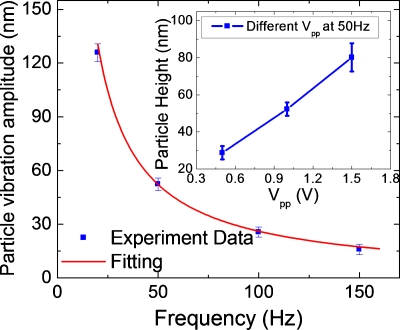
To further confirm the theory described above, we measured the oscillation amplitude of the particle height as a function of frequency and amplitude of the applied potential. The measured amplitude dependence on frequency (solid squares in Fig. 4) is in good agreement with Eq. 2 (solid line). We also plotted the oscillation amplitude as a function of the applied potential (Vp.p., inset in Fig. 4), which shows a linear dependence of the amplitude on the applied potential, also in agreement with the theory.
Figure 4.
Dependence of the particle height oscillation amplitude with frequency measured experimentally (solid squares) and predicted by the theory (solid line). Inset: dependence of particle height oscillation amplitude vs the amplitude of the applied potential (Vp.p.).
In conclusion, we demonstrated an ac method to measure the zeta potentials and surface charges of individual particles by SPRM. The ac method reduces noises due to the Brownian motion, leading to an accurate measurement of the particle zeta potential. Because many particles can be simultaneously measured with the SPRM, the method could be used for high-throughput analysis of the particles.
Acknowledgments
We thank NIH (Grant No. R21RR026235) and NSF (Grant No. CHE-0554786) for the support.
References
- Israelachvili J. N., Intermolecular and Surface Forces (Academic, London, 1991). [Google Scholar]
- Ian S. R. and Morrison D., Colloidal Dispersions: Suspensions, Emulsions, and Foams (Wiley, New York, 2002). [Google Scholar]
- Radko S. P. and Chrambach A., Electrophoresis 23, 1957 (2002). [DOI] [PubMed] [Google Scholar]
- Wiersema P. H., Loeb A. L., and Overbeek J. T., J. Colloid Interface Sci. 22, 78 (1966). 10.1016/0021-9797(66)90069-5 [DOI] [Google Scholar]
- Shan X. N., Huang X. P., Foley K. J., Zhang P. M., Chen K. P., Wang S. P., and Tao N. J., Anal. Chem. 82, 234 (2010). 10.1021/ac901816z [DOI] [PubMed] [Google Scholar]
- Foley K. J., Shan X., and Tao N. J., Anal. Chem. 80, 5146 (2008). 10.1021/ac800361p [DOI] [PubMed] [Google Scholar]
- Shan X. N., Patel U., Wang S. P., Iglesias R., and Tao N. J., Science 327, 1363 (2010). 10.1126/science.1186476 [DOI] [PubMed] [Google Scholar]
- Huang B., Yu F., and Zare R. N., Anal. Chem. 79, 2979 (2007). 10.1021/ac062284x [DOI] [PubMed] [Google Scholar]
- Wang S., Shan X., Patel U., Huang X., Lu J., Li J., and Tao N., Proc. Natl. Acad. Sci. U.S.A. 107, 16028 (2010). 10.1073/pnas.1005264107 [DOI] [PMC free article] [PubMed] [Google Scholar]
- Bruus H., Theoretical Microfluidics (Oxford University Press, New York, 2008). [Google Scholar]
- Sze A., Erickson D., Ren L. Q., and Li D. Q., J. Colloid Interface Sci. 261, 402 (2003). 10.1016/S0021-9797(03)00142-5 [DOI] [PubMed] [Google Scholar]


