Abstract
We report on a resonant waveguide grating imager for high throughput screening using live cells. This imager can generate a snapshot image of all biosensors in a 384-well microtiter plate with a time resolution of ∼3 s and a spatial resolution of 80 μm. This imager is well tolerant to variability in plate configurations and cell confluency. The resonant wavelength and its shifts induced by cell responses at each pixel correlate well with cell confluency. Data filtration protocol can be used to improve assay quality for partially confluent cells.
Resonant waveguide grating (RWG) biosensor is a nanograting waveguide-based optical biosensor that has attracted much interest for cell-based assays in recent years1, 2, 3 because it enables noninvasive, sensitive, and integrative measures of cell signaling based on stimulus-induced dynamic mass redistribution (DMR) in live cells.4, 5, 6, 7, 8, 9, 10, 11 Conventional systems employ a stationary array of fiber optics to repetitively scan a microtiter plate.12 As a result, only cells along the scanning path (∼100 μm in width) are sampled to generate an averaged response.13 This, in turn, not only smooths out certain rapid responses such as cell micromotion and heart cell beating but also could introduce assay variability due to biosensor defects and nonuniform cell confluency.13 Thus, current biosensor cellular assays recommend the use of confluent cell monolayer,3 which could be difficult to achieve for certain cell types (e.g., primary cells and stem cells). To address these issues, we report on a whole microtiter plate RWG imager for high throughput screening (HTS) using live cells.
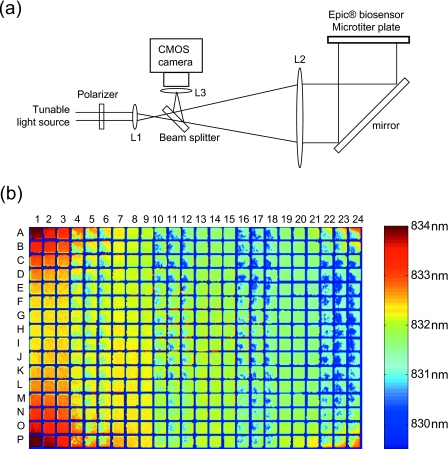
Figure 1a illustrates the schematic of a RWG imager for whole cell sensing. A tunable light source is passed through a polarizer to generate polarized light, which then sequentially passes through a lens L1 and a beam splitter. The split light with a narrow bandwidth is then expanded via another lens L2 and hits on a folding mirror, leading to a reflected light that simultaneously illuminates at a normal incident angle all biosensors within a 384-well Epic® microtiter plate (Corning Inc., Corning, NY). The tunable light source rapidly sweeps the wavelength range such that light at a specific wavelength is coupled into the waveguide and is eventually reflected back via a leaky mode. The central wavelength (i.e., resonant wavelength λr) of the reflected light is tracked and recorded using a 1400×1024 pixel complementary metal-oxide semiconductor (CMOS) camera (Dalsa Inc., Ontario, Canada). Thus, the λr values at all locations are simultaneously collected to generate a pixilated image with a spatial resolution of 80 μm. The λr values before cell stimulation is termed the basal resonant wavelength. The cellular response upon stimulation is monitored in real time as the wavelength shift (in picometer, pm) after all basal λr values are normalized to zero. This imager exhibits low thermal noise (0.18±0.03 pm, n=384) for the whole plate under ambient conditions, comparable or better than conventional systems.
Figure 1.
A RWG imager. (a) The imager consists of three components: a tunable light source to sweep the wavelength range, an array of optical components to guide and expand light path leading to illuminate at a normal incident angle all biosensors within a plate, and a CMOS camera to record the resonant wavelength image. (b) A false-colored λr image of a whole 384 well Epic® biosensor plate having cultured A431 cells.
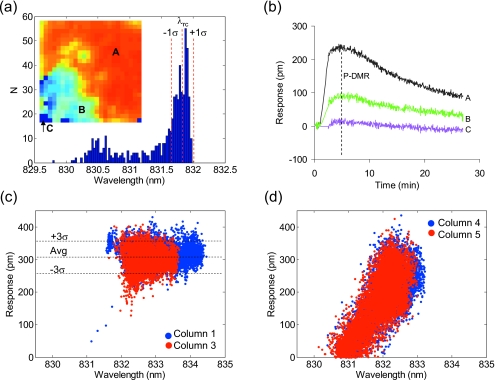
Figure 1b shows a basal λr image of a biosensor plate obtained after overnight culturing of human epidermal carcinoma A431 cells. The initial cell seeding numbers were alternated every three columns. For columns 1–3, 7–9, 13–15, and 19–21, 20 000 cells per well were plated such that after culture the cells form a confluent monolayer. For other columns, 6000 cells per well were seeded to form partially confluent layer. It is obvious from the image that there is significant difference in λr value, which is due to plate configurations and∕or cell confluency. First, the λr value, in overall, gradually decreases from left to right across the plate mostly due to the uneven positioning of the plate relative to the incident light plane. Second, the corner wells seem have higher λr than the central wells mostly due to the difference in cells resulted from different culture environments (commonly known as the edge well effect). Finally, the λr distribution is uniform for the sensors having confluent cells but uneven for others having partially confluent cells. Figure 2a shows an λr image of a biosensor with partial cell coverage [the well 11D in Fig. 1b]. The λr distribution is correlated well with light microscopic image (data not shown) and contains largely one peak centered on a high λr value (λrc) corresponding to pixels having large or continuous patches of cell monolayer, suggesting that the anchorage of cells indeed increases the λr.
Figure 2.
Characterization of the RWG imager. (a) The basal λr image (inset) and distribution of a biosensor having partial cell coverage. The λr values were binned for every 25 pm. (b) The kinetic responses to histamine at 3 pixels [A, B, and C in (a)]. The DMR amplitude is also indicated as P-DMR (positive-DMR). [(c) and (d)] The correlation between the histamine DMR amplitude and its corresponding basal λr value for fully and partially confluent cells, respectively.
To examine the imager performance, the dependence of apparent cellular responses on cell confluency was examined. The cells in columns 1–6 were stimulated with histamine at a fixed dose (5 μM). Histamine is the natural agonist of endogenous Gq-coupled histamine receptor subtype 1 in A431.14 Figure 2b shows the kinetic responses to histamine at three locations, as indicated as A, B, and C in the inset image of Fig. 2a, all within the same biosensor. The A, B, and C pixels have a high, medium, and low λr value, respectively. The cellular response at A is the highest, while at C, there is no any histamine response, suggesting that the apparent histamine response depends on cell confluency. This is expected since the imager has a resolution of 80 μm and thus cannot resolve single cells (∼15 μm). The higher numbers of cells for a given pixel, the greater λr value and cellular response.15
Variability in cell confluency is common to typical HTS campaigns. Thus, we were interested in data filtration methods for improving HTS data quality using the imager. Figures 2c, 2d show the correlation analysis between the histamine response and the basal λr value at each pixel. Results show that for confluent cells the histamine response is mostly insensitive to the λr value—the averaged amplitudes of all pixels within both columns 1 and 3 are identical (309±16 pm) and ∼95% of all responses fall into the 3σ range [Fig. 2c]. This suggests that the imager is well tolerant to the abovementioned variability in biosensor plate configurations, and the use of confluent cells can indeed lead to robust assays. Conversely, for partially confluent cells, the histamine DMR amplitude increases linearly as the λr value increases [Fig. 2d], suggesting that regardless of cell numbers per pixel, the histamine response at single cell level is largely the same. Fitting the λr distribution shown in Fig. 2a with Gaussian led to an λrc value with a standard deviation σ. Calculating the cellular responses at pixels having an λr value within the λrc±1σ range led to an averaged response of 239±16 pm, greater than that of all pixels (201±26 pm). Using the λrc±1σ as a filtration matrix, the histamine response for all wells in columns 4–6 was 235±12 pm (n=48), which is again greater and less variable than that of nonfiltrated data (192±29 pm). Compared to the negative control (i.e., the cellular responses to assay buffer only; 5±9 pm, n=48), the Z′ factor, a common assay robustness measure, was 0.74 and 0.40 for the filtrated and nonfiltrated data, respectively. These results suggest that it is possible to introduce an intrawell filtration method to increase assay robustness when needed.
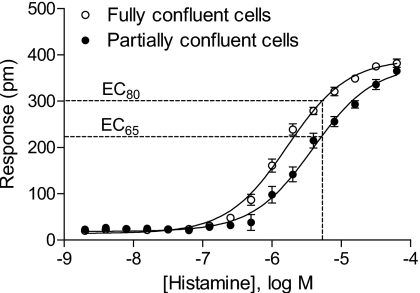
However, the histamine DMR amplitude of the confluent monolayer (309±16 pm) is still significantly higher than that of partially confluent cells after data filtration (239±16 pm). One possibility is the difference in receptor biology (thus ligand pharmacology) for cells with different confluencies. To examine this, the cells in columns 7–12 were stimulated with histamine at 2× dilution series of 16 doses down from 32 μM. Figure 3 shows the dose-dependent histamine responses. Results show that histamine displayed cell confluency dependent potencies, and its EC50 was 1.67±0.32 μM and 3.90±0.43 μM (n=3) for fully and partially confluent cells, respectively. However, the maximum responses were statistically the same. This explains the difference in DMR amplitude of histamine at 5 μM observed in Fig. 2. The histamine of 5 μM equals to its EC80 and EC65 values for fully and partially confluent cells, respectively. These results suggest that although the ligand potency may be somewhat sensitive to cell confluency, the data filtration can be applied to improve screening data quality when the agonist at slightly higher doses (e.g., EC100) is used.
Figure 3.
The relation between the histamine doses and their DMR amplitudes. For fully confluent cells the data are nonfiltrated, while for partially confluent cells, the data were calculated after filtration using the λrc±1σ matrix.
In conclusion, we have developed a RWG imager that enables the simultaneous imaging of all biosensors within a microtiter plate. The imager has moderate spatial resolution (80 μm), high data acquisition rate (∼3 s), and good thermal noise (0.2 pm) under ambient conditions. The imager is well tolerant to artifacts in plate geometry and configurations if any. Given appropriate concentrations of ligands used, a simple data filtration protocol can be used to improve assay robustness when there is variability in cell confluency. Improvements in acquisition rate and spatial resolution will enable label-free imaging-based analysis at single cell level.16 Label-free assays at single cell resolution17 will open next dimensions for studying cell biology, particularly cancer biology and cell reprogramming where heterogeneity in cell populations and cell signaling is critical.
Acknowledgments
This work was supported partially by National Institutes of Health under Grant 5U54MH084691 (Y.F.).
References
- Fang Y., Frutos A. G., and Verklereen R., Comb. Chem. High Throughput Screening 11, 357 (2008). 10.2174/138620708784534789 [DOI] [PubMed] [Google Scholar]
- Kenakin T., Nat. Rev. Drug Discovery 8, 617 (2009). 10.1038/nrd2838 [DOI] [PubMed] [Google Scholar]
- Fang Y., “Label-free receptor assays,” Drug Discovery Today: Technolnologies (in press). [DOI] [PMC free article] [PubMed]
- Fang Y., Li G., and Peng J., FEBS Lett. 579, 6365 (2005). 10.1016/j.febslet.2005.10.019 [DOI] [PubMed] [Google Scholar]
- Fang Y., Ferrie A. M., Fontaine N. H., and Yuen P. K., Anal. Chem. 77, 5720 (2005). 10.1021/ac050887n [DOI] [PubMed] [Google Scholar]
- Fang Y., Ferrie A. M., Fontaine N. H., Mauro J., and Balakrishnan J., Biophys. J. 91, 1925 (2006). 10.1529/biophysj.105.077818 [DOI] [PMC free article] [PubMed] [Google Scholar]
- Fang Y., Li G., and Ferrie A. M., J. Pharmacol. Toxicol. Methods 55, 314 (2007). 10.1016/j.vascn.2006.11.001 [DOI] [PubMed] [Google Scholar]
- Fang Y. and Ferrie A. M., FEBS Lett. 582, 558 (2008). 10.1016/j.febslet.2008.01.021 [DOI] [PubMed] [Google Scholar]
- Kebig A., Kostenis E., Mohr K., and Mohr-Andra M., Recept Signal Transduct 29, 140 (2009). 10.1080/10799890903047437 [DOI] [PubMed] [Google Scholar]
- Henstridge C. M., Balenga N. A. B., Schroder R., Kargl J. K., Platzer W., Martini L., Arthur S., Penman J., Whistler J. L., Kostenis E., Waldhoer M., and Irving A. J., Br. J. Pharmacol. 160, 604 (2010). 10.1111/j.1476-5381.2009.00625.x [DOI] [PMC free article] [PubMed] [Google Scholar]
- Peters M. F., Vaillancourt F., Heroux M., Valiquette M., and Scott C. W., Assay Drug Dev. Technol. 8, 219 (2010). 10.1089/adt.2009.0232 [DOI] [PubMed] [Google Scholar]
- Fang Y., Sensors 7, 2316 (2007). 10.3390/s7102316 [DOI] [PMC free article] [PubMed] [Google Scholar]
- Fang Y., Assay Drug Dev. Technol. 4, 583 (2006). 10.1089/adt.2006.4.583 [DOI] [PubMed] [Google Scholar]
- Tran E. and Fang Y., J. Biomol. Screening 13, 975 (2008). 10.1177/1087057108326141 [DOI] [PubMed] [Google Scholar]
- Ramsden J. J., Li S. Y., Prenosil J. E., and Heinzle E., Cytometry 19, 97 (1995). 10.1002/cyto.990190202 [DOI] [PubMed] [Google Scholar]
- Fang Y., Ferrie A. M., and Wu Q., U.S. Patent Application No. US20090093013A1.
- Yanase Y., Hiragun T., Kaneko S., Gould H. J., Greaves M. W., and Hide M., Biosens. Bioelectron. 26, 674 (2010). 10.1016/j.bios.2010.06.065 [DOI] [PubMed] [Google Scholar]


