Abstract
Myeloperoxidase-derived HOCl targets tissue- and lipoprotein-associated plasmalogens to generate α-chlorinated fatty aldehydes, including 2-chlorohexadecanal. Under physiological conditions, 2-chlorohexadecanal is oxidized to 2-chlorohexadecanoic acid (2-ClHA). This study demonstrates the catabolism of 2-ClHA by ω-oxidation and subsequent β-oxidation from the ω-end. Mass spectrometric analyses revealed that 2-ClHA is ω-oxidized in the presence of liver microsomes with initial ω-hydroxylation of 2-ClHA. Subsequent oxidation steps were examined in a human hepatocellular cell line (HepG2). Three different α-chlorinated dicarboxylic acids, 2-chlorohexadecane-(1,16)-dioic acid, 2-chlorotetradecane-(1,14)-dioic acid, and 2-chloroadipic acid (2-ClAdA), were identified. Levels of 2-chlorohexadecane-(1,16)-dioic acid, 2-chlorotetradecane-(1,14)-dioic acid, and 2-ClAdA produced by HepG2 cells were dependent on the concentration of 2-ClHA and the incubation time. Synthetic stable isotope-labeled 2-ClHA was used to demonstrate a precursor-product relationship between 2-ClHA and the α-chlorinated dicarboxylic acids. We also report the identification of endogenous 2-ClAdA in human and rat urine and elevations in stable isotope-labeled urinary 2-ClAdA in rats subjected to intraperitoneal administration of stable isotope-labeled 2-ClHA. Furthermore, urinary 2-ClAdA and plasma 2-ClHA levels are increased in LPS-treated rats. Taken together, these data show that 2-ClHA is ω-oxidized to generate α-chlorinated dicarboxylic acids, which include α-chloroadipic acid that is excreted in the urine.
Keywords: Fatty Acid Metabolism, Fatty Acid Oxidation, Hepatocyte, Peroxidase, Plasmalogen
Introduction
Myeloperoxidase (MPO)2 is a heme-containing enzyme that is present in neutrophils (1), monocytes (2), and macrophages (3). During phagocyte activation, MPO catalyzes the production of the reactive chlorinating species, HOCl, from hydrogen peroxide and chloride (1, 4). The primary role of MPO is bactericidal as shown by the decreased capacity in microbial killing of neutrophils isolated from MPO-deficient individuals (5–7). However, the oxidizing agents generated by MPO can attack a wide variety of molecules, including lipids, nucleic acids, and proteins in the host tissue. This indiscriminate attack of the host tissue has led to the hypothesis that MPO can play a causal role in the pathology of atherosclerosis and coronary artery disease (8). This is further supported by the fact that expression of human MPO by macrophages in mice can promote atherosclerosis (9). Moreover, it has been shown that human MPO polymorphisms can affect the incidence of coronary artery disease and adverse cardiovascular events in the disease (10, 11).
The masked aldehyde of the plasmalogen phospholipid subclass has been shown to be one of the more reactive targets of HOCl-mediated oxidation. MPO-derived HOCl is a 2-electron oxidant that has been shown to target plasmalogens to generate α-chloro-fatty aldehydes, such as 2-chlorohexadecanal (2-ClHDA) (12, 13). Similarly, eosinophil peroxidase- and lactoperoxidase-derived reactive halogenating species target the vinyl ether bond of plasmalogens liberating α-bromo-fatty aldehydes and α-iodo-fatty aldehydes, respectively (14, 15). Kinetic studies have demonstrated that HOCl reacts with the vinyl ether bond of plasmalogens 200–300 times faster than that with aliphatic alkenes (16). 2-ClHDA accumulates as a result of both neutrophil and monocyte activation and serves as a neutrophil chemoattractant (17, 18). Furthermore, α-chlorinated fatty aldehydes are increased in human atheromas (19) and in infarcted myocardium (20). In the heart, 2-ClHDA elicits contractile dysfunction (20). One potential mechanism that 2-ClHDA may mediate contractile dysfunction is through Schiff-base adduct formation (21). In summary, α-chlorinated fatty aldehydes are produced under pro-inflammatory conditions, and they have potential deleterious biological roles.
Based on the potential importance of the biological properties of α-chlorinated fatty aldehydes, several studies have focused on the metabolism of α-chlorinated fatty aldehydes as a potential mechanism, which is either responsible for clearance of these biologically active compounds or for the production of mediators of the biological properties. These studies have revealed that neutrophils and endothelial cells can oxidize α-chlorinated fatty aldehydes to generate α-chlorinated fatty acids (α-ClFA). α-ClFA is released from both activated neutrophils and 2-ClHDA-treated neutrophils (22, 23), and rat plasma α-ClFA concentration is ∼1 nm (22).
Although previous studies have focused on the metabolism of α-chlorofatty aldehyde, the mechanisms responsible for the metabolism of α-ClFA have not been determined. Because the related halogenated fatty acid, 2-bromopalmitate, is not a substrate for mitochondrial β-oxidation (24), we considered the possibility that α-ClFA is metabolized via ω-oxidation. Under fasting conditions, fatty acid ω-oxidation has been shown to account for ∼5–10% of liver fatty acid catabolism (25). Under metabolic states accompanied by an increase in free fatty acid levels such as obesity or diabetes, an increase in fatty acid ω-oxidation has been noted (26–29). The initial step of fatty acid ω-oxidation is the hydroxylation of the methyl group at the ω-end, which is catalyzed by cytochrome P450 4A family of enzymes (29–32). This is followed by further oxidation at the ω-end to form the 1,ω-dicarboxylic acid in the cytosol (27, 29). Importantly, newly formed dicarboxylic acids can be shortened via β-oxidation and are excreted in urine (29, 33). Accordingly, in these studies, we hypothesized that ω-oxidation of α-ClFA might lead to the production of novel chlorinated metabolites of α-ClFA. Here, we investigate and report that α-ClFA can indeed undergo ω-oxidation to generate α-chlorinated dicarboxylic acids (α-ClDCA). Furthermore, we identify for the first time 2-chloroadipic acid (2-ClAdA) in human and rat urine.
EXPERIMENTAL PROCEDURES
2-Chlorohexadecanoic Acid (2-ClHA) Synthesis
2-ClHA was synthesized and prepared as described previously using hexadecanoic acid as precursor (23). A similar procedure using deuterated hexadecanoic acid, either [d2-4,4]hexadecanoic acid (C/D/N Isotopes, Quebec, Canada) or [d4-7,7,8,8]hexadecanoic acid (Medical Isotopes, Pelham, NH), as the starting material was utilized for synthesis of 2-chloro-[d2-4,4]hexadecanoic acid (2-Cl-[d2-4,4]HA) and 2-chloro-[d4-7,7,8,8]hexadecanoic acid (2-Cl-[d4-7,8]HA), respectively.
Synthesis of 2-ClAdA
2-ClAdA (systematic name 2-chlorohexane-(1,6)-dioic acid) was synthesized from oxidation of 1,2-cyclohexanedione by hydrogen peroxide in the presence of copper(II) chloride dihydrate as described by Starostin et al. (34). It should be noted that 2-ClAdA thus synthesized was used without further purification. Pure 2-ClAdA was synthesized using trichloroisocyanuric acid as follows. A 250-ml round bottom flask was fitted with a J-Kem temperature probe (Teflon-coated) and a magnetic stirring bar, and the apparatus was placed under a positive pressure argon flow atmosphere. The flask was charged with monomethyl adipate (1.00 g; 6.20 mmol) and thionyl chloride (5.0 ml). The reaction mixture was heated to 70 °C for 30 min. At this time, a small sample was removed and analyzed by 1H NMR. Complete conversion to the acid chloride was observed (triplet for CH2α to the carboxylic acid shifts from δ 2.36 for monomethyl adipate to 2.92 for the acid chloride). At this time the reaction mixture was cooled to 21 °C and treated with trichloroisocyanuric acid (1.45 g; 6.20 mmol) and 2 drops of concentrated HCl. This mixture was heated to 78 °C for 45 min. NMR analysis at this time showed complete conversion to the 2-chloro derivative. The mixture was cooled to room temperature, and the thionyl chloride was evaporated. The residue was treated with water (100 ml) and ethyl acetate (100 ml), and the resulting biphasic mixture was stirred vigorously for 1 h to hydrolyze the acid chloride. After this time, the layers were separated, and the aqueous layer was extracted with ethyl acetate (two times). The combined ethyl acetate layers were dried (MgSO4), filtered, and concentrated to afford 899 mg of a white solid. This material was treated with 4 n HCl (50 ml) and stirred at 45 °C for 6 h for hydrolysis of the methyl ester. The reaction was cooled, transferred to a separatory funnel, and extracted with ethyl acetate (three times). The combined ethyl acetate layers were dried (MgSO4), filtered, and concentrated to afford 461 mg of a white solid. This material was precipitated from ethyl acetate with hexanes to afford 182 mg (16% yield) of 2-chloroadipic acid as a white solid: 1H NMR (300 MHz, CDCl3), δ 4.46 (ABq, J = 5.7 and 7.8 Hz, 1 H), 2.24 (t, J = 7.5 Hz, 2 H), 1.73–1.99 (complex m, 2H), 1.42–1.65 (complex m, 2 H); and 13C NMR (75 MHz, CDCl3) δ 174.6 (s), 171.0 (s), 58.6 (d), 34.2 (t), 32.6 (t), 21.9 (t).
Microsomal Incubation with 2-ClHA
Microsome isolation from rabbit liver and incubation with 2-ClHA was performed as described by Komen et al. (35) with minor modifications. Briefly, the reactions were carried out in 0.2 ml of phosphate-buffered saline (PBS) (pH 7.4) containing 1 mg/ml microsomal protein, 200 μm 2-ClHA (added in 1 μl ethanol) either in the presence or absence of 1 mm β-NADPH. The incubations were carried out in a shaking water bath at 37 °C for 25 min. At the end of the incubation period, 0.8 ml of PBS and 0.2 ml of 6 n HCl were added to terminate the reaction. The reaction products were extracted twice with 6 ml of ethyl acetate/diethyl ether (1:1, v/v). The combined organic extracts were dried down, resuspended in methanol, and analyzed either by direct infusion-electrospray ionization-tandem mass spectrometry (ESI-MS/MS) or by reversed and solid phase high pressure liquid chromatography coupled to electrospray ionization-tandem mass spectrometry (LC-MS/MS). These techniques are described below.
2-ClHA Incubation with HepG2 Cell Line
HepG2 cells (ATCC) were maintained according to ATCC protocol. The cells were obtained at passage 77 and were used between passages 79 and 90 after plating them on 35-mm cell culture plates. The cells were incubated with 2-ClHA (0, 1, 10, 25, and 50 μm) for 2-, 4-, 8-, and 24-h time points in the presence of 2% fetal bovine serum. At the end of the incubation period, the medium was collected following centrifugation at 1000 rpm for 5 min to remove any floating cells and stored at −20 °C. HepG2 cells were scraped twice in 0.5 ml of PBS and stored at −20 °C. Cells were thawed and sonicated to obtain a homogenate before extraction.
Analysis of α-ClDCA from Cell Culture Experiments
Varying concentrations of d4-sebacic acid (0.25–50 ng) in 5–10 μl of methanol was added to either 0.8 ml of media or 0.5 ml of cellular homogenate as internal standard. The final volume of cellular homogenate was brought to 0.8 ml using water. This was followed by addition of 0.2 ml of 6 n HCl and 6 ml of ethyl acetate/diethyl ether (1:1, v/v). The aqueous and the organic phases were separated by centrifugation at 500 × g. The organic phase was collected, and extraction was repeated. The combined organic extracts were dried, and carboxylic acids were derivatized to their pentafluorobenzyl (PFB) esters utilizing PFB-Br (Sigma) as described previously (36). Briefly, extracts were resuspended in 100 μl of PFB-Br (7.5% PFB-Br in acetone) and 20 μl of di-isopropylethylamine. Reactions were for 1 h at 45 °C. Reactions were terminated by evaporating reagent under nitrogen, and the derivatives were subsequently resuspended in ethyl acetate. One microliter of the reaction product (PFB derivatives) was injected onto a DB-1 capillary column (12.0 m, 0.22 mm inner diameter, 0.33-μm methyl silicone film coating; P. J. Cobert, St. Louis, MO) and subjected to GC-MS analyses using a Hewlett-Packard 6890 gas chromatograph and Hewlett-Packard 5973 mass spectrometer. The derivatives were analyzed in the negative ion chemical ionization (NICI) mode using methane as the chemical ionization gas. The inlet temperature was at 250 °C. The GC oven was initially held at 150 °C for 3.5 min, then ramped at 25 °C/min to 280 °C, followed by 5 °C/min to 310 °C. The final temperature was held for 1 min. The transfer lines were kept at 280 °C. Spectra were acquired either in the scan mode from m/z 100 to 800 or by selected ion monitoring (SIM) of the [M − 181]− ion. The ions used for SIM of the PFB derivatives of dicarboxylic acids are given in Table 1. The ion chromatograms were integrated using the Chemstation software. The ratio of the integrated area of different α-ClDCA and the internal standard was taken. This value was normalized to cellular protein. Cellular protein was measured using the reagent assay (Bio-Rad) from the cellular homogenate. This value was further divided by a similar value obtained when cells were incubated in the absence of 2-ClHA for the same time points and plotted to depict the fold change in amount of respective α-ClDCA.
TABLE 1.
Ions utilized for SIM by GC-MS or transitions utilized for SRM by LC-MS/MS for identification of different compounds
| Compound | GC-MS (SIM) | ESI-MS/MS (SRM) |
|---|---|---|
| 2-ClHA | 289 → 253/291→ 253 | |
| 2-Cl-[d4]HA | 293 → 257/295 → 257 | |
| 2-Cl-[d2]HA | 291 → 255/293 → 255 | |
| ω-Hydroxy-2-ClHA | 305 → 269/307 → 269 | |
| [d4]Sebacic acid | 385 | |
| [d4]Adipic acid | 329 | |
| 2-ClHDDA | 499/501 | |
| 2-Cl-[d2]HDDA | 501/503 | |
| 2-ClTDDA | 471/473 | |
| 2-Cl-[d2]TDDA | 473/475 | |
| 2-ClAdA | 359/361 | 179 → 143/181 → 143 |
| 2-Cl-[d2]AdA | 361/363 | 181 → 145/183 → 145 |
Response Curve and Analysis of 2-ClAdA in Urine
Human urine was collected as authorized by Saint Louis University Institutional Review Board Protocol 16846. 10 ng of [d4-3,3,4,4]adipic acid ([d4]AdA) and varying amounts (0–10 ng) of synthetic 2-ClAdA were added to either 50 or 100 μl of rat or human urine prior to extraction. In brief, 0.7 ml of water and 0.2 ml of 6 n HCl were added to 100 μl of urine (or 50 μl of urine and 50 μl of water). The sample was extracted twice with 6 ml of 1:1 ethyl acetate/diethyl ether. Samples were evaporated under nitrogen and resuspended in water containing 5 mm ammonium acetate and 0.25% acetic acid. 2-ClAdA was subsequently quantified using LC-MS (see below) by comparisons of peak area to that of the internal standard, [d4]AdA, and the use of response curves. The amount of urinary 2-ClAdA was then normalized to urinary creatinine levels.
In Vivo Metabolism of 2-ClHA
Rats were injected (intraperitoneally) with 0.9 mg of 2-Cl-[d2-4,4]HA per 100 g of body weight to determine a precursor-product relationship between 2-ClHA and 2-ClAdA in vivo. Over a 3-day period, both plasma and urine (in metabolic cages) were collected. Additionally, plasma and urine were collected from rats that were treated with lipopolysaccharide (LPS, 0.1–1 mg/kg body weight, intraperitoneal). Urinary dicarboxylic acids were extracted as described above, and plasma 2-ClHA was extracted using a modified Folch extraction following treatments with and without base hydrolysis to determine esterified and nonesterified (free) fatty acids, respectively (37). For analysis of 2-ClHA from plasma, 10 μl of plasma was extracted in the presence of 2-Cl-[d4-7,8]HA, and extracts were subsequently dried under nitrogen and resuspended in 125 μl of methanol/water (85:15, v/v) containing 0.1% formic acid. 2-ClHA was subsequently quantified by LC-MS as described below.
ESI-MS/MS and LC-MS/MS
For LC-MS/MS analysis of 2-ClHA, a Bligh and Dyer (38) extraction of 100 μl of either cell homogenate or cell culture medium, after addition of 2-Cl-[d4-7,8]HA as the internal standard, was performed. The organic extracts were resuspended in methanol/water (85:15, v/v) containing 0.1% formic acid and separated on a reversed and solid phase HPLC column from Supelco (Discovery HS C18, 150 × 2.1 mm, 5 μm) utilizing a Thermo Fisher Surveyor micro-LC system with a Thermo Fisher Quantum Ultra electrospray ionization mass spectrometer used as a detector. For LC, mobile phase A was 85:15 methanol/water with 5 mm ammonium acetate and 0.25% acetic acid and mobile phase B was methanol with 5 mm ammonium acetate and 0.25% acetic acid. The following gradient was used: 0–3 min 100% A, 3–10 min 100% A to 100% B, 10–20 min 100% B followed by re-equilibration in 100% A at a flow rate of 200 μl/min. Selected reaction monitorings (SRM) in the negative ion mode of m/z 289 → 253 and m/z 291 → 253 for natural 2-35ClHA and 2-37ClHA, respectively, and m/z 293 → 257 and m/z 295 → 257 for the stable isotope-labeled internal standard, 2-35Cl-[d4-7,8]HA and 2-37Cl-[d4-7,8]HA, respectively, were performed as described earlier (23). Additionally, m/z 291→255 and m/z 293→255 for the stable isotope-labeled 2-35Cl-[d2-4,4]HA and 2-37Cl- [d2-4,4]HA was used. For electrospray ionization MS, the ionization energy and temperature were 3700 V and 310 °C, respectively. Collision energy was between 13 and 20 V, and 1.5 millitorr argon was used as the collision gas. The ratio of the integrated area of the internal standard for the chromatography peak was compared with that of the natural compound to determine its amount. The chromatographic peaks were integrated using Xcalibur software. The transitions for the 37Cl isotope of both the natural and the deuterium-labeled internal standard were monitored but not used for quantitative determination.
LC-MS/MS of 2-ClAdA was performed using the modified method described by Kakola and Alen (39). Briefly, LC-MS/MS was done utilizing a double-bonded column (Supelcosil LC-18 DB 150 × 3 mm, 5 μm). The mobile phases were as follows: A, water containing 5 mm ammonium acetate and 0.25% acetic acid; B, methanol containing 5 mm ammonium acetate and 0.25% acetic acid. Gradient elution was performed at 200 μl/min as follows: 0–7.5 min 100% A to 90% A, 7.5–30 min 90% A to 20% A, 30–34 min 20% A to 0% A, 34–37 min 0% A, 37–42 min 0% A to 100% A, and 42–55 min 100% A for re-equilibration. For indicated analyses, and for urinary 2-ClAdA analyses, an alternative eluting gradient (2-ClAdA Gradient 2) was applied. 2-ClAdA gradient 2 was performed at 300 μl/min as follows: 0–4 min 100% A to 90% A, 4–12 min 90% A to 20% A, 12–18 min 20% A to 0% A, 18–23 min 0% A, 23–24 min 0% A to 100% A, and 24–35 min 100% A for re-equilibration. For both elution gradients, the transitions from m/z 179 → 143 for 2-35ClAdA and m/z 181 → 143 for 2-37ClAdA were monitored in the negative ion mode. For stable isotope-labeled 2-ClAdA, the following SRMs were used: m/z 181 → 145 for 2-35Cl-[d2-4,4]AdA and m/z 183→145 for 2-37Cl-[d2-4,4]AdA. The transition and the retention times were obtained by comparing with synthetic 2-ClAdA. The SRM for the internal standard, d4-AdA, was 149→105. The ionization voltage was 3500 V, and the ionization temperature was 310 °C. For MS/MS, the collision energy was 18 V, and 1.5 millitorr argon was used as the collision gas.
For some analyses, as indicated, ESI-MS/MS was also performed on analytes in methanol. Direct infusion was performed at 3–5 μl/min and analyzed in the negative ion mode. The spectra were averaged over a period of 3–5 min.
RESULTS
ω-Oxidation of 2-ClHA
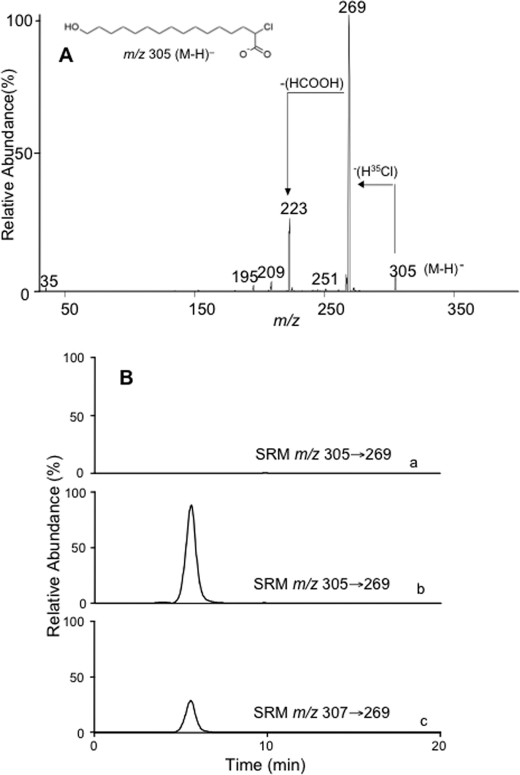
The first step in ω-oxidation of fatty acids is catalyzed by cytochrome P450 4A family of enzymes leading to the formation of an ω-hydroxylated fatty acid (30) and requires the presence of reducing equivalents from β-NADPH (32). We investigated this initial ω-hydroxylation step to test whether 2-ClHA can be ω-oxidized. Purified rat liver microsomes were incubated with 2-ClHA in either the presence or absence of β-NADPH. The reaction products were then subjected to direct infusion electrospray ionization mass spectrometry. A negative ion at m/z 305, observed in the presence of β-NADPH, was putatively identified as the pseudo molecular ion [M − H]− ion of ω-hydroxy-2-35ClHA. This ion was further examined by tandem mass spectrometry, and the spectrum obtained is shown in Fig. 1A. The spectrum depicts a prominent loss of H35Cl from the [M − H]− ion. A similar facile loss of HCl has been described previously for 2-ClHA (23). A further loss of 46 mass units was observed from the [M − H-HCl]− ion. This neutral loss has been studied previously and described for saturated ω-hydroxy fatty acids as the loss of HCOOH (40). The tandem mass spectra of m/z 307 (from the [M − H]− ion of ω-hydroxy-2-37ClHA) also showed the losses of H37Cl and HCOOH along with other ions generated from isobaric compounds at m/z 307 (supplemental Fig. 1). In subsequent LC-MS/MS analyses, reaction products were separated by RP-HPLC and monitored for the loss of HCl from the parent ions utilizing the SRM m/z 305 → 269 and m/z 307 → 269 for ω-hydroxy-2-35ClHA and ω-hydroxy-2-37ClHA, respectively. The chromatograms obtained (Fig. 1B) identified ω-hydroxy-2-ClHA at a retention time of 5.6 min, with the presence of both ω-hydroxy-2-35ClHA (Fig. 1B, trace b) and ω-hydroxy-2-37ClHA (Fig. 1B, trace c) in a 3:1 ratio. Furthermore, because β-NADPH provides the reducing equivalents for the cytochrome P450 4A-mediated oxidation, microsomal incubation with 2-ClHA in the absence of β-NADPH does not generate ω-hydroxy-2-ClHA (Fig. 1B, trace a).
FIGURE 1.
Identification of ω-hydroxy-2-ClHA. 2-ClHA was incubated with liver microsomes for 25 min at 37 °C in the presence or absence of β-NADPH, and reaction products were prepared for analyses as described under “Experimental Procedures.” Product ion spectra of [M − H]− ion of ω-hydroxy-2-35ClHA (m/z 305) obtained by ESI-MS/MS is shown in A. A also shows the prominent neutral losses (marked by arrows) of a putative structure (inset) that is consistent with the starting material (2-ClHA) and the mass spectra. The reaction products were also analyzed by LC-MS/MS (B) as described under “Experimental Procedures.” SRM detection of m/z 305 → 269 for reaction products from incubations in the absence of β-NADPH are shown in trace a. SRM detection of m/z 305 → 269 and m/z 307 → 269 (for ω-hydroxy 2-37ClHA) in the presence of β-NADPH are shown in trace b and c, respectively. In each trace in B, 100% relative abundance was set to equal ion counts.
Identification of 2-ClHDDA
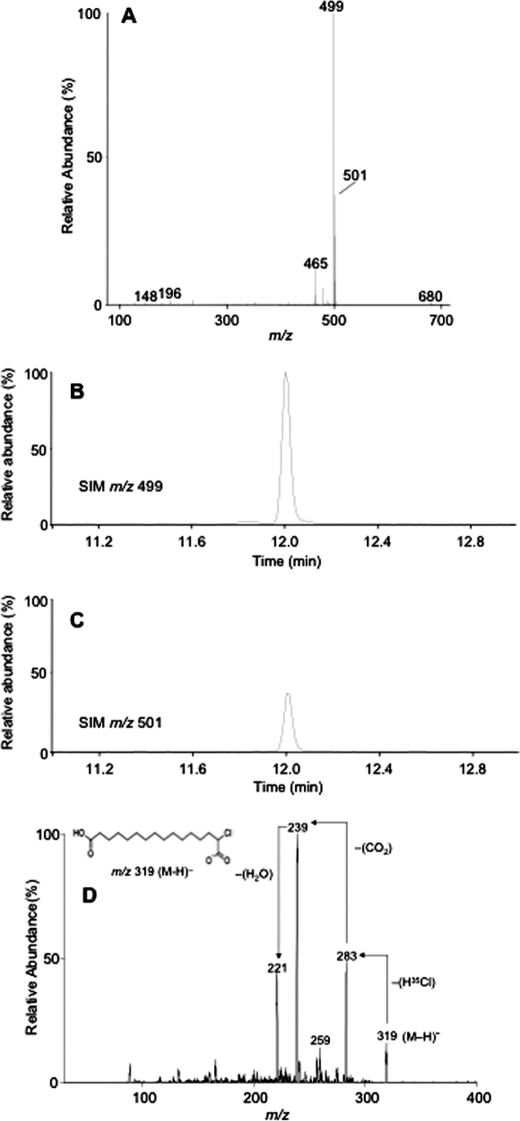
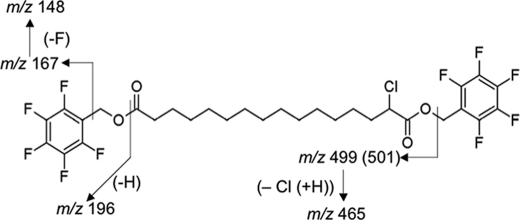
Having shown that 2-ClHA can be ω-hydroxylated, we tested whether the next step of ω-oxidation, which is a two-step conversion of ω-hydroxy-2-ClHA to 2-chlorohexadecane-(1,16)-dioic acid (2-ClHDDA), occurs. The human hepatocellular carcinoma cell line, HepG2, which has a basal level of cytochrome P450 activity (41), was used for these studies. We incubated HepG2 cells with 50 μm 2-ClHA for 24 h. This concentration of 2-ClHA is not toxic for HepG2 cells as determined by lactate dehydrogenase (LDH) release (supplemental Fig. 2). At the end of the incubation period, media extracts were derivatized with PFB-Br and analyzed by GC-MS using NICI. The mass spectrum of a peak having a retention time of 12 min is shown in Fig. 2A. The molecular ion of the di-PFB ester of 2-35ClHDDA is seen at m/z 680, whereas that of the di-PFB ester of 2-37ClHDDA is at m/z 682. The spectrum also shows a fragment ion, [M − 181]−, at m/z 499 as the base peak. The base peak is from the loss of a single PFB moiety from either end of the di-PFB ester derivative (Scheme 1). This ion has previously been utilized for quantification of di-PFB esters of dicarboxylic acids in SIM mode (36). A corresponding ion arising from the 37Cl containing isotopic molecular ion is also seen at m/z 501, which is present at approximately one-third the intensity of m/z 499 (Fig. 2A). An ion observed at m/z 465 results from the additional loss of chlorine ([M − 181 + H-Cl]−) from the [M − 181]− ion (Scheme 1). Ions characteristic of the PFB group are also observed at m/z 196, 167, and 148 (Fig. 2A and Scheme 1) (42). Taken together, the mass spectrum shown in Fig. 2A is consistent with the structure of the di-PFB ester of 2-ClHDDA. It should be noted that the peak yielding the spectrum observed in Fig. 2A was not observed in derivatized samples of media from HepG2 cells that were not treated with 2-ClHA (data not shown). Fig. 2, B and C, depicts the SIM chromatogram of m/z 499 and m/z 501, respectively. The chromatograms show a peak at 12 min and are at an ∼3:1 ratio, as would be predicted for a monochlorinated compound. To confirm the identity of 2-ClHDDA, the underivatized organic extracts were analyzed by ESI-MS/MS. The tandem mass spectrum of a negative ion observed at m/z 319 shows the loss of H35Cl and subsequent losses of CO2 and H2O (Fig. 2D). An earlier study on the fragmentation of monoanions of dicarboxylic acids using ESI-MS/MS has described similar losses of CO2 and H2O (43). The mass spectrum of the corresponding 37Cl containing isotopic ion at m/z 321 shows similar fragmentation (data not shown). Taken together, these data suggest that 2-ClHA can be ω-oxidized by HepG2 cells to generate 2-ClHDDA.
FIGURE 2.
Identification of 2-ClHDDA. HepG2 cells were incubated with 50 μm 2-ClHA for 24 h. At the end of the incubation period, media were extracted and analyzed by either GC-MS in the NICI mode following PFB derivatization (A–C) or by ESI-MS/MS of the underivatized extract (D). The mass spectrum of a peak obtained at 12 min, corresponding to the di-PFB ester of 2-ClHDDA, is depicted (A). The chromatograms obtained using SIM of m/z 499 (B) and m/z 501 (C) within a window of 11–12.2 min are shown. B and C, 100% relative abundances were set to equal ion counts. D shows the product-ion spectra of [M − H]− ion of 2-35ClHDDA. The prominent neutral losses (marked by arrows) of the proposed structure of the [M − H]− ion (inset) that is consistent with the starting material and the mass spectra are also shown.
SCHEME 1.
Proposed fragmentation ions of the di-PFB ester of 2-ClHDDA.
Identification of Additional α-Chlorodicarboxylic Acids
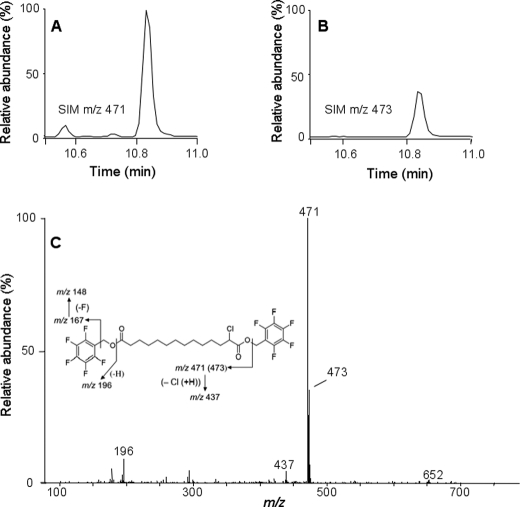
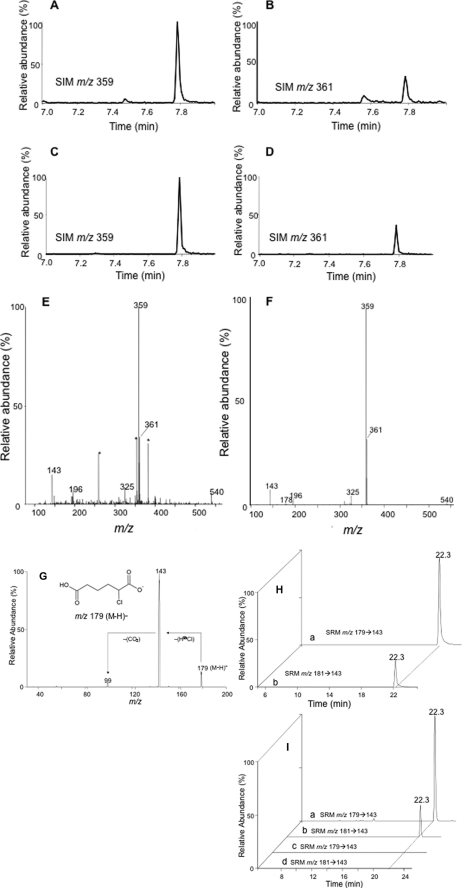
Others have previously shown β-oxidation from the ω-end of dicarboxylic acids (29, 33, 44). Accordingly, having confirmed that 2-ClHA undergoes ω-oxidation, we predicted that 2-ClHDDA is further oxidized by sequential β-oxidation from the ω-end. 2-Chlorotetradecane-(1,14)-dioic acid (2-ClTDDA) was identified in the media from HepG2 cells incubated with 50 μm 2-ClHA for 24 h. Fig. 3, A and B, shows the SIM chromatographic peaks at 10.8 min of the [M − 181]− ion at m/z 471 and m/z 473 of the di-PFB ester of 2-ClTDDA. The mass spectrum of the di-PFB ester of 2-ClTDDA is shown in Fig. 3C. Similar to 2-ClHDDA, the molecular ion peak at m/z 652 and the fragment ions provide evidence for the di-PFB ester of 2-ClTDDA (Fig. 3C, inset). The identification of 2-ClTDDA indicated that 2-ClAdA may be generated by sequential β-oxidation from the ω-end. Further analysis of the di-PFB esters of dicarboxylic acids produced by HepG2 cells incubated with 50 μm 2-ClHA using GC-MS revealed a peak having a retention time of ∼7.75 min that was identified as the di-PFB ester of 2-ClAdA. The SIM chromatograms utilizing the [M − 181]− fragment ion of the di-PFB ester of 2-35ClAdA and 2-37ClAdA, i.e. m/z 359 (Fig. 4A) and m/z 361 (Fig. 4B), are shown. The corresponding mass spectrum of the peak at 7.75 min is shown in Fig. 4E. Comparisons of these SIM chromatograms and the mass spectra of the peak at 7.75 min acquired from analyses of HepG2 media treated with ClHA are nearly identical to those acquired from analyses with authentic synthetic 2-ClAdA (Fig. 4, C, D and F). Scheme 2 depicts the proposed fragmentation pathway of the [M − 181]−, [M − 181 + H-Cl]−, and [M − 2(181) − Cl]− fragment ions at m/z 359, m/z 325, and m/z 143, respectively. Taken together, data shown in Figs. 2–4 from GC-MS experiments indicated that 2-ClHA is metabolized to produce a series of α-ClDCA.
FIGURE 3.
Identification of 2-ClTDDA. HepG2 cells were incubated with 50 μm 2-ClHA for 24 h. At the end of the incubation period, media were extracted, derivatized by PFB-Br, and analyzed by GC-MS in the NICI mode. The mass spectrum of 2-ClTDDA (C) and the chromatograms obtained utilizing SIM of m/z 471 (A) and m/z 473 (B) are shown. A and B, 100% relative abundances were set to equal ion counts.
FIGURE 4.
Identification of 2-ClAdA. Media extracts from HepG2 cells incubated with 50 μm 2-ClHA were analyzed for 2-ClAdA by either GC-MS, ESI-MS/MS, or LC-MS/MS as outlined under “Experimental Procedures.” The mass spectrum (E and F) and SIM chromatograms for m/z 359 (A and C) and m/z 361 (B and D) of the di-PFB ester of 2-ClAdA from media extracts (A, B, and E) and synthetic 2-ClAdA (C, D, and F) is shown. Asterisk is used to show peaks not attributed to 2-ClAdA. A and B, 100% relative abundances were set to equal ion counts. Similarly, in C and D, 100% relative abundances were set to equal ion counts. The ESI-MS/MS spectrum of synthetic 2-ClAdA (G) depicting the [M − H]− ion (inset) and the prominent neutral losses (marked by arrows) is also shown. Synthetic 2-ClAdA (H, trace a and b, with each trace with 100% relative abundances set to equal ion counts) and the underivatized media extracts (I, trace a–d, with each trace with 100% relative abundances set to equal ion counts) of HepG2 cells incubated in the presence (trace a and b) and in the absence (trace c and d) of 2-ClHA were also analyzed by LC-MS/MS using SRM 179 → 143 and 181 → 143 as indicated.
SCHEME 2.
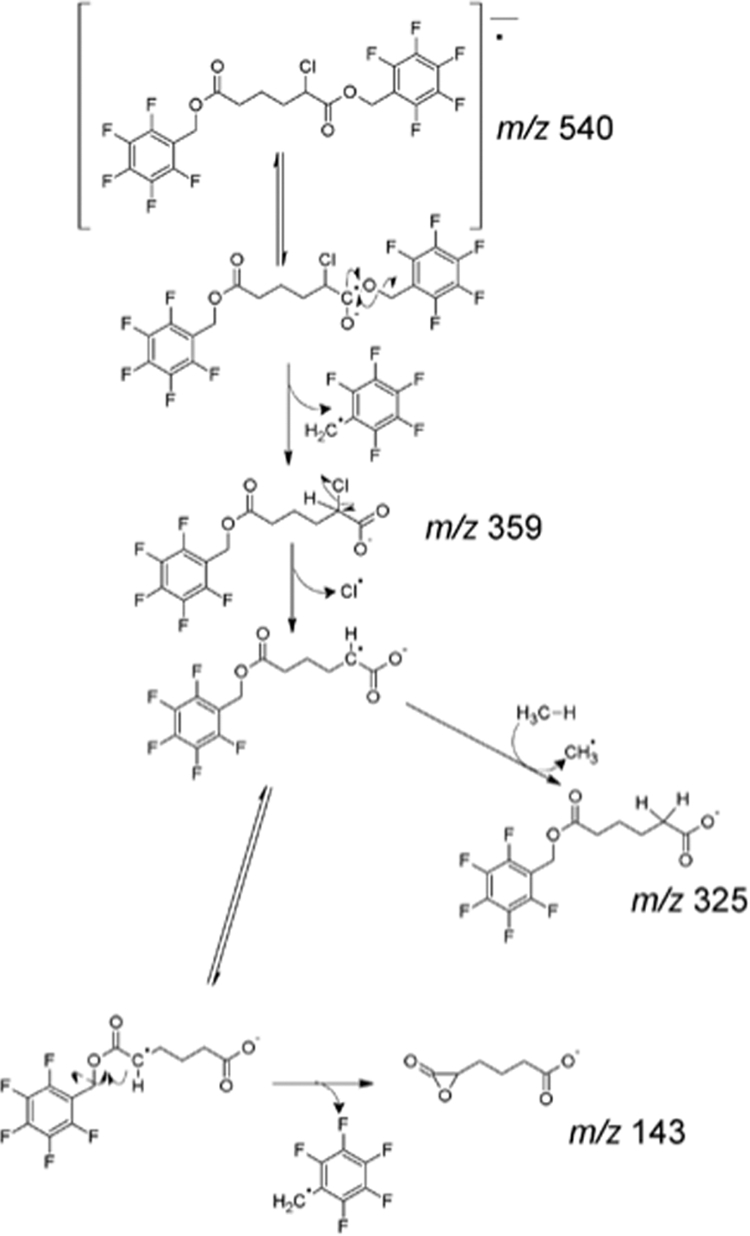
Proposed fragmentation pathway of the di-PFB ester of 2-ClAdA.
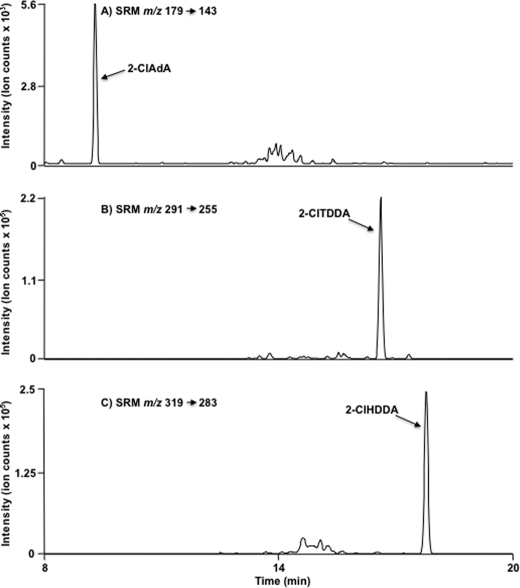
2-ClAdA production by HepG2 cells treated with 2-ClHA was further verified by an independent LC-MS method. Using direct infusion electrospray ionization mass spectrometry, collisionally activated dissociation of the negative ion of authentic, synthetic 2-ClAdA (m/z 179) revealed the facile loss of HCl resulting in a product ion m/z 143 (Fig. 4G). Based on the collisionally activated dissociation data, LC-MS was used with detection of 2-35ClAdA and 2-37ClAdA using SRM m/z 179 → 143 and m/z 181 → 143, respectively (Fig. 4, H and I). The media from cells treated with 50 μm 2-ClHA (Fig. 4I, trace a and b) and the standard (Fig. 4H, trace a and b) were analyzed by LC-MS utilizing the SRM m/z 179 → 143 (Fig. 4, H, trace a, and I, traces a and c) and m/z 181 → 143 (Fig. 4, H, trace b, and I, traces b and d). The chromatographs depicted show identical retention times for the standard and the putative 2-ClAdA in media. Furthermore, 2-ClAdA was only detected in cell media extracts from HepG2 cells that were treated with 2-ClHA, i.e. 2-ClAdA was not observed in HepG2 cells that were not exposed to 2-ClHA (Fig. 4I, traces c and d). Fig. 5 shows the SRM chromatograms for 2-ClAdA, 2-ClTDDA, and 2-ClHDDA from cell culture media of HepG2 cells treated 24 h with 2-ClHA. For this analysis, a sharper gradient (i.e. 2-ClAdA gradient 2) was employed in comparison with that used in the data shown in Fig. 4H. Data shown in Fig. 5 illustrate the relative amount of the α-ClDCA produced under these conditions. These data indicate that under these conditions 2-ClHDDA is the most predominant α-ClDCA compared with 2-ClTDDA and 2-ClAdA. Taken together, these two independent methods (GC-MS and LC-MS) provide strong evidence that HepG2 cells metabolize 2-ClHA to 2-ClAdA.
FIGURE 5.
LC-MS SRM of α-chlorodicarboxylic acid metabolites of 2-ClHA. HepG2 cells were incubated with 10 μm 2-ClHA for 24 h. Media were extracted and α-ClDCA was subjected to LC-MS using 2-ClAdA gradient 2 as mobile phase as described under “Experimental Procedures.” Molecular species were detected by indicated SRM transitions as depicted in A–C for 2-ClAdA, 2-ClTDDA, and 2-ClHDDA, respectively.
Incubation with Stable Isotope-labeled 2-ClHA
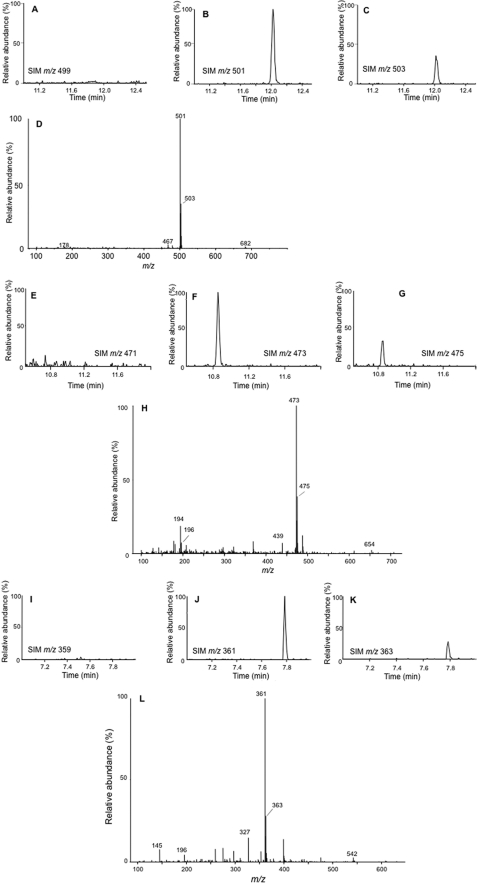
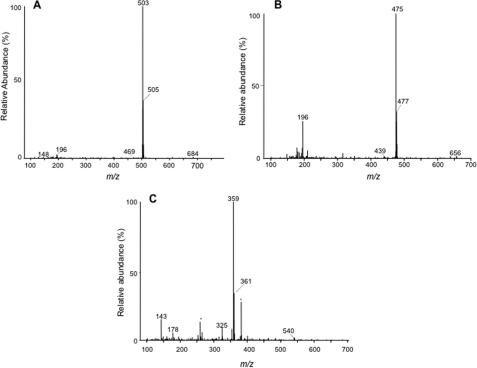
To further confirm that the α-ClDCA are catabolites of 2-ClHA, we synthesized and incubated 50 μm 2-Cl-[d2-4,4]HA with HepG2 cells for 24 h and monitored the m + 2 mass shift in α-ClDCA species. The di-PFB ester derivatives of media extracts were analyzed by GC-MS. Fig. 6 shows the chromatograms generated by SIM of the [M − 181]− fragment ion at m/z 499, 501, and 503 for 2-ClHDDA, 2-35Cl-[d2]HDDA, and 2-37Cl-[d2]HDDA, respectively (Fig. 6, A–C); m/z 471, 473, and 475 for 2-ClTDDA, 2-35Cl-[d2]TDDA, and 2-37Cl-[d2]TDDA, respectively (Fig. 6, E–G); and m/z 359, 361, and 363 for 2-ClAdA, 2-35Cl-[d2]AdA, and 2-37Cl-[d2]AdA, respectively (Fig. 6, I–K). For the di-PFB ester of 2-ClHDDA, the chlorine isotopic peaks, which were originally observed at m/z 499 and m/z 501 (Fig. 2, A–C), are now shifted by 2 mass units and visualized at m/z 501 and m/z 503 (Fig. 6, A–C). Moreover, the retention time is unchanged. Similarly, for the di-PFB esters of 2-ClTDDA and 2-ClAdA, the chlorine isotopic peaks are shifted and observed at m/z 473 and m/z 475 (Fig. 6, E–G) and at m/z 361 and m/z 363 (Fig. 6, I–K), respectively, at a ratio of 3:1. The mass spectrum of di-PFB esters of 2-Cl-HDDA (Fig. 6D), 2-Cl-TDDA (Fig. 6H), and 2-Cl-AdA (Fig. 6L) also depict corresponding 2 mass unit shifts in the molecular ion and the [M − 181 + H-Cl]− ion. The appearance of deuterated 2-ClAdA from 2-Cl-[d2-4,4]HA indicates β-oxidation occurs from the ω-end. Further support for 2-ClHA oxidation from the ω-end is provided from experiments with HepG2 cells incubated with 2-Cl-[d4-7,8]HA. The mass spectra of 2-ClHDDA and 2-ClTDDA PFB derivatives shown in Fig. 7 reveal the predicted shift by 4 mass units reflecting the addition of four deuteriums in the precursor 2-ClHA. However, the mass spectrum of 2-ClAdA did not indicate the presence of deuterium (Fig. 7C). Note that although β-oxidation from the ω-end of 2-Cl-[d2-4,4]HA would still contain deuterium, the same oxidation mechanism of 2-Cl-[d4-7,8]HA should not be enriched with stable isotope. Taken together, these data confirm the direct precursor-product relationship between 2-ClHA and α-ClDCA and suggest sequential ω-oxidation followed by β-oxidation from the ω-end.
FIGURE 6.
α-Chlorodicarboxylic acid catabolites of 2-chloro-[d2-4,4]hexadecanoic acid. HepG2 cells were incubated with 50 μm 2-Cl-[d2-4,4]HA for 24 h. At the end of the incubation period, media were extracted, derivatized by PFB-Br, and analyzed by GC-MS. The SIM chromatograms (A–C, E–G, and I–K) and the mass spectrum (D, H, and L) of the di-PFB esters of 2-ClHDDA (A–D), 2-ClTDDA (E–H), and 2-ClAdA (I–L) are shown. The SIM used for 2-ClHDDA are m/z 499 (A), m/z 501 (B), and m/z 503 (C). The SIM used for 2-ClTDDA are m/z 471 (E), m/z 473 (F), and m/z 475 (G). The SIM used for 2-ClAdA are m/z 359 (I), m/z 361 (J), and m/z 363 (K). A–C, 100% relative abundances were set to equal ion counts. Similarly, in D--F and I–K, 100% relative abundances were set to equal ion counts.
FIGURE 7.
α-Chlorodicarboxylic acid catabolites of 2-chloro-[d4-7,7,8,8]hexadecanoic acid. HepG2 cells were incubated with 50 μm 2-Cl-[d4-7,7,8,8]HA for 24 h. At the end of the incubation period, media were extracted, derivatized by PFB-Br, and analyzed by GC-MS. The mass spectra of the di-PFB esters of 2-ClHDDA (A), 2-ClTDDA (B), and 2-ClAdA (C) are shown. Asterisk is used to show peaks not attributed to 2-ClAdA (background ions).
Effect of Changes in 2-ClHA Concentrations and Incubation Periods on α-ClDCA in HepG2 Cells
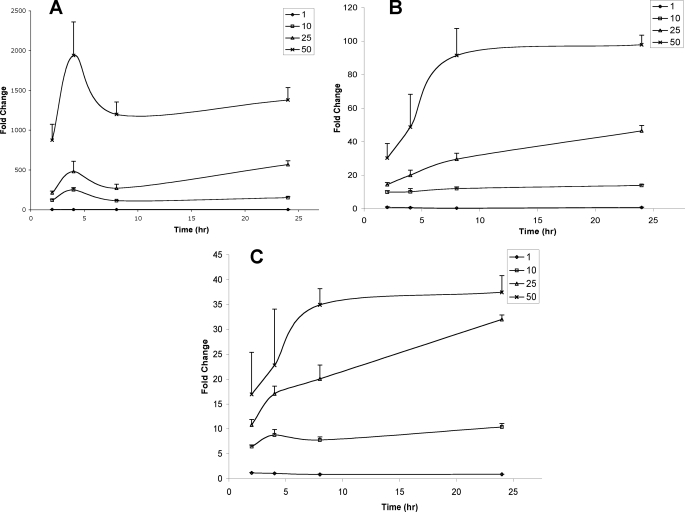
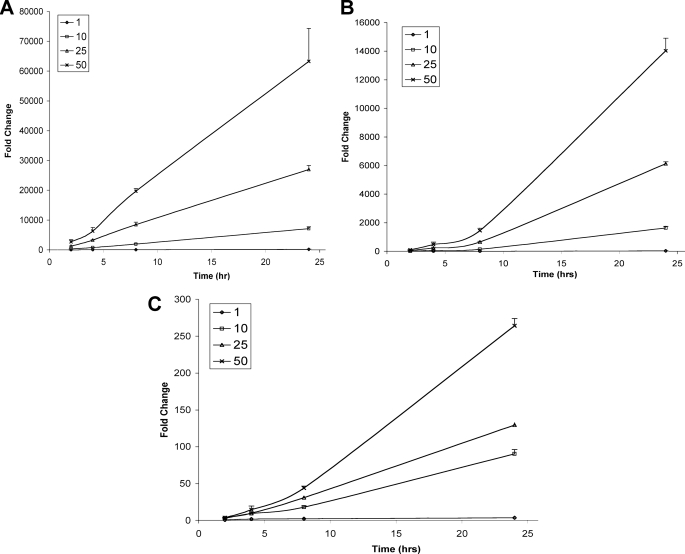
HepG2 cells were incubated either in the absence or presence of 1, 10, 25, and 50 μm 2-ClHA. Changes in the relative abundances of 2-ClHDDA (Figs. 8A and 9A), 2-ClTDDA (Figs. 8B and 9B), and 2-ClAdA (Figs. 8C and 9C) in the cells (Fig. 8 and Table 2) and the cell culture medium (Fig. 9 and Table 2) at 2, 4, 8, and 24 h were determined. The data are presented as fold increase over incubations performed in the absence of 2-ClHA. In separate experiments, a corresponding decrease in the concentration of 2-ClHA in cells and media was also measured (supplemental Fig. 3). The cellular abundance of 2-ClHDDA reaches a maxima at 4 h and then drops rapidly to a plateau by 8 h (Fig. 8A). The changes in 2-ClTDDA (Fig. 8B) and 2-ClAdA (Fig. 8C) are similar to each other and vary with the initial amount of 2-ClHA added. At 1 μm 2-ClHA, no increase in either 2-ClTDDA or 2-ClAdA is seen in cells. At 10 and 25 μm 2-ClHA, both 2-ClTDDA and 2-ClAdA increase gradually over the 24-h duration. However, at 50 μm 2-ClHA, both of these α-ClDCA reach a maxima and plateau at the 8-h time point. In media, relative abundances of 2-ClHDDA (Fig. 9A), 2-ClTDDA (Fig. 9B), and 2-ClAdA (Fig. 9C) increase throughout the period of observation. The relative increase of the different α-ClDCA at 24 h with 1 and 10 μm concentrations of 2-ClHA are also given in Table 2. Taken together, these data show the concentration and time dependence of the conversion of 2-ClHA to α-ClDCA in HepG2 cells.
FIGURE 8.
Temporal- and concentration-dependent accumulation of cellular 2-ClHDDA, 2-ClTDDA, and 2-ClAdA in response to 2-ClHA treatment. HepG2 cells were incubated either with 0, 1, 10, 25, or 50 μm 2-ClHA. At indicated time points, cellular 2-ClHDDA, 2-ClTDDA, and 2-ClAdA were quantified using GC-MS of their PFB esters as described under “Experimental Procedures.” The fold change in 2-ClHDDA (A), 2-ClTDDA (B), and 2-ClAdA (C) over the control (i.e. no 2-ClHA) is depicted (n = 3 for each time point, and the data are shown as mean ± S.E.).
FIGURE 9.
Temporal- and concentration-dependent accumulation of cell culture media 2-ClHDDA, 2-ClTDDA, and 2-ClAdA in response to 2-ClHA treatment of HepG2 cells. HepG2 cells were incubated either with 0, 1, 10, 25, or 50 μm 2-ClHA. At indicated time points 2-ClHDDA, 2-ClTDDA, and 2-ClAdA levels present in cell culture media were quantified using GC-MS of their PFB esters as described under “Experimental Procedures.” The fold change in 2-ClHDDA (A), 2-ClTDDA (B), and 2-ClAdA (C) over the control (i.e. no 2-ClHA) is depicted (n = 3 for each time point and the data are shown as mean ± S.E.).
TABLE 2.
Fold change of different α-ClDCA in cells and media after incubation with either 1 or 10 μm 2-ClHA at 24 h (average ± S.E.)
| Compound | Cells | Media | ||
|---|---|---|---|---|
| 1 μm (2-ClHA) | 10 μm (2-ClHA) | 1 μm (2-ClHA) | 10 μm (2-ClHA) | |
| 2-ClHDDA | 1.3 ± 0.2 | 150.9 ± 10.6 | 201.6 ± 17.9 | 7128.5 ± 614.1 |
| 2-ClTDDA | 0.7 ± 0.2 | 13.9 ± 0.7 | 26.3 ± 4 | 1625.7 ± 121.8 |
| 2-ClAdA | 0.9 ± 0.04 | 10.4 ± 0.7 | 3.6 ± 0.1 | 90.3 ± 6 |
Quantification of Rat and Human Urinary 2-ClAdA
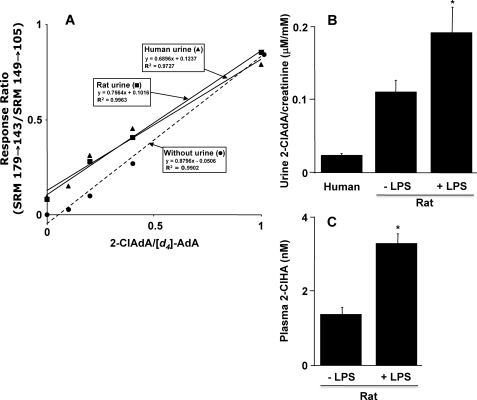
Because dicarboxylic acids are water-soluble and readily excreted in urine, we investigated whether 2-ClAdA is present in rat and human urine using LC-MS instrumentation with specific SRM detection. For these studies, deuterated adipic acid ([d4]adipic acid) was used as an internal standard, and response curves using known amounts of 2-ClAdA spiked in the presence and absence of urine were generated (Fig. 10A). We noted that urine slightly attenuated the ratio of the signal of 2-ClAdA to [d4]adipic acid in comparison with the observed ratios in the absence of urine. Next, the ratio of urinary 2-ClAdA to creatinine was determined in human and rat samples (Fig. 10B). Urinary creatinine excretion is ∼104-fold greater than that of urinary 2-ClAdA excretion. In comparison with human urine, rat urinary 2-ClAdA was about 5-fold elevated. In these studies with humans and rats, the urine creatinine concentration ranged from 4.1 to 15.2 and 5.4 to 13.4 mm, respectively, and the urine 2-ClAdA concentration ranged from 0.1 to 0.4 and 0.5 to 1.9 μm, respectively. In rats that were treated with LPS, both urine levels of 2-ClAdA (Fig. 10B) and plasma levels of 2-ClHA (Fig. 10C) were elevated. These data suggest that endogenously produced 2-ClHA leads to increased excretion of 2-ClAdA.
FIGURE 10.
LC-MS analyses of rat and human urinary 2-ClAdA. Short-chain dicarboxylic acids, including 2-ClAdA and [d4]AdA, were extracted from human (100 μl) or rat (50 μl) urine and subjected to LC-MS as described under “Experimental Procedures.” 2-ClAdA and [d4]AdA were detected using SRM 179 → 143 and SRM 149 → 105, respectively, and the ratios of their intensities were plotted in a response curve against the amounts of each analyte added to urine or blank sample (no urine response curve) (A). B shows the ratio of the urinary 2-ClAdA normalized to urinary creatinine for human and rat specimens (n = 3 for each specimen). Urine was also analyzed from rats 2 h following intraperitoneal injection with 100 μg of LPS/kg body weight (n = 4 for LPS-treated rats). C shows the plasma levels of nonesterified 2-ClHA in control rats and rats following LPS treatment (2 h post-treatment). Values represent the mean ± S.E. Asterisk indicates p ≤ 0.05 for comparisons between LPS and control rat analyses.
In Vivo Conversion of 2-ClHA to 2-ClAdA
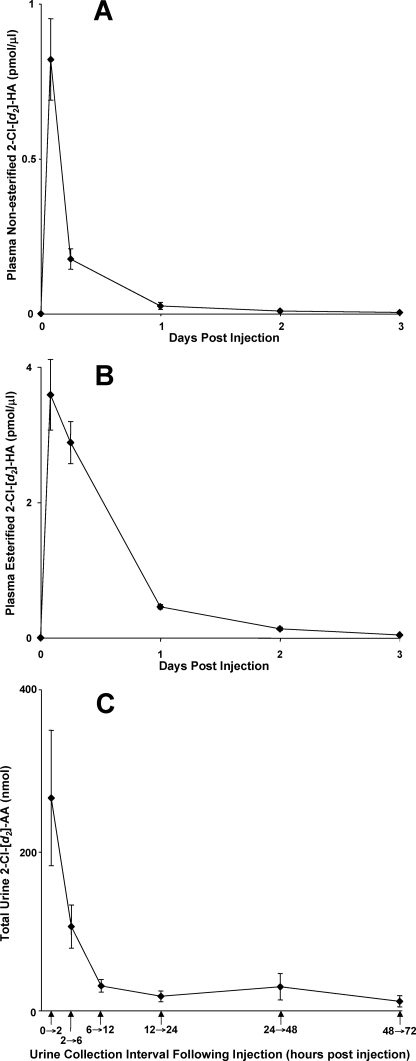
Experiments were performed using stable isotope-labeled 2-ClHA to further determine that ω-oxidation and subsequent β-oxidation of 2-ClHA occur in vivo leading to the excretion of 2-ClAdA. In these experiments we employed 2-Cl-[d2-4,4]HA because rats excrete ClAdA (see above). Rats were injected (intraperitoneally) with 2-Cl-[d2-4,4]HA, and the appearance of 2-Cl-[d2-4,4]HA in plasma and 2-Cl-[d2-4,4]AdA in urine was determined. Fig. 11A shows that free 2-Cl-[d2-4,4]HA levels peaked within the first 2 h following injection, and the peak appearance of esterified 2-Cl-[d2-4,4]HA (Fig. 11B) in plasma was still relatively elevated 6 h post-injection. 2-Cl-[d2-4,4]AdA clearance in the urine was rapid and highest at the first time point measured (urine collected over the first 2 h following injection of 2-Cl-[d2-4,4]HA) (Fig. 11C). Examination of plasma and urine in each rat prior to injections with 2-Cl-[d2-4,4]HA confirmed that both 2-Cl-[d2-4,4]HA and 2-Cl-[d2-4,4]AdA, respectively, are not endogenously present in rats, and their appearance in plasma and urine following injections was dependent on 2-Cl-[d2-4,4]HA intraperitoneal injection. 2-Cl-[d2-4,4]AdA and other α-Cl-[d2-4,4]DCAs were not detected in plasma of rats treated with 2-Cl-[d2-4,4]HA. Additionally, 2-Cl-[d2-4,4]AdA was the only α-Cl-[d2-4,4]DCA that was detected in urine of rats treated with 2-Cl-[d2-4,4]HA. Thus, the in vivo metabolism of 2-Cl-[d2-4,4]HA to 2-Cl-[d2-4,4]AdA appears to be very efficient, and 2-Cl-[d2-4,4]AdA excretion via urine is effective for elimination.
FIGURE 11.
In vivo conversion of systemic 2-ClHA to 2-ClAdA that is excreted in urine. Rats were injected intraperitoneally with 2-Cl-[d2-4,4]HA, and plasma 2-Cl-[d2-4,4]HA and urinary 2-Cl-[d2-4,4]AdA were quantified at the indicated times as described under “Experimental Procedures.” 2-Cl-[d2-4,4]HA was quantified by LC-MS using 2-Cl-[d4-7,8]HA as an internal standard. Plasma free and esterified 2-Cl-[d2-4,4]HA levels were quantified in plasma at indicated times (A and B, respectively). Urinary 2-Cl-[d2-4,4]AdA and [d4]AdA (internal standard) were detected using SRM 181 → 145 and SRM 149 → 105, respectively (C). Values in each panel represent the mean ± S.E. from three independently treated rats.
DISCUSSION
MPO-derived HOCl can target plasmalogens to generate 2-ClHDA (12). 2-ClHDA, a neutrophil chemoattractant (18), is increased in human atherosclerotic tissue and in infarcted myocardium (19, 20). 2-ClHDA also inhibits endothelial nitric-oxide synthase (46). Recent investigations have shown that neutrophils and endothelial cells can oxidize 2-ClHDA to generate 2-ClHA or reduce it to the corresponding alcohol (23). In this study, we demonstrate that 2-ClHA can be ω-oxidized to generate α-ClDCA. Initial studies demonstrated ω-hydroxylation of 2-ClHA using purified microsomes. Next, we identified 2-ClHDDA and 2-ClTDDA in HepG2 cells using GC-MS of their derivative di-PFB esters. Structural elucidation of underivatized 2-ClHDDA was also performed by ESI-MS/MS. Identity of media-derived 2-ClAdA was confirmed by comparing its chromatographic and mass spectrometric properties with that of synthetic 2-ClAdA by both GC-MS and LC-MS/MS. The use of stable isotope-labeled 2-ClHA confirmed that these compounds are ω-oxidation catabolites of 2-ClHA. Furthermore, a concentration-dependent increase of α-ClDCA was observed in the media of cultured HepG2 cells. In comparison, the relative cellular concentrations for each α-ClDCA measured was low, indicating that similar to known dicarboxylic acids, such as adipic acid and suberic acid, these compounds are water-soluble and were secreted in the media.
ω-Oxidation involves a series of enzymatic steps that generate short-chain dicarboxylic acids from monocarboxylic fatty acids (27, 29, 44). Scheme 3 depicts similar steps involved in the generation of α-ClDCA from 2-ClHA. In this study, we were able to identify 2-ClHDDA and 2-ClTDDA as intermediates in the pathway, which ultimately leads to the production of 2-ClAdA. It is thought that β-oxidation of long-chain dicarboxylic acids occurs exclusively in the peroxisome, whereas short-chain dicarboxylic acids may also be metabolized in the mitochondria (44). The absence of other detectable intermediates (e.g. 12, 10, and 8 carbon α-ClDCA) may be due to either subsequent steps of β-oxidation being rapid or the intermediates being present as CoA or carnitine metabolites.
SCHEME 3.
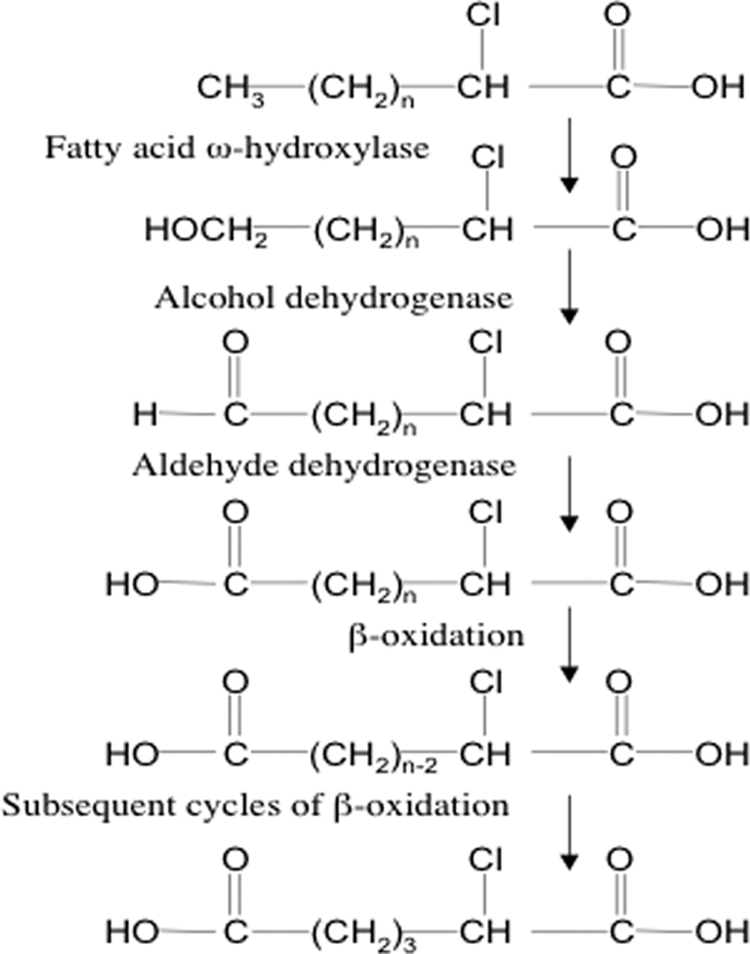
ω-Oxidation of α-chlorinated fatty acids.
The complexity of the system is further suggested by the variations in relative cellular concentrations of the different α-ClDCA. 2-ClHDDA is the first product of ω-oxidation that enters the peroxisomal β-oxidation cycle as the di-carboxyl-CoA (47). Its concentration peaked at 4 h followed by a drop in its cellular concentration by 8 h. These temporal observations were best illustrated with 50 μm 2-ClHA treatments. Using primary rat hepatocytes, it has been shown that 2-hexadecane-dioic acid, the product of ω-oxidation, causes an induction of peroxisomal β-oxidation (48). While the time period of incubation was 3 days in the study, earlier time points were not measured. Along with secretion of 2-ClHDDA in the media, a similar induction or optimal activation of peroxisomal β-oxidation could explain the drop in 2-ClHDDA levels. It should also be noted that, with 50 μm 2-ClHA incubation, 2-ClTDDA and 2-ClAdA levels peak between 4 and 8 h. Dicarboxylic acids are also thought to contribute to the mitochondrial dysfunction observed in Reye syndrome (49, 50). Thus, it will be interesting to pursue the effects of α-ClDCA on mitochondrial and peroxisomal function.
Under basal conditions, β-oxidation is the predominant pathway of fatty acid metabolism, and ω-oxidation is thought to contribute only up to 10% (25). It has been appreciated that in diseases associated with high risk of heart disease, such as obesity and diabetes, ω-oxidation plays an increased metabolic role (26–29). It is likely that 2-ClHA, by analogy with 2-bromopalmitic acid (24), might not undergo β-oxidation. Thus, ω-oxidation may serve as the primary metabolic pathway for α-ClFA. The utilization of this pathway for α-ClFA catabolism would be analogous to the use of this pathway in children with in-born errors of β-oxidation of fatty acids, which leads to elevated urinary AdA levels (45, 51). Thus, either deficiencies in normal oxidation of fatty acids through genetic deficiencies or poor substrate use for β-oxidation may lead to ω-oxidation and subsequent α-dicarboxylic acid production. For α-ClFA, this mechanism is supported by the demonstration, herein, that systemic circulating 2-Cl-[d2-4,4]HA is cleared in rats, at least in part by metabolism of 2-Cl-[d2-4,4]HA to 2-Cl-[d2-4,4]AdA that is excreted in urine. Additionally, 2-ClAdA was identified as an endogenously excreted metabolite in both rats and humans. Furthermore, LPS-mediated inflammation leads to both elevations in plasma 2-ClHA and urine 2-ClAdA.
The identification of these additional metabolites (e.g. α-ClDCA) originating from the oxidation of plasmalogens by HOCl extends the chlorinated lipidome and metabolites of this lipidome. Additionally, metabolism of 2-ClHA likely has an important role in regulating levels of biologically active chlorinated lipids. Alternatively, by analogy to nonhalogenated DCA species, these α-ClDCA species may have inherent unique cell signaling properties.
Supplementary Material
This work was supported, in whole or in part, by National Institutes of Health Grants HL074214 (to D. A. F.), HL088073 (to D. A. F.), HL098907 (to D. A. F.), and RR019232 (to D. A. F.). This work was also supported by Grant-in-aid 0650044Z (to D. A. F.) and Predoctoral Fellowship Grants 0710121Z (to V. V. B.) and 0710163Z (to D. S. A.) from the American Heart Association.

The on-line version of this article (available at http://www.jbc.org) contains supplemental Figs. 1–4.
- MPO
- myeloperoxidase
- 2-ClHDA
- 2-chlorohexadecanal
- α-ClFA
- α-chlorinated fatty acid
- α-ClDCA
- α-chlorinated dicarboxylic acid
- 2-ClHA
- 2-chlorohexadecanoic acid
- 2-ClAdA
- 2-chloroadipic acid
- 2-Cl-[d2-4,4]HA
- 2-chloro-[d2-4,4]hexadecanoic acid
- 2-Cl-[d4-7,8]HA
- 2-chloro-[d4-7,7,8,8]hexadecanoic acid
- ESI-MS/MS
- direct infusion-electrospray ionization-tandem mass spectrometry
- PFB
- pentafluorobenzyl
- PFB-Br
- pentafluorobenzyl bromide
- NICI
- negative ion chemical ionization
- SIM
- selected ion monitoring
- SRM
- selected reaction monitoring
- 2-ClHDDA
- 2-chloro-hexadecane-(1,16)-dioic acid
- 2-ClTDDA
- 2-chlorotetradecane-(1,14)-dioic acid
- d4-AdA
- [d4-3,3,4,4]adipic acid.
REFERENCES
- 1.Hampton M. B., Kettle A. J., Winterbourn C. C. (1998) Blood 92, 3007–3017 [PubMed] [Google Scholar]
- 2.Lampert M. B., Weiss S. J. (1983) Blood 62, 645–651 [PubMed] [Google Scholar]
- 3.Sugiyama S., Okada Y., Sukhova G. K., Virmani R., Heinecke J. W., Libby P. (2001) Am. J. Pathol. 158, 879–891 [DOI] [PMC free article] [PubMed] [Google Scholar]
- 4.Harrison J. E., Schultz J. (1976) J. Biol. Chem. 251, 1371–1374 [PubMed] [Google Scholar]
- 5.Cech P., Papathanassiou A., Boreux G., Roth P., Miescher P. A. (1979) Blood 53, 403–411 [PubMed] [Google Scholar]
- 6.Kitahara M., Eyre H. J., Simonian Y., Atkin C. L., Hasstedt S. J. (1981) Blood 57, 888–893 [PubMed] [Google Scholar]
- 7.Lehrer R. I., Cline M. J. (1969) J. Clin. Invest. 48, 1478–1488 [DOI] [PMC free article] [PubMed] [Google Scholar]
- 8.Nicholls S. J., Hazen S. L. (2005) Arterioscler. Thromb. Vasc. Biol. 25, 1102–1111 [DOI] [PubMed] [Google Scholar]
- 9.McMillen T. S., Heinecke J. W., LeBoeuf R. C. (2005) Circulation 111, 2798–2804 [DOI] [PubMed] [Google Scholar]
- 10.Nikpoor B., Turecki G., Fournier C., Théroux P., Rouleau G. A. (2001) Am. Heart J. 142, 336–339 [DOI] [PubMed] [Google Scholar]
- 11.Asselbergs F. W., Reynolds W. F., Cohen-Tervaert J. W., Jessurun G. A., Tio R. A. (2004) Am. J. Med. 116, 429–430 [DOI] [PubMed] [Google Scholar]
- 12.Albert C. J., Crowley J. R., Hsu F. F., Thukkani A. K., Ford D. A. (2001) J. Biol. Chem. 276, 23733–23741 [DOI] [PubMed] [Google Scholar]
- 13.Albert C. J., Crowley J. R., Hsu F. F., Thukkani A. K., Ford D. A. (2002) J. Biol. Chem. 277, 4694–4703 [DOI] [PubMed] [Google Scholar]
- 14.Albert C. J., Thukkani A. K., Heuertz R. M., Slungaard A., Hazen S. L., Ford D. A. (2003) J. Biol. Chem. 278, 8942–8950 [DOI] [PubMed] [Google Scholar]
- 15.Panneels V., Macours P., Van den Bergen H., Braekman J. C., Van Sande J., Boeynaems J. M. (1996) J. Biol. Chem. 271, 23006–23014 [DOI] [PubMed] [Google Scholar]
- 16.Skaff O., Pattison D. I., Davies M. J. (2008) Biochemistry 47, 8237–8245 [DOI] [PubMed] [Google Scholar]
- 17.Thukkani A. K., Albert C. J., Wildsmith K. R., Messner M. C., Martinson B. D., Hsu F. F., Ford D. A. (2003) J. Biol. Chem. 278, 36365–36372 [DOI] [PubMed] [Google Scholar]
- 18.Thukkani A. K., Hsu F. F., Crowley J. R., Wysolmerski R. B., Albert C. J., Ford D. A. (2002) J. Biol. Chem. 277, 3842–3849 [DOI] [PubMed] [Google Scholar]
- 19.Thukkani A. K., McHowat J., Hsu F. F., Brennan M. L., Hazen S. L., Ford D. A. (2003) Circulation 108, 3128–3133 [DOI] [PubMed] [Google Scholar]
- 20.Thukkani A. K., Martinson B. D., Albert C. J., Vogler G. A., Ford D. A. (2005) Am. J. Physiol. Heart Circ. Physiol. 288, H2955–H2964 [DOI] [PubMed] [Google Scholar]
- 21.Wildsmith K. R., Albert C. J., Hsu F. F., Kao J. L., Ford D. A. (2006) Chem. Phys. Lipids 139, 157–170 [DOI] [PubMed] [Google Scholar]
- 22.Anbukumar D. S., Shornick L. P., Albert C. J., Steward M. M., Zoeller R. A., Neumann W. L., Ford D. A. (2010) J. Lipid Res. 51, 1085–1092 [DOI] [PMC free article] [PubMed] [Google Scholar]
- 23.Wildsmith K. R., Albert C. J., Anbukumar D. S., Ford D. A. (2006) J. Biol. Chem. 281, 16849–16860 [DOI] [PubMed] [Google Scholar]
- 24.Chase J. F., Tubbs P. K. (1972) Biochem. J. 129, 55–65 [DOI] [PMC free article] [PubMed] [Google Scholar]
- 25.Björkhem I. (1978) J. Lipid Res. 19, 585–590 [PubMed] [Google Scholar]
- 26.Mortensen P. B., Gregersen N. (1981) Biochim. Biophys. Acta 666, 394–404 [DOI] [PubMed] [Google Scholar]
- 27.Reddy J. K., Rao M. S. (2006) Am. J. Physiol. Gastrointest. Liver Physiol. 290, G852–G858 [DOI] [PubMed] [Google Scholar]
- 28.Björkhem I. (1976) J. Biol. Chem. 251, 5259–5266 [PubMed] [Google Scholar]
- 29.Mortensen P. B. (1984) Dan. Med. Bull. 31, 121–145 [PubMed] [Google Scholar]
- 30.Okita R. T., Okita J. R. (2001) Curr. Drug Metab. 2, 265–281 [DOI] [PubMed] [Google Scholar]
- 31.Wakabayashi K., Shimazono N. (1963) Biochim. Biophys. Acta 70, 132–142 [DOI] [PubMed] [Google Scholar]
- 32.Lu A. Y., Coon M. J. (1968) J. Biol. Chem. 243, 1331–1332 [PubMed] [Google Scholar]
- 33.Bergseth S., Hokland B. M., Bremer J. (1988) Biochim. Biophys. Acta 961, 103–109 [DOI] [PubMed] [Google Scholar]
- 34.Starostin E. K., Mazurchik A. A., Ignatenko A. V., Nikishin G. I. (1992) Synthesis 1992, 917–918 [Google Scholar]
- 35.Komen J. C., Duran M., Wanders R. J. (2004) J. Lipid Res. 45, 1341–1346 [DOI] [PubMed] [Google Scholar]
- 36.Jemal M., Ouyang Z. (1998) J. Chromatogr. B. Biomed. Sci. Appl. 709, 233–241 [DOI] [PubMed] [Google Scholar]
- 37.Zhang R., Brennan M. L., Shen Z., MacPherson J. C., Schmitt D., Molenda C. E., Hazen S. L. (2002) J. Biol. Chem. 277, 46116–46122 [DOI] [PubMed] [Google Scholar]
- 38.Bligh E. G., Dyer W. J. (1959) Can. J. Biochem. Physiol. 37, 911–917 [DOI] [PubMed] [Google Scholar]
- 39.Käkölä J., Alén R. (2006) J. Sep Sci. 29, 1996–2003 [DOI] [PubMed] [Google Scholar]
- 40.Kerwin J. L., Torvik J. J. (1996) Anal. Biochem. 237, 56–64 [DOI] [PubMed] [Google Scholar]
- 41.Bility M. T., Thompson J. T., McKee R. H., David R. M., Butala J. H., Vanden Heuvel J. P., Peters J. M. (2004) Toxicol. Sci. 82, 170–182 [DOI] [PubMed] [Google Scholar]
- 42.Hsu F. F., Hazen S. L., Giblin D., Turk J., Heinecke J. W., Gross M. L. (1999) Int. J. Mass Spectr. 187, 795–812 [Google Scholar]
- 43.Grossert J. S., Fancy P. D., White R. L. (2005) Can. J. Chem. 83, 1878–1890 [Google Scholar]
- 44.Wanders R. J., Waterham H. R. (2006) Annu. Rev. Biochem. 75, 295–332 [DOI] [PubMed] [Google Scholar]
- 45.Gregersen N., Kølvraa S., Rasmussen K., Mortensen P. B., Divry P., David M., Hobolth N. (1983) Clin. Chim. Acta 132, 181–191 [DOI] [PubMed] [Google Scholar]
- 46.Marsche G., Heller R., Fauler G., Kovacevic A., Nuszkowski A., Graier W., Sattler W., Malle E. (2004) Arterioscler. Thromb. Vasc. Biol. 24, 2302–2306 [DOI] [PubMed] [Google Scholar]
- 47.Vamecq J., de Hoffmann E., Van Hoof F. (1985) Biochem. J. 230, 683–693 [DOI] [PMC free article] [PubMed] [Google Scholar]
- 48.Kaikaus R. M., Chan W. K., Lysenko N., Ray R., Ortiz de Montellano P. R., Bass N. M. (1993) J. Biol. Chem. 268, 9593–9603 [PubMed] [Google Scholar]
- 49.Tonsgard J. H., Getz G. S. (1985) J. Clin. Invest. 76, 816–825 [DOI] [PMC free article] [PubMed] [Google Scholar]
- 50.Passi S., Picardo M., Nazzaro-Porro M., Breathnach A., Confaloni A. M., Serlupi-Crescenzi G. (1984) Biochem. Pharmacol. 33, 103–108 [DOI] [PubMed] [Google Scholar]
- 51.Tonsgard J. H. (1985) J. Pediatr. 107, 79–84 [DOI] [PubMed] [Google Scholar]
Associated Data
This section collects any data citations, data availability statements, or supplementary materials included in this article.


