Abstract
SOCS3 is a cytokine-inducible negative regulator of cytokine receptor signaling. Recently, SOCS3 was shown to be induced by a cAMP-dependent pathway involving exchange protein directly activated by cAMP (Epac). We observed in livers of fasted mice that Socs3 mRNA was increased 4-fold compared with refed mice, suggesting a physiologic role for SOCS3 in the fasted state that may involve glucagon and Epac. Treating primary hepatocytes with glucagon resulted in a 4-fold increase in Socs3 mRNA levels. The Epac-selective cAMP analog 8–4-(chlorophenylthio)-2′-O-methyladenosine-3′,5′-monophosphate, acetoxymethyl ester (cpTOME) increased Socs3 expression comparably. In gain-of-function studies, adenoviral expression of SOCS3 in primary hepatocytes caused a 50% decrease in 8-br-cAMP-dependent PKA phosphorylation of the transcription factor CREB. Induction of the gluconeogenic genes Ppargc1a, Pck1, and G6pc by glucagon or 8-br-cAMP was suppressed nearly 50%. In loss-of-function studies, hepatocytes from liver-specific SOCS3 knock-out mice responded to 8-br-cAMP with a 200% greater increase in Ppargc1a and Pck1 expression, and a 30% increase in G6pc expression, relative to wild-type cells. Suppression of SOCS3 by shRNA in hepatocytes resulted in a 60% increase in cAMP-dependent G6pc and Pck1 expression relative to control cells. SOCS3 expression also inhibited cAMP-dependent phosphorylation of the IP3 receptor but did not inhibit nuclear localization of the catalytic subunit of PKA. Using an in vitro kinase assay, cAMP-dependent PKA activity was reduced by 80% in hepatocytes expressing ectopic SOCS3. These data indicate that cAMP activates both the PKA and Epac pathways with induction of SOCS3 by the Epac pathway negatively regulating the PKA pathway.
Keywords: CREB, Cyclic AMP (cAMP), Gluconeogenesis, Hepatocyte, Protein Kinase A (PKA), Epac, SOCS3, Glucagon
Introduction
Glucagon is a catabolic hormone that is synthesized and released by α cells in the pancreatic islets in response to hypoglycemia (1). Glucagon maintains normoglycemia by increasing hepatic glucose output through mobilization of glucose from glycogen (glycogenolysis) and increasing de novo glucose production (gluconeogenesis) (1, 2). Glucagon receptor expression has been found in the pancreas, small intestine, and kidney, but is minimal compared with levels in the liver (3). The glucagon receptor is a classic Gsα-coupled receptor. Receptor-ligand coupling results in activation of adenylate cyclase, cAMP production, and protein kinase A (PKA) activation. In a reaction that is critical to gluconeogenesis, activated PKA phosphorylates cAMP response element-binding protein (CREB)2 leading to its transcriptional activation at the cAMP-responsive element (CRE) in the promoter region of key genes, including peroxisome proliferator-activated receptor-γ coactivator 1α (Ppargc1a), phosphoenolpyruvate carboxykinase (Pck1), and glucose-6-phosphatase (G6pc) (1, 4). PEPCK catalyzes the rate-limiting step in gluconeogenesis, while G-6-Pase hydrolyzes glucose-6-phosphate to generate free glucose that can be released from the hepatocyte into the circulation. PGC-1α coactivates hepatic nuclear factor-4α (HNF-4α) and the forkhead transcription factor FOXO1, robustly increasing transcription of Pck1 and G6pc (1, 5, 6).
PKA is a tetrameric holoenzyme consisting of two regulatory (R) and two catalytic (C) subunits. PKA exists in an inactive state until cAMP binds to the regulatory subunits, causing the release of the catalytic subunits. Active PKA phosphorylates serine/threonine residues on its substrates at the consensus sequence Arg-Arg-X-Ser/Thr-X. There are two types of regulatory subunits, I and II, each having two subtypes, α and β. RIα and RIIα are ubiquitously expressed while the β isoforms are predominantly found in the brain (7, 8). Whereas the catalytic subunits (α, β and γ) are similar in expression and function, each regulatory isoform possesses a unique functional phenotype (9). RI subunits are mostly cytoplasmic, while RII subunits are typically associated with anchoring proteins (AKAPs) that target PKA to specific cellular compartments and organelles. The AKAPs display isoform specificity in their binding to the regulatory subunits (10, 11).
PKA-dependent phosphorylation of CREB at residue Ser-133 does not alter the binding of CREB to the Cre site in the PEPCK promoter. It promotes, however, the recruitment of the coactivators, CREB-binding protein (CBP), CREB-regulated transcription coactivator 2 (CRTC2; also known as TORC2), and p300 to a transcriptional complex (12–16). CBP interacts with RNA helicase protein, promoting transcriptional activation (17). This transcription activation pathway is negatively regulated by dephosphorylation of CREB at Ser-133 by the serine/threonine phosphatases PP-1 and PP-2A, with PP-2A being the predominant phosphatase mediating this reaction in hepatocytes (18, 19).
SOCS (suppressor of cytokine signaling) proteins are a family of negative regulators of signal transduction pathways. There are eight members of this protein family that are defined by a variable N-terminal region, a central Src homology domain 2 (SH2) and a C-terminal SOCS box that contains a functional BC box that targets substrates for proteosomal degradation (20–22). SOCS3 is a known antagonist of several receptor signaling pathways including IL-6, growth hormone, leptin, and insulin (23–26). Our laboratory and others (25–30) have shown that SOCS3 can antagonize insulin action by proteosomal degradation of the insulin receptor substrates-1/2 (IRS-1/2) and inhibition of phosphorylation of IRS-1/2 and AKT. These data and others demonstrate that SOCS3 is a negative regulator of diverse signaling pathways following its induction.
Recently it was reported that SOCS3 can be induced in human umbilical vein endothelial cells (HUVEC) by a cAMP-dependent pathway that is independent of PKA (31, 32). This PKA-independent pathway involves a cAMP-dependent activation of the Epac, a guanine nucleotide exchange factor that activates the small GTPase Rap1. There are two isoforms of Epac, Epac1 and Epac2. Epac1 is ubiquitously expressed with most prominent expression in the kidney, thyroid, ovary, and brain. Epac2 expression is predominantly found in the brain, adrenal glands and liver (33–36). Yarwood et al. demonstrated that activation of Epac by cAMP leads to the downstream activation of the small G protein Rap1, leading ultimately to increased induction and activation of CCAAT/enhancer-binding proteins (C/EBPs). Activation of C/EBPβ via Epac in COS1 cells appears to require activation of PKCα with subsequent activation of ERK (37).
Glucagon-mediated increases in cAMP have been implicated in the activation of Epac in hepatocytes. Aromataris et al. (38) demonstrated that glucagon can alter hepatic ion channel activity by cAMP-dependent activation of Epac. We now demonstrate that glucagon induces SOCS3 in hepatocytes via Epac activation, and identify a mechanism of inhibitory crosstalk between Epac and PKA that is mediated by SOCS3 and may contribute to regulation of gluconeogenic gene expression.
EXPERIMENTAL PROCEDURES
Materials
Phosphospecific CREB (Ser-133) and CREB antibodies were purchased from Millipore (Billerica, MA). SOCS-3 (C terminus) antibodies were from AnaSpec, Inc (San Jose, CA) and Abcam, Inc (Cambridge, MA). pIP3R and β-actin antibodies were from Cell Signaling Technology (Beverly, MA). IP3R mass antibody was from Thermo Scientific (Rockford, IL). Recombinant mouse IL-6 and porcine glucagon were purchased from R&D Systems (Minneapolis, MN) and Sigma, respectively. 8-Bromo-cAMP and H-89 were purchased from Calbiochem (Gibbstown, NJ). cpTOME was purchased from Axxora (San Diego, CA). Adenovirus constructs: the mouse SOCS3 transcript was amplified from mouse cDNA by PCR with primers: SOCS3-forward: 5′-GGAATTCGCCACCATGGTCACCCACAGCAAG-3′ and SOCS3-reverse: 5′-CCGCTCGAGTTAAAGTGGAGCATCATACTG-3′. The mouse SOCS3 PCR product (678 bp, GenBankTM accession number NM007707) was digested with EcoR I and XhoI and ligated into the pShuttle-CMV vector (Stratagene, La Jolla, CA 92037). The pShuttle-CMV-mSOCS construct was verified by restriction and sequence analysis (ABI 3700, ACGT Inc., Wheeling, IL).
A 256-base pair sequence of the human U6 promoter was amplified from human genomic DNA (CH Laboratories, Inc., Palo Alto, CA) by PCR with primers: U6-forward: 5′-ATAAGAATGCGGCCGCAAGGTCGGGCAGGAAGA and U6-reverse: 5′-CCCAAGCTTTCTAGACGAAACACCGTGCTCGC. The U6 PCR product was digested with NotI and HindIII and inserted into pShuttle to generate the pShuttle-U6 vector. An oligonucleotide pair for mouse SOCS3 shRNA (shSOCS3- mSOCS3_1020: 5′-CTAGAGGGAGTTCCTGGATCAGTATGAAGTTCTCTCATACTGATCCAGGAACTCCCTTTTTTA-3, and 5′-AGCTTAAAAAAGGGAGTTCCTGGATCAGTATGAGAGAACTTCATACTGATCCAGGAACTCCCT-3′) were synthesized. One oligonucleotide pair for luciferase was also synthesized as a shRNA control. The underlined nucleotides correspond to nucleotides 1020–1040 of the mouse SOCS3 mRNA sequence (GenBankTM accession number NM_007707). The oligonucleotide pairs were annealed, digested, and ligated between the XbaI and HindIII sites of pShuttle-U6. The pShuttle-U6-shmSOCS3 and pShuttle-U6-shLuciferase were verified by restriction and sequence analysis (ABI 3700, ACGT Inc., Wheeling, IL).
Recombinant adenovirus was generated by homologous recombination of pShuttle-U6-shmSOCS3 or pShuttle-U6-shluciferase constructs with pAdEasy1 in BJ5183 cells following the manufacturer's protocol (Stratagene). Briefly, correct clones were propagated in XL10-gold cells (Stratagene). For the generation of the shmSOCS3 and sh-luc, Ad-293 cells were transfected with 5 μg of Pac-I-linearized adenoviral construct using LipofectamineTM 2000 Transfection Reagent (Invitrogen). After 6 h, transfection medium was replaced by growth medium. Transfected cells were harvested at approximately day 7–10 post-transfection. After 3 freeze-thaw cycles, the lysate was used for large-scale production of adenovirus vectors in Ad-293 cells. Virus was purified by ViraKitTM AdenoMini-4 for Adenovirus 5 and Recombinant Derivatives (Virapur, LLC, San Diego, CA 92121). Virus particles were measured by spectrophotometry. Adenovirus constructs were administered to primary hepatocytes after overnight incubation at 200 viral particles per cell. Subsequent experimentation was performed 24 h after viral infection. RapGAP1 adenovirus was kindly provided by Dr. Alan Smrcka, University of Rochester (39).
Animals
Male C57BL/6J mice purchased from Jackson Laboratories were housed 4 per cage in a microisolator room on a 12 h light/dark cycle at the University of Rochester. The University Committee on Animal Resources approved all protocols. Mice were fasted 24 h. Half were then refed a standard diet for 4 h. Livers were harvested and frozen in liquid nitrogen. Liver-specific SOCS-3 knock-out mice were developed by Dr. Jean Campbell, University of Washington (40). The Socs3 gene was removed by breeding Socs3fl/fl mice with mice expressing the Cre recombinase transgene under control of the albumin promoter (Alb-Cre+). Socs3fl/fl, Alb-Cre− littermates were used as controls. PLCϵ knock-out mice were provided by Dr. Alan Smrcka and were developed as previously described (41).
Primary Mouse Hepatocytes
Mouse hepatocytes were isolated for primary culture. The liver was initially perfused with Hank's buffer containing 5 mm HEPES and 0.5 mm EDTA and then with collagenase type IV (1 mg/ml; Sigma) in Hank's buffer plus 5 mm HEPES and 0.5 mm CaCl2. Hepatocytes were dissociated in Hank's buffer containing 5 mm HEPES, 1.25 mm CaCl2 and 0.6 mm MgSO4. Cells were then filtered through a 100-micron nylon mesh, counted, and viability was determined using trypan blue exclusion. Cells were plated on 60 mm collagen coated dishes in Williams Media E (Sigma) with 5% FBS (Invitrogen) and supplemented with 100units/ml penicillin/streptomycin. Cells were incubated overnight at 37 °C in a humidified atmosphere containing 5% CO2. Cells were exposed to serum-free Williams medium containing 1% BSA 1 h before treatments with 0.1 mm 8-bromo-cAMP, 10 nm glucagon, 20 ng/ml IL-6, 10 μm H-89, or 10 μm cpTOME.
Quantitative Real-time PCR
RNA was extracted using Trizol® (Invitrogen) according to the manufacturer's protocol. cDNA was made via reverse transcription using iSCRIPTTM (Bio-Rad). Real-time PCR was performed using iQTM SYBR® Green Supermix (Bio-Rad) with cDNA and primers on an iCycler IQ multicolor real-time PCR detection system (Bio-Rad MyiQ 2.0) as previously described (42).
Western Blotting
Primary mouse hepatocytes were lysed and subjected to Western blot analysis as previously described (43).
PKA Activity
PKA activity was determined using PepTag Assay for Non-radioactive Detection of cAMP-dependent protein kinase (Promega) according to the manufacturer's protocol.
Nuclear Fractionation
Cytosolic and nuclear fractions were obtained using the NE-PER Nuclear and Cytoplasmic Extraction reagents (Thermo Scientific) according to manufacturer's protocol. Western blotting analysis was performed to determine protein mass in each fraction. Sample volumes analyzed were in proportion to fraction volume.
Statistical Analysis
Results are expressed as mean values ± S.D. Statistical analysis was performed using StatView 5 software (SAS Institute, Cary, NC) and Microsoft Excel (2004). Experimental means were compared using ANOVA where sample means from four groups were compared and Student's t test for comparing two groups.
RESULTS
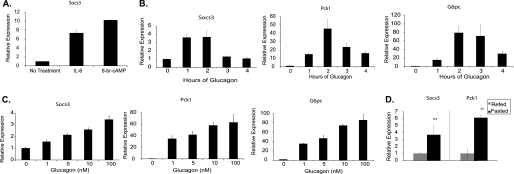
To determine if SOCS3 expression is regulated by cAMP in hepatocytes, primary mouse hepatocytes were treated with 8-bromo-cAMP (8-br-cAMP). Expression levels of Socs3 increased ∼10-fold with 8-br-cAMP treatment. In comparison, IL-6 increased Socs3 expression by ∼7-fold (Fig. 1A). A time course of glucagon-dependent induction showed peak expression of 3.5-fold occurring at 1 h, with a return to baseline at 3–4 h (Fig. 1B). In contrast, expression of the gluconeogenic genes Pck1 and G6pc peaked at 2 h (Fig. 1B). Concentration-dependence of induction of Socs3 and the gluconeogenic genes by glucagon was comparable (Fig. 1C).
FIGURE 1.
Glucagon-dependent induction of Socs3 in primary hepatocytes. A, primary hepatocytes were treated with IL-6 (20 ng/ml) or 8-br-cAMP (0.1 mm) for 2 h. Relative Socs3 expression was measured by qRT-PCR. Time-dependent (B) and concentration-dependent (C) expression of Socs3, Pck1, and G6pc in response to glucagon (10 nm) were measured. D, Socs3 and Pck1 mRNA levels were measured in liver from mice fasted 24 h, or refed for 4 h following a 24 h fast. Data are normalized to fed mice. Data represent the mean ± S.D., n = 3–6. **, p < 0.01.
The above data suggested that Socs3 may be regulated physiologically by glucagon. To examine this question, male C57/BL6 mice were fasted 24 h and half subsequently refed for 4 h. Hepatic Socs3 expression was nearly 4-fold higher in fasted mice compared with refed mice (Fig. 1D). Pck1 expression was similarly increased in fasted mice as expected. Taken together, glucagon induces Socs3 in vitro, and Socs3 expression in the liver is higher under metabolic conditions that favor higher glucagon levels.
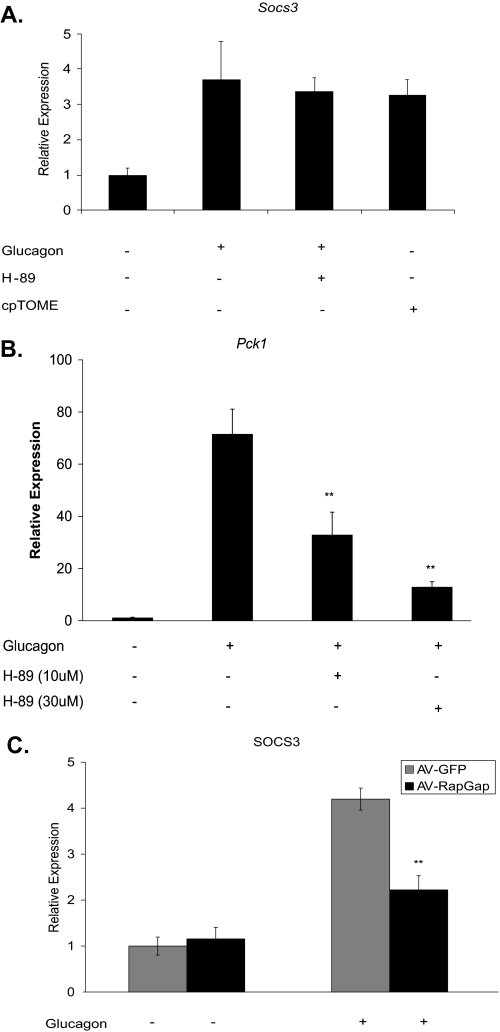
It has been previously shown that Socs3 induction via cAMP is mediated by Epac in mouse embryonic fibroblasts and COS1 cells (31, 32, 37). To demonstrate that SOCS3 is induced by the PKA-independent Epac pathway in hepatocytes, primary mouse hepatocytes were exposed to glucagon in the presence of the PKA-specific inhibitor, H-89. Inhibition of PKA had no effect on Socs3 induction, but decreased induction of Pck1 as expected (Fig. 2, A and B). The Epac-selective cAMP analog cpTOME induced Socs3 similarly to glucagon (Fig. 2A).
FIGURE 2.
Glucagon-dependent induction of Socs3 is mediated by Epac. Primary hepatocytes were treated with glucagon (10 nm), the Epac-selective analog cpTOME (5 μm), or the PKA inhibitor H-89 (10 and 30 μm) for 2 h. mRNA levels were determined for Socs3 (A) and Pck1 (B). C, Socs3 mRNA was measured after a 2 h glucagon treatment in primary hepatocytes infected with RapGAP1-expressing adenovirus (AV-RapGap) (200 moi) or an adenovirus-GFP (AV-GFP) control. Bar graph in C is normalized to GFP with no treatment. Data represent the mean ± S.D., n = 3–6. **, p < 0.01.
Rap1 has been implicated as the downstream mediator of Epac action. To demonstrate this in primary hepatocytes, RapGAP1 was ectopically expressed using adenoviral delivery. RapGAP1, which increases the rate of Rap1-bound GTP hydrolysis, decreased glucagon-dependent induction of Socs3 by ∼60% while having no effect on basal levels (Fig. 2C). These data argue that glucagon induction of Socs3 in primary hepatocytes is mediated by Epac activation and involves Rap1.
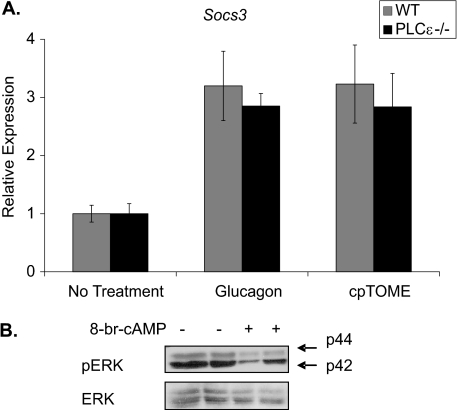
Rap1 activation of PLCϵ has been implicated in the Epac-mediated signaling pathway leading to Socs3 induction (37). To determine if Socs3 induction is mediated by PLCϵ in hepatocytes, primary hepatocytes from PLCϵ knock-out mice were treated with glucagon and cpTOME. Socs3 expression in response to glucagon and cpTOME was comparable in PLCϵ knock-out and wild-type hepatocytes (Fig. 3A). Activation of extracellular signal-related kinase (ERK1/2) has been shown to be required for Epac induction of Socs3 in COS1 and HUVEC cells (32, 37). Primary hepatocytes, however, showed decreased ERK phosphorylation compared with non-treated controls when treated with 8-br-cAMP (Fig. 3B). These data indicate that Socs3 induction in primary hepatocytes is not dependent on PLCϵ and ERK activation. The Epac pathway in hepatocytes appears to have distinct differences from that in other cell types studied to date.
FIGURE 3.
PLCϵ activation is not required for Epac-mediated SOCS3 induction. A, WT and PLCϵ−/− primary hepatocytes were treated with glucagon (10 nm) or cpTOME (5 μm) for 2 h. SOCS3 mRNA levels were measured by qRT-PCR. B, WT primary hepatocytes were treated with 8-br-cAMP (0.1 mm). Phosphorylation of p44/p42 MAP kinase (ERK) was detected by Western blot analysis with a phosphoERK antibody (Thr-202/Tyr-204). Data are normalized to no treatment controls. Data represent the mean ± S.D., n = 5–8.
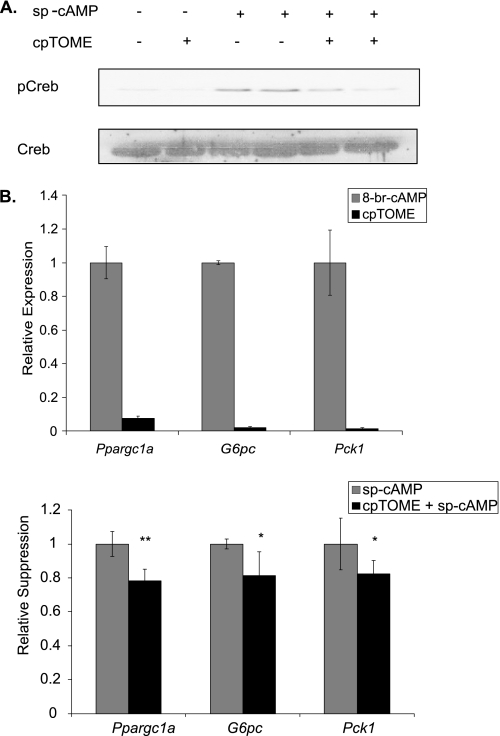
Given that SOCS3 is a negative feedback inhibitor of several signal transduction pathways, Epac/SOCS3-dependent inhibition of glucagon/PKA signaling was investigated. Cells were pretreated with cpTOME for 1 h to induce Socs3. Cyclic AMP analogs were then added for either 2 h to examine gluconeogenic gene expression, or 30 min for CREB phosphorylation. The latter condition results in maximum phosphorylation, though considerable phosphorylation occurs within 1 min (Fig. 5A). Pretreatment with the Epac-specific analog cpTOME markedly suppressed subsequent Ser-133 phosphorylation of CREB (Fig. 4A). Similarly, pretreatment with cpTOME decreased subsequent induction of Ppargc1a, G6pc, and Pck1 by ∼20% (Fig. 4B, bottom graph). Induction of these genes by cpTOME alone was negligible (Fig. 4B, top graph). Epac activation, therefore, appears to negatively regulate PKA activation of gluconeogenic gene expression at the level of CREB phosphorylation. Because the cAMP analog, sp-cAMP is highly resistant to cyclic nucleotide phosphodiesterases, this effect of Epac is likely to be independent of phosphodiesterases though this will require direct testing.
FIGURE 5.
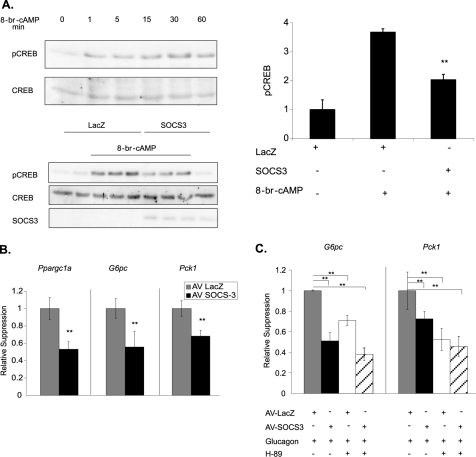
SOCS3 expression inhibits CREB phosphorylation and gluconeogenic gene expression. Primary hepatocytes were infected with either adeno-SOCS3 or adeno-LacZ (control) (200 moi) for 24 h. A, after a 30 min 8-br-cAMP (0.1 mm) treatment, CREB phosphorylation was measured by Western blot analysis. A representative blot is shown. Bar graph represents quantitation of pSer133-CREB relative to AV-LacZ untreated controls. A time course of CREB phosphorylation in the absence of adenovirus is also shown. B, Pck1, G6pc, and Ppargc1a induction was measured by qRT-PCR after a 2 h 8-br-cAMP (0.1 mm) treatment. Data are normalized to AV-LacZ cells treated with 8-br-cAMP. C, Pck1, G6pc, and Ppargc1a induction was measured by qRT-PCR after a 2-h stimulation with glucagon (10 nm) or glucagon plus H-89 (10 μm). Data are normalized to glucagon treated AV-LacZ controls. Data represent the mean ± S.D., n = 6. *, p < 0.05; **, p < .01.
FIGURE 4.
Epac activation inhibits PKA-mediated CREB phosphorylation and gluconeogenic gene expression. cpTOME (5 μm) was added to primary hepatocytes for 1 h (A and B, bottom graph) or 2 h (B, top graph) followed by a 30 min (A) or 2 h (B, bottom graph) incubation with sp-CAMP (10 μm). A, CREB phosphorylation was determined by Western blot analysis using a phosphoCREB-specific (Ser-133) antibody. B, Ppargc1a, G6pc, and Pck1 mRNA levels were determined by qRT-PCR. In the bottom graph, fold activation over basal were 16-, 233-, and 347-fold for ppargc1a, g6pc, and pck1, respectively. Data are normalized to sp-cAMP treated controls. Data represent the mean ± S.D., n = 6. *, p < .05; **, p < 0.01.
To determine if SOCS3 is involved in the Epac-dependent inhibition of CREB phosphorylation and gluconeogenic gene expression, SOCS3 was expressed in primary hepatocytes using a SOCS3 adenoviral construct. In this gain-of-function approach, SOCS3 expression decreased 8-br-cAMP-mediated phosphorylation of CREB by nearly 60% (Fig. 5A), and caused a similar suppression of Ppargc1a, G6pc, and Pck1 expression compared with LacZ infected controls (Fig. 5B). Basal CREB phosphorylation was unchanged. Glucagon-dependent induction of G6pc and Pck1 was also suppressed by SOCS3. SOCS3 plus the PKA inhibitor H-89 produced a further suppression of gluconeogenic gene expression (Fig. 5C). Basal gluconeogenic gene expression was not altered by SOCS3 expression relative to control cells.
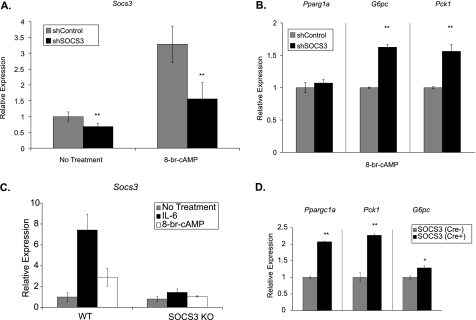
To further establish a role for SOCS3 in regulating gluconeogenic gene expression, two loss-of-function approaches were used. First, Socs3 expression was knocked down using a shRNA construct in primary hepatocytes. Basal expression was decreased 40% and Socs3 expression in the presense of 8-br-cAMP was blunted by 55% (Fig. 6A). With suppression of Socs3, expression of the gluconeogenic genes G6pc and Pck1 were increased by ∼60% in the presence of 8-br-cAMP (Fig. 6B). Ppargc1a expression was unaltered. Basal gluconeogenic gene expression was unchanged in primary hepatocytes infected with shSOCS3 compared with shLuciferase controls (data not shown).
FIGURE 6.
Loss of Socs3 expression increases gluconeogenic gene expression. Primary hepatocytes were infected with adenovirus (200 moi) expressing either shSOCS3 or shLuciferase (control). Socs3 (A) or Pck1, G6pc, and Ppargc1a (B) were measured by qRT-PCR after a 2-h treatment with 8-br-cAMP (0.1 mm). Data represent the mean ± S.D., n = 6. C, primary hepatocytes from liver-specific SOCS3 knock-out mice or their littermate controls were treated with 8-br-cAMP (0.1 mm) or IL-6 (20 ng/ml) for 6 h. Socs3 was measured by qRT-PCR. D, Pck1, G6pc, and Ppargc1a induction was measured by qRT-PCR after a 6-h 8-br-cAMP treatment. Data are normalized to 8-br-cAMP-treated WT controls. Data represent the mean ± S.D., n = 3. *, p < .05; **, p < .01.
In a second loss-of-function approach, liver-specific SOCS3 knock-out mice were used to further examine the role of SOCS3 in hepatic cAMP signaling. Primary hepatocytes from SOCS3 knock-out mice (Cre+) and littermate controls (Cre−) were treated with IL-6 and 8-br-cAMP. As expected, SOCS3 was induced in the WT control hepatocytes but not in the SOCS3-deficient hepatocytes (Fig. 6C). Treatment with 8-br-cAMP increased Ppargc1a, Pck1, and G6pc expression in SOCS3-deficient hepatocytes by 200, 225, and 30%, respectively, relative to littermate controls (Fig. 6D). Basal gluconeogenic gene expression was unaltered in SOCS3-deficient primary hepatocytes (data not shown).
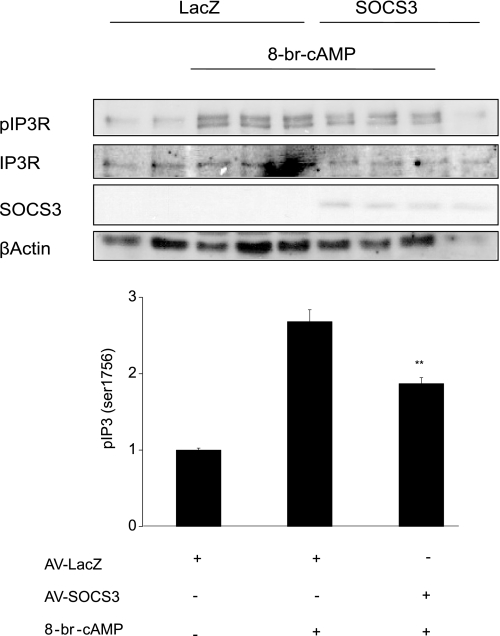
To investigate whether inhibition of CREB phosphorylation by SOCS3 is unique to this nuclear PKA substrate or is a shared effect with other PKA substrates, the effect of SOCS3 on cAMP-dependent phosphorylation of the inositol 1,4,5-trisphosphate receptor (IP3R) was examined. Treatment of hepatocytes with 8-br-cAMP increased phosphorylation of IP3R at Ser1756 almost 3-fold. Ectopic expression of SOCS3, however, reduced cAMP-dependent IP3R phosphorylation by ∼50% (Fig. 7). These data demonstrate that SOCS3 does not selectively inhibit CREB phosphorylation, but rather, may have a more general effect on PKA substrate phosphorylation.
FIGURE 7.
SOCS3 inhibits PKA-mediated Ser-1756 phosphorylation of the IP3R. Primary hepatocytes expressing adeno-SOCS3 or adeno-LacZ (200 moi) were treated with 8-br-cAMP (0.1 mm) for 30 min. Phosphorylation of the IP3 receptor was measured by Western blot analysis using a phosphoIP3R (Ser-1756) antibody. Bar graph represents quantitation of pSer1756-IP3R relative to AV-LacZ-nontreated controls. Data represent the mean ± S.D., n = 3. **, p < 0.01.
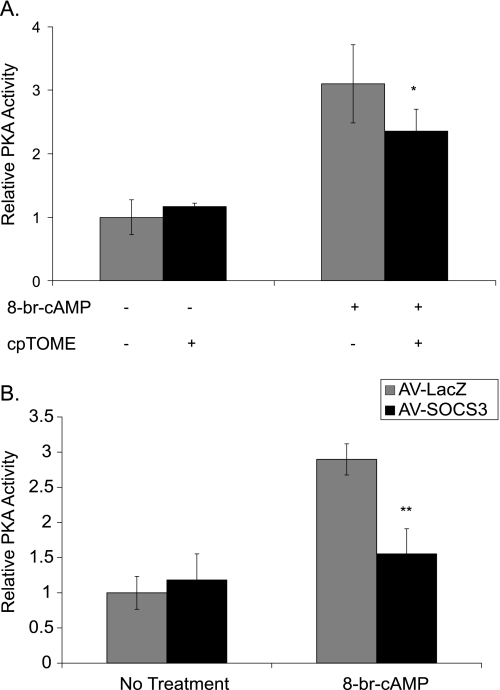
To test the hypothesis that SOCS3 inhibits PKA activity, PKA enzyme activity was assayed in lysates from primary hepatocytes that had been pretreated for 1 h with or without cpTOME to induce Socs3, and then been treated with 8-br-cAMP for 30 min to activate PKA. Stimulation with 8-br-cAMP increased PKA activity ∼3-fold. Cells pretreated with cpTOME, however, had significantly reduced cAMP-dependent PKA activation without any change in basal activity (Fig. 8A). Similarly, ectopic expression of SOCS3 in primary hepatocytes blunted cAMP-dependent PKA activity by 80% compared with LacZ-infected controls without affecting basal activity (Fig. 8B). These data argue that SOCS3 decreases activation of the PKA pathway by inhibiting the ability of PKA to phosphorylate downstream targets.
FIGURE 8.
SOCS3 inhibits PKA activity. A, primary hepatocytes were treated with 8-br-cAMP (0.1 mm) for 30 min with or without a 1 h cpTOME (5 μm) pretreatment. PKA activity was measured in cell lysates using a fluorescent peptide substrate assay (Promega). B, primary hepatocytes expressing adeno-SOCS3 (200 moi) were treated with 8-br-cAMP (0.1 mm) for 30 min. PKA activity was measured in cell lysates. Values are relative to PKA activity (units/ml) with no treatment. Data represent the mean ± S.D., n = 4–6. *, p < 0.05; **, p < .01.
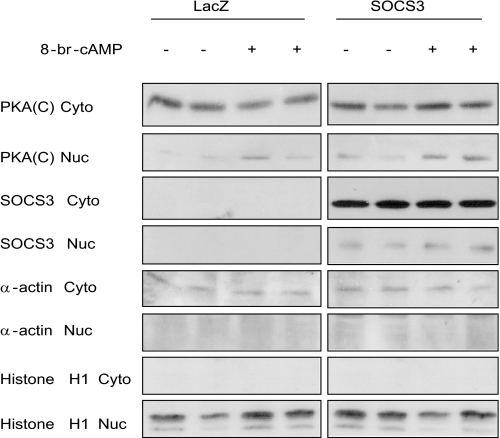
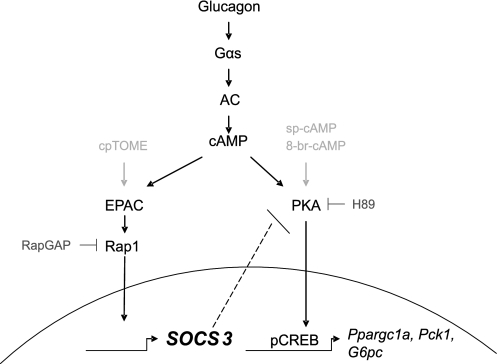
PKA exists as an inactive holoenzyme until cAMP binds to the regulatory subunits causing dissociation of the catalytic subunits. The regulatory subunits remain cytoplasmic, or bound to AKAPs that target them to specific cellular compartments (8, 9). SOCS3 may be inhibiting PKA activity by preventing dissociation of the R and C subunits. Nuclear localization is unique to the catalytic subunit and its analysis can be a surrogate assay for the availability of free catalytic subunit. Separation of cytosolic and nuclear fractions from primary hepatocytes after cAMP treatment demonstrated that translocation of the catalytic subunit of PKA to the nucleus was not inhibited by SOCS3 expression (Fig. 9). This demonstrates that the catalytic subunit is released from the R subunits and translocates to the nucleus even in the presence of SOCS3. A nuclear event involving SOCS3 and C subunit appears to result in decreased phosphorylation of CREB. With SOCS3 involved in the inhibition of PKA substrate phosphorylation in the nucleus (CREB) and on the intracellular membranes (IP3R), these results suggest a model in which SOCS3 is associating with the catalytic subunit to inhibit PKA signaling (Fig. 10).
FIGURE 9.
SOCS3 does not inhibit the translocation of the PKA catalytic subunit to the nucleus. Primary hepatocytes expressing adeno-LacZ or adeno-SOCS3 (200 moi) were treated with 8-br-cAMP (0.1 mm) for 30 min. Cells were subsequently lysed and separated into cytosolic and nuclear fractions. Protein levels were detected by Western blot analysis. β-Actin and histone H1 were used as cytosolic and nuclear markers, respectively. A representative experiment is shown, n = 5.
FIGURE 10.
Crosstalk between the Epac and PKA pathways. Glucagon-dependent activation of adenylate cyclase and generation of cAMP activates both the PKA and Epac pathways. The catalytic subunit of PKA enters the nucleus, and rapidly phosphorylates and activates the transcription factor CREB. The gluconeogenic genes are induced by this pathway. Activation of the Epac pathway leads to induction of SOCS3. SOCS3, acting as a feedback inhibitor, interacts with and inhibits activity of the catalytic subunit of PKA. Thus, the cAMP-Epac-SOCS3 pathway modulates activity of the cAMP-PKA-CREB pathway.
DISCUSSION
Glucagon is an important catabolic hormone for regulation of metabolism in the fasted state, particularly in promoting glucose release from hepatocytes via gluconeogenesis and glycogenolysis. Glucagon signaling has long been associated with the stimulation of cAMP production and activation of PKA. Recently, glucagon-dependent cAMP production has been shown by Aromataris et al. (38) to also activate Epac. One consequence of cAMP-dependent Epac activation is induction of Socs3 expression (31). The current study investigated the physiological role of cAMP-induced Socs3 induction in hepatocytes. Our data demonstrate for the first time that glucagon-dependent Socs3 induction via Epac negatively regulates the PKA pathway in hepatocytes. Inhibition of PKA by SOCS3 leads to decreases in CREB phosphorylation and gluconeogenic gene induction.
Induction of Socs3 via the Epac-dependent pathway in primary hepatocytes differs from that described in other cell systems. As a guanine nucleotide exchange protein, Epac is assumed to mediate its effects through activation of small G-proteins. Inhibition of Rap1 activity with expression of RapGap1 in primary hepatocytes decreased SOCS3 induction following glucagon treatment. This observation is in agreement with studies implicating Rap1 as the downstream mediator and target of Epac activity (31, 32, 37). Borland et al. (37) reported that Rap1-dependent activation of PLCϵ in COS1 cells is required for maximal SOCS3 induction. This observation is supported by other studies demonstrating Rap1-dependent activation of PLCϵ (39, 44). Our data demonstrate, however, that primary hepatocytes from PLCϵ knock-out mice induced SOCS3 similarly to WT controls when stimulated with glucagon. Thus, PLCϵ is not an essential contributor to Epac-dependent Socs3 induction in hepatocytes. Borland et al. (37) also implicated the activation of ERK as the mechanism for C/EBPβ activation and induction of Socs3 in COS1 cells. As shown in this study, hepatocytes treated with 8-br-cAMP actually demonstrated decreased ERK phosphorylation. This has been previously reported in hepatocytes (45). These data demonstrate that the mechanism of Socs3 induction differs between hepatocytes and COS cells. Epac2 is the predominant isoform of Epac in the liver (33), and is absent from COS1 cells (37, 46). This may, in part, explain the differences in signaling pathways. Thus, cAMP induction of Socs3 is mediated by Epac-Rap1 in hepatocytes; however, the remaining signaling steps responsible for SOCS3 induction need to be elucidated.
Treatment of hepatocytes with the Epac-selective analog, cpTOME, and ectopic expression of Socs3 suppressed cAMP and glucagon-dependent CREB phosphorylation and induction of Pck1, G6pc, and Ppargc1a. This directly implicates SOCS3 as the mediator of these effects. Two loss-of-function approaches were used to further confirm the role of SOCS3 as a negative modulator of the glucagon-cAMP-PKA pathway. Sp-cAMP is highly resistant to cyclic nucleotide phosphodiesterases. Nonetheless, its ability to phosphorylate CREB and induce gluconeogenic genes was suppressed by SOCS3 comparably to that of glucagon or 8-b-cAMP. This argues that the mechanism by which SOCS3 negatively regulates PKA signaling is independent of phosphodiesterase activity. Decreased phosphorylation of the IP3R by 8-br-cAMP indicates that the suppressive effect of SOCS3 is not specific to CREB. This led us to test the hypothesis that SOCS3 inhibits PKA activity. Using an in vitro PKA assay, we confirmed that PKA activity was suppressed by SOCS3. SOCS3 inhibition of C subunit dissociation from R subunits was ruled out considering nuclear translocation of the PKA catalytic subunit was not decreased by SOCS3 expression. While requiring experimental validation, our data are consistent with a model in which SOCS3 mediates its inhibitory effects by interacting with the catalytic subunit of PKA. The N- and C-terminal domains of the PKA catalytic subunit are important in mediating protein-protein interactions (9). The C terminus has a hydrophobic motif that allows it to bind to a hydrophobic pocket on PDK1, the high affinity inhibitor PKI, and the regulatory subunits (9, 47–49). The C terminus also plays a role in recognizing protein substrates (9). The N terminus has been shown to undergo covalent modifications, as well as bind to the recently identified protein AKIP1, which targets the catalytic subunit to the nucleus (9, 50). It is therefore feasible that SOCS3 could be a binding partner of the PKA catalytic subunit. Interestingly, the KIR (kinase inhibitory region) domain of SOCS3 contains an arginine residue −3 from a serine residue. This sequence is the minimal consensus sequence required for PKA catalytic subunit recognition and phosphorylation of its target proteins. It is possible that the N-terminal region of SOCS3 containing the KIR domain plays a role in the inhibition of PKA activity.
This is the first report demonstrating SOCS3-dependent modulation of the glucagon signaling pathway and PKA activity. SOCS3 inhibition of gluconeogenesis may be a mechanism for negatively modulating hepatic glucose production (HGP) to help prevent hyperglycemia in the fasted state. Interestingly, prolonged fasting has been shown to decrease activation of the CRE promoter, subsequently decreasing gluconeogenesis (51). This correlates with an increase in circulating ketone bodies during the late “protein-sparing” phase of fasting (51, 52). Liu et al. (51) attributed this metabolic switch to the degradation of CREB-regulated transcription coactivator 2 (CRTC2; also known as TORC2), which is a co-activator of CREB. SOCS3 could potentially play an additional complementary role in prolonged fasting, as a mechanism to decrease gluconeogenesis and switch to fatty acid metabolism and the production of ketone bodies as an energy substrate.
Whereas our data indicate a role for SOCS3 in negatively modulating the glucagon signaling pathway, earlier work by our laboratory and others, have suggested that SOCS3 can be a negative modulator of the insulin signaling pathway (25, 27, 53). Whereas this suggests that SOCS3 inhibits two primary opposing hormonal pathways, we believe that the metabolic state of the cell dictates the primary effect of SOCS3. In models of SOCS3 as an inhibitor of the insulin signaling pathway, the metabolic state being modeled is one of obesity, insulin resistance, cytokine, and adipokine excess. SOCS3 is being induced by cytokines such as IL-6 (54–57). Under these dysmetabolic conditions, the targets of SOCS3, insulin receptor substrates 1 and 2 (IRS1 and IRS2), have additional post-translational modifications, particularly serine phosphorylation (58–60). SOCS3 can decrease insulin responsiveness by inhibiting insulin-mediated IRS-1 and -2 tyrosine phosphorylation, as well as targeting IRS-1 and -2 for proteosomal degradation (25, 26, 43, 61). There is evidence that these post-translational modifications are required for SOCS3 to mediate an inhibitory effect on this pathway (62). Thus SOCS3 may play a role in insulin signaling only under specific pathologic conditions. In contrast, we believe that the glucagon-dependent induction of SOCS3 and its subsequent antagonism of the PKA pathway is a normal physiological role for SOCS3.
Given that insulin and glucagon are opposing hormones, it is also somewhat counter-intuitive that several early studies indicated that glucagon can enhance the suppressive effect of insulin on HGP under defined experimental conditions (63, 64). Insulin activation of AKT leads to phosphorylation of FOXO1, its exclusion from the nucleus, and inhibition of its association with PGC-1α. This is recognized as a dominant mechanism for inhibition of HGP. Here we describe a glucagon-activated negative feedback mechanism by which Epac-mediated SOCS3 induction inhibits PKA and presumably inhibits HGP by suppressing PGC-1α and gluconeogenic gene expression. It is possible that glucagon-mediated SOCS3 induction accentuates the inhibition of HGP when glucagon is administered along with insulin. This mechanism is a potential explanation for the unanticipated interactions of glucagon and insulin as previously reported.
In summary, the data in this study support the hypothesis that glucagon-dependent cAMP production activates two distinct signaling pathways in which the Epac-dependent pathway induces SOCS3 and negatively regulates the PKA-dependent pathway. SOCS3 appears to directly inhibit PKA activity, leading to decreased CREB phosphorylation and decreased gluconeogenic gene expression. This cross-talk may provide additional modulatory regulation of hepatic metabolism in the fasting-feeding cycle. SOCS3 inhibition of PKA may also play an important role in other cell types and signaling pathways, making this inhibitory relationship important to investigate in the future.
This work was funded by a Research Grant from the American Diabetes Association (7-04-RA-78) (to R. A. M.). Additional support was provided by United States Public Health Service Grants R01-DK060732 (to R. A. M.) and R01-GM053536 (to A. V. S.).
- CREB
- cAMP response element-binding protein
- CBP
- CREB-binding protein
- SOCS
- suppressor of cytokine signaling
- cpTOME
- 8–4-(chlorophenylthio)-2′-O-methyladenosine-3′, 5′-monophosphate, acetoxymethyl ester.
REFERENCES
- 1.Jiang G., Zhang B. B. (2003) Am. J. Physiol. Endocrinol. Metab. 284, E671–E678 [DOI] [PubMed] [Google Scholar]
- 2.Pilkis S. J., Granner D. K. (1992) Annu. Rev. Physiol. 54, 885–909 [DOI] [PubMed] [Google Scholar]
- 3.Dunphy J. L., Taylor R. G., Fuller P. J. (1998) Mol. Cell. Endocrinol. 141, 179–186 [DOI] [PubMed] [Google Scholar]
- 4.Herzig S., Long F., Jhala U. S., Hedrick S., Quinn R., Bauer A., Rudolph D., Schutz G., Yoon C., Puigserver P., Spiegelman B., Montminy M. (2001) Nature 413, 179–183 [DOI] [PubMed] [Google Scholar]
- 5.Puigserver P., Rhee J., Donovan J., Walkey C. J., Yoon J. C., Oriente F., Kitamura Y., Altomonte J., Dong H., Accili D., Spiegelman B. M. (2003) Nature 423, 550–555 [DOI] [PubMed] [Google Scholar]
- 6.Yoon J. C., Puigserver P., Chen G., Donovan J., Wu Z., Rhee J., Adelmant G., Stafford J., Kahn C. R., Granner D. K., Newgard C. B., Spiegelman B. M. (2001) Nature 413, 131–138 [DOI] [PubMed] [Google Scholar]
- 7.Scott J. D., Glaccum M. B., Zoller M. J., Uhler M. D., Helfman D. M., McKnight G. S., Krebs E. G. (1987) Proc. Natl. Acad. Sci. U.S.A. 84, 5192–5196 [DOI] [PMC free article] [PubMed] [Google Scholar]
- 8.Barradeau S., Imaizumi-Scherrer T., Weiss M. C., Faust D. M. (2002) Trends Cardiovasc. Med. 12, 235–241 [DOI] [PubMed] [Google Scholar]
- 9.Taylor S. S., Kim C., Vigil D., Haste N. M., Yang J., Wu J., Anand G. S. (2005) Biochim. Biophys. Acta 1754, 25–37 [DOI] [PubMed] [Google Scholar]
- 10.Michel J. J., Scott J. D. (2002) Annu. Rev. Pharmacol. Toxicol. 42, 235–257 [DOI] [PubMed] [Google Scholar]
- 11.Edwards A. S., Scott J. D. (2000) Curr. Opin. Cell Biol. 12, 217–221 [DOI] [PubMed] [Google Scholar]
- 12.Gonzalez G. A., Montminy M. R. (1989) Cell 59, 675–680 [DOI] [PubMed] [Google Scholar]
- 13.Chrivia J. C., Kwok R. P., Lamb N., Hagiwara M., Montminy M. R., Goodman R. H. (1993) Nature 365, 855–859 [DOI] [PubMed] [Google Scholar]
- 14.Arias J., Alberts A. S., Brindle P., Claret F. X., Smeal T., Karin M., Feramisco J., Montminy M. (1994) Nature 370, 226–229 [DOI] [PubMed] [Google Scholar]
- 15.Nichols M., Weih F., Schmid W., DeVack C., Kowenz-Leutz E., Luckow B., Boshart M., Schütz G. (1992) EMBO J. 11, 3337–3346 [DOI] [PMC free article] [PubMed] [Google Scholar]
- 16.Mayr B., Montminy M. (2001) Nat. Rev. Mol. Cell Biol. 2, 599–609 [DOI] [PubMed] [Google Scholar]
- 17.West A. E., Chen W. G., Dalva M. B., Dolmetsch R. E., Kornhauser J. M., Shaywitz A. J., Takasu M. A., Tao X., Greenberg M. E. (2001) Proc. Natl. Acad. Sci. U.S.A. 98, 11024–11031 [DOI] [PMC free article] [PubMed] [Google Scholar]
- 18.Wadzinski B. E., Wheat W. H., Jaspers S., Peruski L. F., Jr., Lickteig R. L., Johnson G. L., Klemm D. J. (1993) Mol. Cell. Biol. 13, 2822–2834 [DOI] [PMC free article] [PubMed] [Google Scholar]
- 19.Hagiwara M., Alberts A., Brindle P., Meinkoth J., Feramisco J., Deng T., Karin M., Shenolikar S., Montminy M. (1992) Cell 70, 105–113 [DOI] [PubMed] [Google Scholar]
- 20.Starr R., Hilton D. J. (1998) Int. J. Biochem. Cell Biol. 30, 1081–1085 [DOI] [PubMed] [Google Scholar]
- 21.Zhang J. G., Farley A., Nicholson S. E., Willson T. A., Zugaro L. M., Simpson R. J., Moritz R. L., Cary D., Richardson R., Hausmann G., Kile B. J., Kent S. B., Alexander W. S., Metcalf D., Hilton D. J., Nicola N. A., Baca M. (1999) Proc. Natl. Acad. Sci. U.S.A. 96, 2071–2076 [DOI] [PMC free article] [PubMed] [Google Scholar]
- 22.Kamura T., Sato S., Haque D., Liu L., Kaelin W. G., Jr., Conaway R. C., Conaway J. W. (1998) Genes Dev. 12, 3872–3881 [DOI] [PMC free article] [PubMed] [Google Scholar]
- 23.Lubis A. R., Widia F., Soegondo S., Setiawati A. (2008) Acta Med. Indones. 40, 89–95 [PubMed] [Google Scholar]
- 24.Adams T. E., Hansen J. A., Starr R., Nicola N. A., Hilton D. J., Billestrup N. (1998) J. Biol. Chem. 273, 1285–1287 [DOI] [PubMed] [Google Scholar]
- 25.Senn J. J., Klover P. J., Nowak I. A., Zimmers T. A., Koniaris L. G., Furlanetto R. W., Mooney R. A. (2003) J. Biol. Chem. 278, 13740–13746 [DOI] [PubMed] [Google Scholar]
- 26.Emanuelli B., Peraldi P., Filloux C., Chavey C., Freidinger K., Hilton D. J., Hotamisligil G. S., Van Obberghen E. (2001) J. Biol. Chem. 276, 47944–47949 [DOI] [PubMed] [Google Scholar]
- 27.Ueki K., Kondo T., Kahn C. R. (2004) Mol. Cell. Biol. 24, 5434–5446 [DOI] [PMC free article] [PubMed] [Google Scholar]
- 28.Rui L., Yuan M., Frantz D., Shoelson S., White M. F. (2002) J. Biol. Chem. 277, 42394–42398 [DOI] [PubMed] [Google Scholar]
- 29.Rui L., Fisher T. L., Thomas J., White M. F. (2001) J. Biol. Chem. 276, 40362–40367 [DOI] [PubMed] [Google Scholar]
- 30.Sun X. J., Goldberg J. L., Qiao L. Y., Mitchell J. J. (1999) Diabetes 48, 1359–1364 [DOI] [PubMed] [Google Scholar]
- 31.Yarwood S. J., Borland G., Sands W. A., Palmer T. M. (2008) J. Biol. Chem. 283, 6843–6853 [DOI] [PubMed] [Google Scholar]
- 32.Sands W. A., Woolson H. D., Milne G. R., Rutherford C., Palmer T. M. (2006) Mol. Cell. Biol. 26, 6333–6346 [DOI] [PMC free article] [PubMed] [Google Scholar]
- 33.Ueno H., Shibasaki T., Iwanaga T., Takahashi K., Yokoyama Y., Liu L. M., Yokoi N., Ozaki N., Matsukura S., Yano H., Seino S. (2001) Genomics 78, 91–98 [DOI] [PubMed] [Google Scholar]
- 34.Kawasaki H., Springett G. M., Mochizuki N., Toki S., Nakaya M., Matsuda M., Housman D. E., Graybiel A. M. (1998) Science 282, 2275–2279 [DOI] [PubMed] [Google Scholar]
- 35.Bos J. L. (2003) Nat. Rev. Mol. Cell Biol. 4, 733–738 [DOI] [PubMed] [Google Scholar]
- 36.Holz G. G., Kang G., Harbeck M., Roe M. W., Chepurny O. G. (2006) J. Physiol. 577, 5–15 [DOI] [PMC free article] [PubMed] [Google Scholar]
- 37.Borland G., Bird R. J., Palmer T. M., Yarwood S. J. (2009) J. Biol. Chem. 284, 17391–17403 [DOI] [PMC free article] [PubMed] [Google Scholar]
- 38.Aromataris E. C., Roberts M. L., Barritt G. J., Rychkov G. Y. (2006) J. Physiol. 573, 611–625 [DOI] [PMC free article] [PubMed] [Google Scholar]
- 39.Oestreich E. A., Wang H., Malik S., Kaproth-Joslin K. A., Blaxall B. C., Kelley G. G., Dirksen R. T., Smrcka A. V. (2007) J. Biol. Chem. 282, 5488–5495 [DOI] [PubMed] [Google Scholar]
- 40.Riehle K. J., Campbell J. S., McMahan R. S., Johnson M. M., Beyer R. P., Bammler T. K., Fausto N. (2008) J. Exp. Med. 205, 91–103 [DOI] [PMC free article] [PubMed] [Google Scholar]
- 41.Wang H., Oestreich E. A., Maekawa N., Bullard T. A., Vikstrom K. L., Dirksen R. T., Kelley G. G., Blaxall B. C., Smrcka A. V. (2005) Circ. Res. 97, 1305–1313 [DOI] [PubMed] [Google Scholar]
- 42.Klover P. J., Clementi A. H., Mooney R. A. (2005) Endocrinology 146, 3417–3427 [DOI] [PubMed] [Google Scholar]
- 43.Senn J. J., Klover P. J., Nowak I. A., Mooney R. A. (2002) Diabetes 51, 3391–3399 [DOI] [PubMed] [Google Scholar]
- 44.Schmidt M., Evellin S., Weernink P. A., von Dorp F., Rehmann H., Lomasney J. W., Jakobs K. H. (2001) Nat. Cell Biol. 3, 1020–1024 [DOI] [PubMed] [Google Scholar]
- 45.Thoresen G. H., Johasen E. J., Christoffersen T. (1999) Cell Biol. Int. 23, 13–20 [DOI] [PubMed] [Google Scholar]
- 46.Woolson H. D., Thomson V. S., Rutherford C., Yarwood S. J., Palmer T. M. (2009) Cell Signal. 21, 1706–1715 [DOI] [PubMed] [Google Scholar]
- 47.Cheng X., Ma Y., Moore M., Hemmings B. A., Taylor S. S. (1998) Proc. Natl. Acad. Sci. U.S.A. 95, 9849–9854 [DOI] [PMC free article] [PubMed] [Google Scholar]
- 48.Moore M. J., Kanter J. R., Jones K. C., Taylor S. S. (2002) J. Biol. Chem. 277, 47878–47884 [DOI] [PubMed] [Google Scholar]
- 49.Taylor S. S., Yang J., Wu J., Haste N. M., Radzio-Andzelm E., Anand G. (2004) Biochim. Biophys. Acta 1697, 259–269 [DOI] [PubMed] [Google Scholar]
- 50.Sastri M., Barraclough D. M., Carmichael P. T., Taylor S. S. (2005) Proc. Natl. Acad. Sci. U.S.A. 102, 349–354 [DOI] [PMC free article] [PubMed] [Google Scholar]
- 51.Liu Y., Dentin R., Chen D., Hedrick S., Ravnskjaer K., Schenk S., Milne J., Meyers D. J., Cole P., Yates J., 3rd, Olefsky J., Guarente L., Montminy M. (2008) Nature 456, 269–273 [DOI] [PMC free article] [PubMed] [Google Scholar]
- 52.Goodman M. N., Larsen P. R., Kaplan M. M., Aoki T. T., Young V. R., Ruderman N. B. (1980) Am. J. Physiol. 239, E277–E286 [DOI] [PubMed] [Google Scholar]
- 53.Emanuelli B., Peraldi P., Filloux C., Sawka-Verhelle D., Hilton D., Van Obberghen E. (2000) J. Biol. Chem. 275, 15985–15991 [DOI] [PubMed] [Google Scholar]
- 54.Mohamed-Ali V., Goodrick S., Rawesh A., Katz D. R., Miles J. M., Yudkin J. S., Klein S., Coppack S. W. (1997) J. Clin. Endocrinol. Metab. 82, 4196–4200 [DOI] [PubMed] [Google Scholar]
- 55.Kern P. A., Ranganathan S., Li C., Wood L., Ranganathan G. (2001) Am. J. Physiol. Endocrinol. Metab. 280, E745–751 [DOI] [PubMed] [Google Scholar]
- 56.Ueki K., Kondo T., Tseng Y. H., Kahn C. R. (2004) Proc. Natl. Acad. Sci. U.S.A. 101, 10422–10427 [DOI] [PMC free article] [PubMed] [Google Scholar]
- 57.Wang Z. W., Pan W. T., Lee Y., Kakuma T., Zhou Y. T., Unger R. H. (2001) Faseb J. 15, 108–114 [DOI] [PubMed] [Google Scholar]
- 58.Hotamisligil G. S., Peraldi P., Budavari A., Ellis R., White M. F., Spiegelman B. M. (1996) Science 271, 665–668 [DOI] [PubMed] [Google Scholar]
- 59.Rui L., Aguirre V., Kim J. K., Shulman G. I., Lee A., Corbould A., Dunaif A., White M. F. (2001) J. Clin. Invest. 107, 181–189 [DOI] [PMC free article] [PubMed] [Google Scholar]
- 60.Paz K., Hemi R., LeRoith D., Karasik A., Elhanany E., Kanety H., Zick Y. (1997) J. Biol. Chem. 272, 29911–29918 [DOI] [PubMed] [Google Scholar]
- 61.Torisu T., Sato N., Yoshiga D., Kobayashi T., Yoshioka T., Mori H., Iida M., Yoshimura A. (2007) Genes Cells 12, 143–154 [DOI] [PubMed] [Google Scholar]
- 62.Ishizuka K., Usui I., Kanatani Y., Bukhari A., He J., Fujisaka S., Yamazaki Y., Suzuki H., Hiratani K., Ishiki M., Iwata M., Urakaze M., Haruta T., Kobayashi M. (2007) Endocrinology 148, 2994–3003 [DOI] [PubMed] [Google Scholar]
- 63.Lewis G. F., Vranic M., Giacca A. (1997) Am. J. Physiol. 272, E371–E378 [DOI] [PubMed] [Google Scholar]
- 64.Giacca A., Fisher S. J., McCall R. H., Shi Z. Q., Vranic M. (1997) Endocrinology 138, 999–1007 [DOI] [PubMed] [Google Scholar]


