Abstract
Amyloidogenic processing of the amyloid precursor protein (APP) by β- and γ-secretases generates several biologically active products, including amyloid-β (Aβ) and the APP intracellular domain (AICD). AICD regulates transcription of several neuronal genes, especially the Aβ-degrading enzyme, neprilysin (NEP). APP exists in several alternatively spliced isoforms, APP695, APP751, and APP770. We have examined whether each isoform can contribute to AICD generation and hence up-regulation of NEP expression. Using SH-SY5Y neuronal cells stably expressing each of the APP isoforms, we observed that only APP695 up-regulated nuclear AICD levels (9-fold) and NEP expression (6-fold). Increased NEP expression was abolished by a β- or γ-secretase inhibitor but not an α-secretase inhibitor. This correlated with a marked increase in both Aβ1–40 and Aβ1–42 in APP695 cells as compared with APP751 or APP770 cells. Similar phenomena were observed in Neuro2a but not HEK293 cells. SH-SY5Y cells expressing the Swedish mutant of APP695 also showed an increase in Aβ levels and NEP expression as compared with wild-type APP695 cells. Chromatin immunoprecipitation revealed that AICD was associated with the NEP promoter in APP695, Neuro2a, and APPSwe cells but not APP751 nor APP770 cells where AICD was replaced by histone deacetylase 1 (HDAC1). AICD occupancy of the NEP promoter was replaced by HDAC1 after treatment of the APP695 cells with a β- but not an α-secretase inhibitor. The increased AICD and NEP levels were significantly reduced in cholesterol-depleted APP695 cells. In conclusion, Aβ and functional AICD appear to be preferentially synthesized through β-secretase action on APP695.
Keywords: Alzheimer's Disease, Amyloid, Histone Deacetylase, Neurodegeneration, Secretases, Amyloid Precursor Protein
Introduction
A characteristic feature of Alzheimer disease (AD)5 is the presence in the brain of extracellular amyloid plaques composed of the amyloid β-peptide (principally Aβ1–40 and Aβ1–42), which is derived from the transmembrane amyloid precursor protein (APP). Hence, for almost two decades, the amyloid cascade hypothesis (1, 2) has driven much AD research with a focus on the prevention of Aβ accumulation or the enhancement of its clearance as primary therapeutic strategies. In the amyloidogenic pathway of APP metabolism, Aβ is formed through the sequential actions of β- and γ-secretases, whereas the non-amyloidogenic α-secretase pathway precludes Aβ formation. Enzymic clearance of Aβ is mediated by several enzymes, of which the metallopeptidase neprilysin (NEP) is a key contributor, and up-regulation of Aβ-degrading enzymes is a potential therapeutic strategy (3, 4).
Three major isoforms of APP are produced due to the alternative splicing of exons 7 and 8, which encode a 56-amino acid Kunitz-type proteinase inhibitor (KPI) domain and a 19-amino acid domain that shares sequence identity with the OX-2 antigen of thymus-derived lymphoid cells, respectively (5). The longest isoform, APP770, contains both the KPI and the OX-2 domains, whereas APP751 contains only the KPI domain. The shortest isoform, APP695, lacks both domains. In the brain, APP695 is expressed at high levels, and the APP751/770 isoforms are expressed at significantly lower levels, although there are regional differences, and it has been suggested that the balance between the KPI- and non-KPI-containing isoforms may be an important factor influencing Aβ deposition (6). In the AD brain (7–9) and in response to N-methyl-d-aspartate (NMDA) receptor stimulation (10, 11), there is an increase in the proportion of KPI- to non-KPI-containing isoforms of APP. This has led to the suggestion that the KPI-containing isoforms of APP can exert important neuroprotective functions, and thus their up-regulation in the AD brain or in response to excitotoxic insult may be to protect against further neuronal loss (12, 13).
A major unmet scientific need in the AD field is still to understand the normal function of APP (14). An added complexity is whether the different APP isoforms have similar or distinct localizations, metabolism, and roles (15). A long standing enigma in APP biology has additionally been the interplay between and physiological roles of the different proteolytic products produced from APP, which include the soluble ectodomains (potentially sAPPα and sAPPβ from each of the APP isoforms, the different forms of Aβ and its oligomers, and the APP intracellular domain, AICD). By analogy with the Notch intracellular domain (16), AICD has been proposed to act as a transcriptional regulator through its interaction with the adaptor protein Fe65 and its translocation to the nucleus, forming, together with a histone acetyltransferase (Tip60), a transcriptional complex (17) subsequently referred to as an AICD-Fe65-Tip 60 (AFT) complex (18, 19). Such “nuclear transcription factories” involving AICD have been directly visualized in nuclei by immunofluorescence microscopy (20). However, the identification and verification of target genes, such as the NEP gene (21), have been highly contentious (22, 23). We have unequivocally shown that AICD binds to the NEP promoters causing transcriptional activation and up-regulation of NEP mRNA, protein, and activity (24). Neuronal NEP expression is, on the other hand, repressed by deacetylation of histones, and histone deacetylase inhibitors such as valproic acid can reactivate NEP expression and hence may aid amyloid clearance (24–26).
In the present study, we have sought to understand the relative contributions of the different APP isoforms to the production of APP metabolites, especially Aβ, sAPPβ, AICD, and hence NEP up-regulation. We conclude that the distinct APP isoforms differ markedly in their ability to modulate NEP expression and that functional AICD production appears to be preferentially synthesized through a cholesterol-dependent endocytic pathway involving β-secretase action on the neuronal APP695 isoform. These observations have significant implications for the selective pharmacological manipulation of APP metabolites, especially the Aβ peptide, and hence for the development of AD therapeutics.
EXPERIMENTAL PROCEDURES
Cell Culture, Plasmids, Transfection, Treatments, and Sample Preparation
Human neuroblastoma cells (SH-SY5Y), murine neuroblastoma cells (Neuro2a; N2a), and human embryonic kidney cells (HEK293) were maintained at 37 °C in Dulbecco's modified Eagle's medium (DMEM) (Lonza, Basel, Switzerland) containing 10% fetal bovine serum in a humidified atmosphere of 5% CO2, 95% air. The cDNA encoding human APP695, APP751, or APPSwe was inserted into the expression vector pIREShyg, and the cDNA encoding human APP770 was inserted into pIREShyg2 (Clontech) before being stably transfected into SH-SY5Y, N2a, or HEK293 cells. DNA (30 μg) was introduced into the cells by electroporation in 4-mm cuvettes with a pulse of 250 V and 1650 microfarads using the ECM630 electroporator (BTX Harvard Apparatus, Holliston, MA). Selection for cells containing the required construct was performed in normal growth medium with 0.15 mg/ml hygromycin B (Invitrogen, Paisley, UK). Cells were grown to 90–100% confluency, washed twice with phosphate-buffered saline (PBS; 1.5 mm KH2PO4, 2.7 mm Na2HPO4, 150 mm NaCl, pH 7.4), and incubated in 10 ml of serum-free Opti-MEM (Invitrogen) for 24 h. Conditioned medium was harvested, and 5 ml was concentrated to 200 μl using 10-kDa cut-off Vivaspin filtration columns (Millipore, Billerica, MA). The remaining 5-ml conditioned media sample from the SH-SY5Y cells was used for analysis of Aβ1–40 and Aβ1–42 by ELISA. Cells were washed twice in PBS, harvested, and pelleted by centrifugation. Cell pellets were stored at −20 °C for chromatin immunoprecipitation (ChIP) analysis or used for cell lysate preparation. For cell lysates, cells were incubated in radioimmune precipitation buffer (150 mm NaCl, 1% (v/v) Nonidet P-40, 0.5% (w/v) sodium deoxycholate, 50 mm Tris/HCl, pH 8.0) with a protease inhibitor mixture (Sigma-Aldrich, Gillingham, Dorset, UK) for 20 min on ice. Lysates were clarified by centrifugation at 13,000 × g for 10 min. For subcellular fractionation of SH-SY5Y cells into nuclear and non-nuclear fractions, the procedure was modified from Ref. 27. Cells were harvested, washed twice in PBS, pelleted, and then resuspended in 200 μl of buffer (10 mm Tris/HCl, pH 8.0, 0.5 m NaCl, 1% Triton X-100, 10% glycerol, 1 mm PMSF, Complete protease inhibitor mixture (Roche Diagnostics)) on ice for 20 min. Lysates were homogenized through 22-G needles 10 times and then pelleted at 4 °C for 5 min at 8000 × g. The supernatant was collected as the non-nuclear sample. Nuclear pellets (DNA-bound protein) were resuspended in 100 μl of buffer and sonicated 3 × 10 s before being pelleted at 4 °C for 10 min at 11,000 × g. The protein concentration of the samples was determined using bicinchoninic acid (Sigma Aldrich). The inhibitors of α-secretase (TAPI-2) and β-secretase (βIV) were obtained from Calbiochem.
Cholesterol Depletion of Cells
For cholesterol depletion, SH-SY5Y cells stably overexpressing APP695 were treated with 5 mm methyl-β-cyclodextrin (Sigma-Aldrich) in DMEM for 1 h. Control cells were treated with water in DMEM for an equal length of time. Cells were grown and harvested, and cell lysates were prepared as described above.
SDS-PAGE and Western Blot Analysis
Samples (30 or 40 μg of protein) were resolved on 7–17% polyacrylamide gels or, for AICD detection, 10–20% Tricine gels (Invitrogen) and transferred to Hybond-P polyvinylidene difluoride membranes (Amersham Biosciences, Little Chalfont, Buckinghamshire, UK). The membranes were then blocked overnight at 4 °C in PBS containing 0.1% (v/v) Tween 20 and 5% (w/v) dried milk powder. Media sample membranes were incubated with either anti-sAPP antibody 22C11 (Millipore) or anti-sAPPα antibody 6E10 (Covance, Cambridge, UK) at a dilution of 1:4000 or with anti-sAPPβ antibody 1A9, which recognizes a neoepitope on sAPPβ formed after BACE1 cleavage of APP (28), at a dilution of 1:2500. Lysate sample membranes were incubated with anti-APP antibody 22C11, anti-CD10 (Novocastra Laboratories, Newcastle, UK), or anti-actin antibody AC15 (Sigma-Aldrich). Nuclear fractions were incubated with anti-amyloid precursor protein C-terminal antibody (Sigma-Aldrich) at a dilution of 1:500. Membranes were then washed in PBS containing 0.05% Tween 20 before incubation with peroxidase-conjugated rabbit anti-mouse or donkey anti-rabbit secondary antibodies (Sigma-Aldrich) at a dilution of 1:4000 before detection with the enhanced chemiluminescence method (Thermo Fischer Scientific) and analyzed using Aida two-dimensional densitometry.
Aβ ELISA Analysis
Sandwich ELISAs for the detection of human Aβ1–40 and Aβ1–42 were performed as described previously (29). Briefly, 96-well microtiter plates were coated overnight at 4 °C with primary antibodies against Aβ1–40 (33.1.1) and Aβ1–42 (2.1.3.35.86) (a kind gift from C. and E. Eckman, Mayo Clinic, Jacksonville, FL). Following blocking and incubation with conditioned media, bound Aβ peptides were detected with HRP-conjugated detection antibody (Aβ1–40, 13.1.1-HRP (C. and E. Eckman); Aβ1–42, 4G8-HRP (Covance)).
Gene Expression Analysis
Cell RNA was prepared using the RNeasy extraction kit (Qiagen, Crawley, UK) according to the manufacturer's protocol. RNA was treated with DNase I (Invitrogen), and cDNA was prepared using the iScript cDNA kit (Bio-Rad). cDNA was amplified using conventional PCR or real-time PCR as in Zuccato et al. (30). DNA amplified by conventional PCR was analyzed in 2% agarose gels containing ethidium bromide (1 μg/ml) and visualized on a Molecular Imager Gel Doc XR system with the Quantity One 4.6.1 program (Bio-Rad). Image densitometry was performed using the Aida Array Analyzer 4.15 software. Real-time PCR was performed in an iCycler thermal cycler with multicolor PCR detection system (Bio-Rad) using SYBR Green (Bio-Rad) incorporation, and expression was reported relative to actin mRNA.
ChIP Analysis
ChIP was performed as described previously (24). Cells were fixed, extracts were sonicated, and primary antibodies were applied following treatment with protein G-Sepharose, decross-linking, and DNA extraction and analysis by real-time PCR. Real-time PCR data are represented as the -fold of enrichment of DNA pulled down with the specific antibody over that immunoprecipitated with IgG. Antibodies used in ChIP experiments were: anti-AICD (BR188) (31), a generous gift from Dr. M. Goedert (Cambridge, UK); anti-Aβ (6E10); and anti-HDAC1 and IgG from Abcam.
Statistics
Results were compared using a one-way analysis of variance to compare sample means with a Bonferroni correction to determine differences between group samples or by an unpaired two-tailed Student's t test with a threshold of p < 0.05.
RESULTS
Characterization of Cell Lines Expressing the Different APP Isoforms
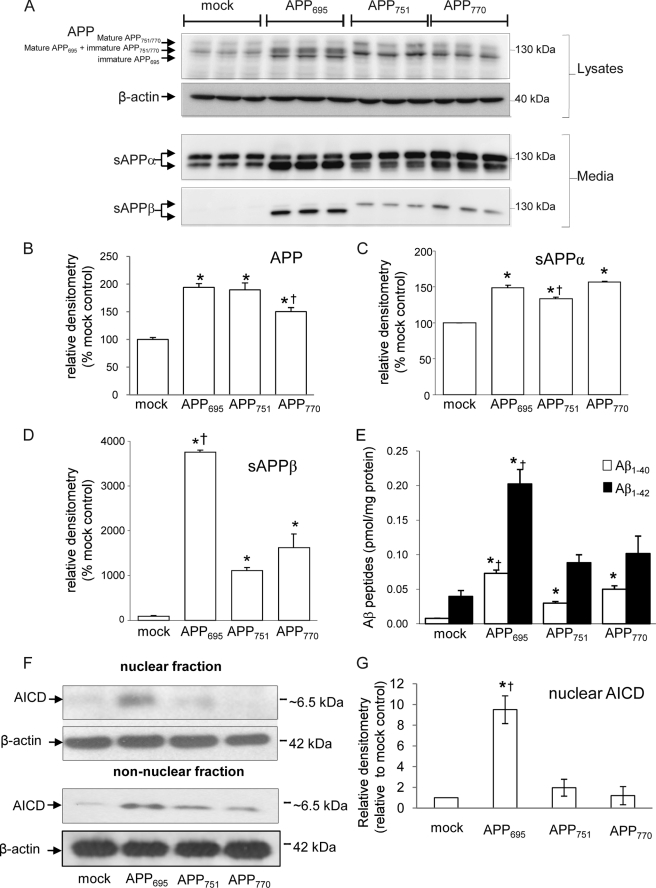
To compare the processing of the different isoforms of APP and their effects on gene expression, stable lines of the human neuroblastoma, SH-SY5Y, expressing each of the three isoforms were constructed and characterized by electrophoresis and immunoblotting of media and lysate samples. The levels of APP expression as assessed in lysate preparations were significantly greater in all three isoform-expressing cell lines than in the mock-transfected cell line (Fig. 1, A and B) and were identical in the APP695- and APP751-expressing cell lines and slightly reduced (by 22%) in the APP770 cell line as compared with the APP695 line (Fig. 1, A and B). The amount of sAPPα in the conditioned media was significantly increased in all three isoform-expressing cell lines as compared with the mock-transfected line (Fig. 1, A and C). The sAPPα levels were similar between the APP695 and APP770 cell lines but slightly decreased (by 10%) in the APP751 as compared with the APP695 cell line (Fig. 1, A and C). However, the level of sAPPβ in the medium from the APP695-expressing cells was significantly (∼3–4-fold) higher than from the APP751- or APP770-expressing cells (Fig. 1, A and D). ELISA analysis of Aβ1–40 and Aβ1–42 levels in conditioned media from the cell lines demonstrated that Aβ1–40 was increased in all the APP-overexpressing cell lines as compared with the mock-transfected cells, although proportionately more in the APP695 cells (Fig. 1E). However, Aβ1–42 in the conditioned media was significantly increased over the mock-transfected cells only in the APP695-expressing cells (Fig. 1E). The increase in sAPPβ and Aβ peptides, particularly Aβ1–42, indicates that APP695 is preferentially metabolized via the β-secretase pathway as compared with APP751 and APP770. Fractionation of the cells coupled with immunoblotting for AICD revealed that nuclear AICD is only significantly different from the mock-transfected control in the APP695-overexpressing cell line (∼9-fold increase), whereas all three overexpressing cell lines possess immunoreactive AICD in the non-nuclear (cytoplasmic) fraction (Fig. 1, F and G).
FIGURE 1.
APP processing in SH-SY5Y cells expressing the different APP isoforms. A, Western blot of APP and actin in cell lysates and of sAPPα and sAPPβ in conditioned media from SH-SY5Y mock-transfected and APP695-, APP751-, or APP770-expressing SH-SY5Y cells. B–D, densitometric analysis of APP (B), sAPPα (C), and sAPPβ (D). E, ELISA analysis of Aβ1–40 and Aβ1–42 levels in conditioned media from the cell lines. F, Western blot of AICD and actin in nuclear and non-nuclear fractions isolated from SH-SY5Y mock-transfected and APP695-, APP751-, or APP770-expressing SH-SY5Y cells. G, densitometric analysis of AICD levels (normalized to actin) from the nuclear fraction of SH-SY5Y cells. Data represent mean ± S.E. (n = 3); *, p < 0.05 as compared with mock-transfected control, †, p < 0.05 as compared with other APP isoform cell lines.
To explore the generality of this phenomenon in other cell lines, the APP isoforms were also overexpressed in another neuronal line (N2a) and a non-neuronal cell line (HEK293) (supplemental Fig. S1). In N2a cells, sAPPβ levels were highest in the APP695 cells (supplemental Fig. S1, A and C), as in SH-SY5Y (Fig. 1D), whereas in HEK cells, the sAPPβ levels did not differ significantly between the mock-transfected and any of the isoform-overexpressing cell lines (supplemental Fig. S1, D and F).
Neprilysin Expression Is Up-regulated Selectively in APP695 Cells in a γ-Secretase- and AICD-dependent Manner
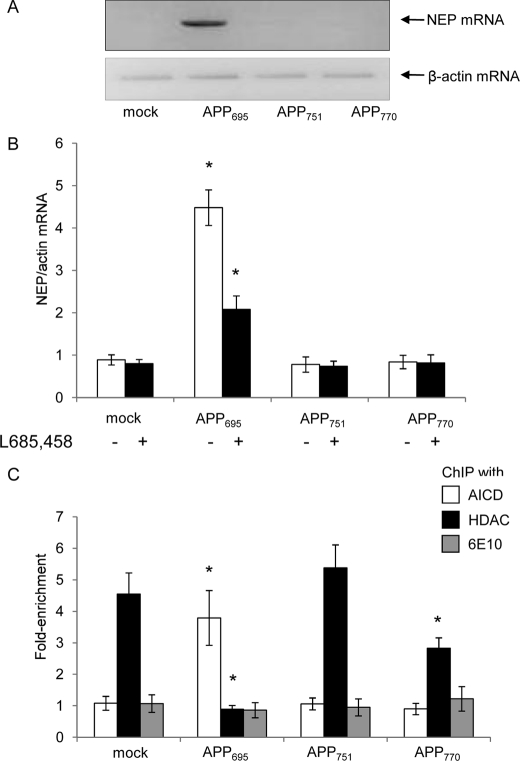
We and others (21, 24) have previously shown that expression of the amyloid-degrading enzyme, NEP, is regulated by APP in a mechanism involving γ-secretase-mediated APP processing producing AICD, which, in turn, transactivates the NEP promoters. Hence, we compared the expression level of NEP in the different APP isoform-expressing cell lines as a marker for AICD-mediated gene transactivation. Initial studies comparing NEP expression in the different SH-SY5Y cell lines by conventional PCR suggested that there was a marked difference in expression levels between the cell lines, with APP695 having the highest level of NEP mRNA (Fig. 2A). This was subsequently confirmed by quantitative, real-time PCR where it was seen that NEP expression levels did not differ between the mock-transfected and APP751- and APP770-expressing cells (Fig. 2B). However, NEP levels were ∼6-fold higher in the APP695-expressing cells than in the mock-transfected cells, and this elevated expression was significantly reduced on treatment with the γ-secretase inhibitor L685,458 (Fig. 2B). To establish whether this specific up-regulation of NEP in the APP695-expressing cells was mediated via AICD and histone acetylation, ChIP with an anti-AICD or an anti-HDAC1 antibody followed by real-time PCR was applied. Only in the APP695-expressing cells was any enrichment of AICD seen on the NEP promoter (Fig. 2C). Conversely, the APP751- and APP770-expressing cells both showed significant enrichment of the promoter with HDAC1 consistent with repression of transcription (Fig. 2C). Because Aβ itself has been proposed to act as a transcription factor, e.g. in activation of the p53 promoter (32), ChIP analysis was also performed with an antibody recognizing Aβ (6E10), but no enrichment of the NEP promoter was observed (Fig. 1C) in any of the cell lines, ruling out this possibility.
FIGURE 2.
Analysis of NEP expression and NEP promoter occupancy in SH-SY5Y cells expressing the various APP isoforms in the presence or absence of the γ-secretase inhibitor, L685,458. A, comparative analysis by conventional PCR of NEP mRNA expression in the mock-transfected and the APP695-, APP751-, and APP770-expressing SH-SY5Y cell lines with actin mRNA as loading control. B, effect of the γ-secretase inhibitor L685,458 on NEP expression in control and APP-overexpressing SH-SY5Y cell lines. Data are expressed as the ratio of NEP expression to actin expression and represent mean ± S.E. (n = 5); *, p < 0.05 as compared with mock-transfected control. C, chromatin immunoprecipitation analysis of SH-SY5Y cells expressing the various APP isoforms. Control and APP-expressing SH-SY5Y cells were fixed, and chromatin was immunoprecipitated with anti-AICD, -HDAC1, or -Aβ antibodies. DNA pulled down by the antibody was analyzed by real-time PCR with primers specific to the NEP promoter 2. The results represent enrichment of DNA pulled down with the anti-AICD, anti-HDAC1, or anti-Aβ antibody versus non-immune IgG. Data represent mean ± S.E. (n = 5); *, p < 0.05 as compared with mock-transfected control.
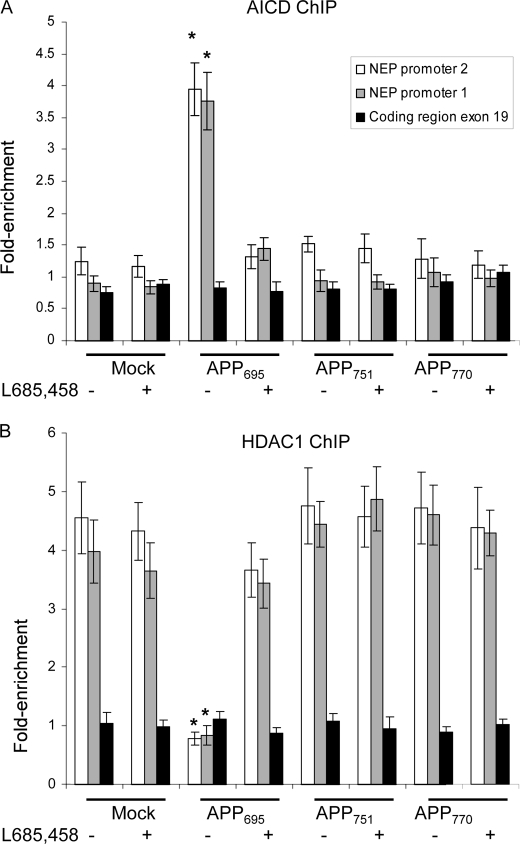
The expression of the NEP gene can be controlled through two distinct promoters (33, 34), both of which can be active in neuronal cell types, and in particular, in SH-SY5Y cells (24). For completeness, we therefore extended the ChIP analysis to examine interaction of AICD or HDAC1 with both NEP promoters and with a coding region (exon 19) of the gene. Anti-AICD was seen to pull down both NEP promoters only in the APP695-overexpressing cell line; exon 19 was not precipitated (Fig. 3A). Again, treatment of the cells with the γ-secretase inhibitor L685,458 eliminated AICD interaction with the promoters, and only anti-HDAC1 was now able to pull down the NEP promoters (Fig. 3B) in the APP695 line. In the other cell lines (mock-transfected and APP751- and APP770-expressing), HDAC1 was associated with both promoters, but not exon 19, in the absence or presence of L685,458.
FIGURE 3.
Chromatin immunoprecipitation analysis of mock-transfected and APP-expressing SH-SY5Y cells with anti-AICD or anti-HDAC1 antibodies. Mock-transfected SH-SY5Y cells or cells expressing the various APP isoforms were incubated with or without the γ-secretase inhibitor, L685,458, as described under “Experimental Procedures.” Cells were fixed, and chromatin was immunoprecipitated with anti-AICD (A) or anti-HDAC1 (B) antibodies. DNA pulled down by the antibody was analyzed by real-time PCR with primers specific to NEP promoters 1 and 2 or for part of the coding region (exon 19). The results represent enrichment of DNA pulled down with the anti-AICD or anti-HDAC1 antibodies versus non-immune IgG. Data represent mean ± S.E. (n = 5); *, p < 0.05 as compared with mock-transfected control.
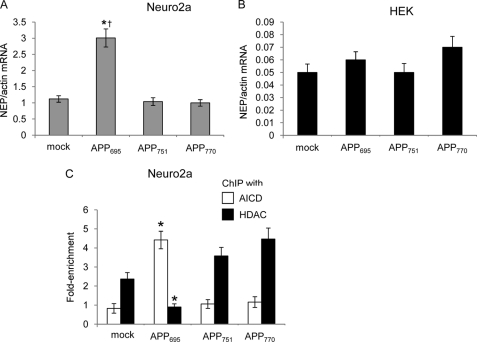
Next, the effects of overexpressing the APP isoforms in the N2a and HEK293 cells were compared. In the N2a lines, NEP expression was significantly up-regulated only in the APP695-overexpressing line, which correlated with the ability of anti-AICD, but not anti-HDAC1, to pull down the NEP promoter (Fig. 4, A and C). However, levels of NEP mRNA expression did not differ between mock-transfected and APP-overexpressing lines in the HEK293 cells (Fig. 4B).
FIGURE 4.
Analysis of NEP expression in Neuro2a and HEK293 cells and of NEP promoter occupancy in Neuro2a cells expressing the different APP isoforms. A, NEP expression in control and APP-overexpressing N2a cell lines. B, NEP expression in control and APP-overexpressing HEK cell lines. C, chromatin immunoprecipitation analysis of control and APP-overexpressing N2a cells with anti-AICD or anti-HDAC1 antibodies. Data represent mean ± S.E. (n = 3); *, p < 0.05 as compared with mock-transfected control, †, p < 0.05 as compared with other APP isoform cell lines.
NEP Expression Is Blocked by β-Secretase but Not α-Secretase Inhibition
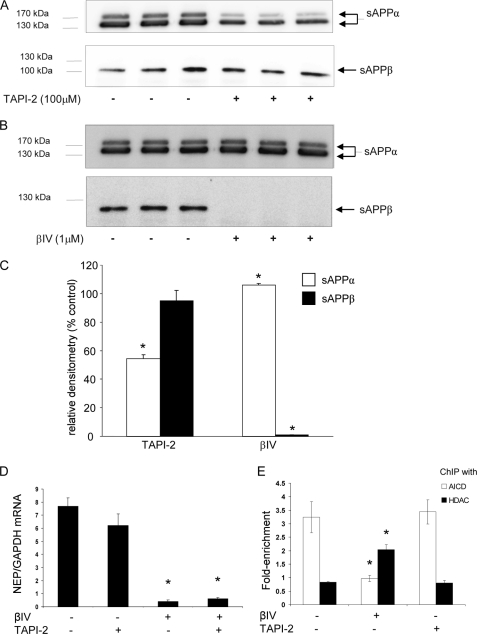
The effects of α- or β-secretase inhibition were next examined on APP metabolism and NEP expression in the SH-SY5Y cells expressing APP695 because these cells represented the only line to show significant changes in the level of NEP expression. The levels of sAPPα and sAPPβ in the conditioned medium of these cells treated with either the α-secretase inhibitor, TAPI-2, or the β-secretase inhibitor, βIV, were compared. As expected, treatment with TAPI-2 significantly decreased the level of sAPPα in the medium, but the level of sAPPβ was unchanged (Fig. 5, A and C). Conversely, treatment of the cells with βIV virtually eliminated sAPPβ with a small but significant increase in sAPPα observed (Fig. 5, B and C). When the effects of the inhibitors were compared on NEP expression in the APP695-expressing cells, only β-secretase inhibition significantly reduced NEP expression (Fig. 5D). To supplement these data, ChIP analysis was performed on cells after treatment with TAPI-2 or βIV. As before, AICD was found to interact with the NEP promoter in the APP695-expressing cells, and this interaction was not affected by treatment with TAPI-2 (Fig. 5E). However, treatment with βIV caused loss of AICD and increased binding of HDAC1 to the promoter. In contrast, no increase in HDAC1 binding after βIV treatment was seen in the APP751- and APP770-expressing cells (data not shown).
FIGURE 5.
The effects of α- or β-secretase inhibition on the soluble forms of APP and on NEP expression and ChIP analysis in SH-SY5Y cells expressing APP695. A and C, Western blot (A) and densitometric analysis (C) of sAPPα and sAPPβ levels in the conditioned medium of cells treated with the α-secretase inhibitor, TAPI-2 (100 μm), for 5 h. B and C, Western blot (B) and densitometric analysis (C) of sAPPα and sAPPβ levels in the conditioned medium of cells treated with the β-secretase inhibitor, βIV (1 μm), for 24 h. D, effects of α-secretase and/or β-secretase inhibition on NEP expression in SH-SY5Y APP695 cells. Cells treated as above with TAPI-2 or βIV were analyzed for NEP expression levels, and data are expressed as the ratio of NEP expression to GAPDH expression. Data are shown as mean ± S.E. (n = 3); *, p < 0.05 as compared with control levels. E, APP695 cells were treated with the α-secretase inhibitor, TAPI-2 (100 μm), or with the β-secretase inhibitor, βIV (1 μm), as above and fixed, and chromatin was immunoprecipitated with either the anti-AICD or the anti-HDAC1 antibodies, as described under “Experimental Procedures.” DNA pulled down by the antibody was analyzed by real-time PCR with primers specific to the NEP promoter 2. The data are presented as the -fold of enrichment of DNA pulled down with anti-AICD or anti-HDAC1 antibodies versus non-immune IgG. Data represent mean ± S.E. (n = 5); *, p < 0.05 for APP695 cells as compared with uninhibited control after treatment with β-secretase inhibitor.
AICD-mediated Gene Expression Is Increased from the Swedish Mutant of APP
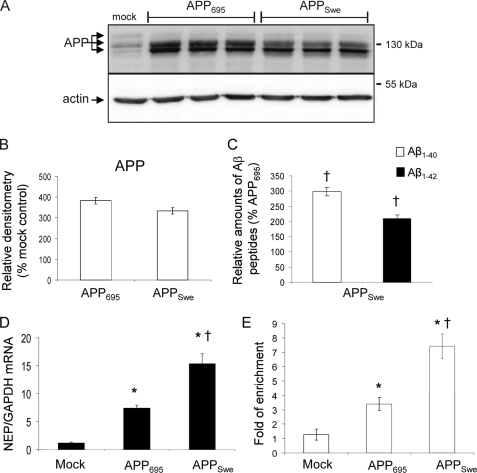
As the Swedish mutant of APP is preferentially cleaved by BACE1 as compared with the wild-type protein (35), we determined whether there was an increase in functional AICD from this isoform. Wild-type APP695 (APP695) or Swedish mutant APP695 (APPSwe) were expressed in the SH-SY5Y cells at comparable levels (Fig. 6, A and B). Consistent with previous reports (35, 36), the amounts of both Aβ1–40 and Aβ1–42 were significantly increased (by 2–3-fold) in the APPSwe-expressing cells as compared with the APP695 cells (Fig. 6C). The level of NEP expression was also increased significantly (2-fold) in the APPSwe-expressing cells as compared with the APP695 cells (Fig. 6D), and there was an increased enrichment of AICD on the NEP promoter in the APPSwe cells (Fig. 6E), consistent with the increased flux through the β-secretase/AICD pathway.
FIGURE 6.
Changes in Aβ levels and NEP expression with the APPSwe mutation. A, Western blot of APP and actin in cell lysates from SH-SY5Y mock-transfected and APP695- and APPSwe-expressing SH-SY5Y cells. B, densitometric analysis of APP levels. C, relative amounts of Aβ1–40 and Aβ1–42 in conditioned medium from the APPSwe cells as compared with the APP695 cells. D, NEP expression in SH-SY5Y mock-transfected (control) and APP695- and APPSwe-expressing SH-SY5Y cells. Data are expressed as the ratio of NEP expression to GAPDH expression. E, chromatin immunoprecipitation with the anti-AICD antibody, as described under “Experimental Procedures.” DNA pulled down by the antibody was analyzed by real-time PCR with primers specific to the NEP promoter 2. The data are presented as the -fold of enrichment of DNA pulled down with anti-AICD versus non-immune IgG. Data represent mean ± S.E. (n = 3); *, p < 0.05 as compared with the mock-transfected control; †, p < 0.05 as compared with the wild-type APP695 cell line.
Cholesterol Depletion Decreases AICD Production and NEP Expression in APP695-overexpressing SH-SY5Y Cells
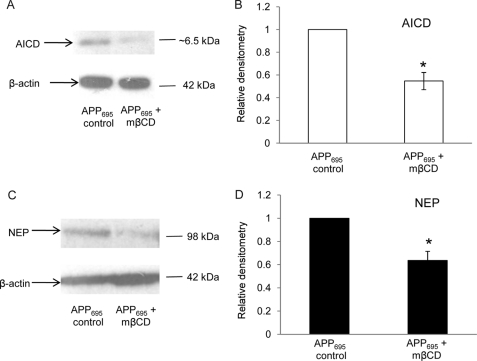
The amyloidogenic pathway in neuronal cells is initiated in the cholesterol-enriched membrane lipid rafts where β- and γ-secretases co-localize (37, 38). To explore whether the selective production of transcriptionally active AICD in APP695-overexpressing SH-SY5Y cells is also a cholesterol-mediated event, the APP695 cells were subjected to cholesterol depletion by treatment with methyl β-cyclodextrin as described previously (37). After treatment, which reduced cholesterol levels by ∼30%, the levels of AICD and NEP were assessed by immunoblotting. AICD levels were reduced by ∼50% after treatment (Fig. 7, A and B), and NEP levels were reduced by ∼40% (Fig. 7, C and D).
FIGURE 7.
Effects of cellular cholesterol depletion on AICD and NEP expression levels in SH-SY5Y cells expressing APP695. SH-SY5Y cells overexpressing APP695 were treated with 5 mm methyl-β-cyclodextrin as described under “Experimental Procedures,” and subsequently, lysates were prepared and analyzed by immunoblotting for levels of AICD and NEP protein. A, Western blot of AICD and actin in control cells and cells treated with mβCD. B, densitometric analysis of AICD levels (normalized to actin) from the SH-SY5Y cells. C, Western blot of NEP and actin in control cells and cells treated with mβCD. D, densitometric analysis of NEP levels (normalized to actin) from the SH-SY5Y cells. Data represent mean ± S.E. (n = 3); *, p < 0.05 as compared with untreated cells.
DISCUSSION
Understanding of the physiology and functions of APP has been highly influenced by an amyloid-centric perspective of the protein despite the heterogeneity of its expression and its processing into multiple metabolites in discrete cellular compartments. Hence, the overall complexity of the APP metabolic network and its regulation have rarely been addressed in their entirety. No clear-cut functional differences have been ascribed to the three isoforms of the APP protein (695, 751, 770) apart from a protease inhibitory role for the KPI-containing additional domain present in both APP751 and APP770 (39). The tissue-specific expression of APP does, however, imply distinct functional and metabolic roles for the isoforms. We have tested this hypothesis by comparing the ability of the APP isoforms to mediate amyloidogenic processing to produce Aβ and AICD, monitoring the latter through its enhancement of specific gene transcription. We have further established that this pathway is predetermined by the nature of the ectodomain processing of APP.
Although all three APP isoforms are potentially amyloidogenic, the levels of the β-secretase cleavage product sAPPβ, along with both Aβ1–42 and Aβ1–40, were significantly higher in the SH-SY5Y cells expressing APP695 than in the APP751- or APP770-expressing cells. To our knowledge, this is the first time that preferential amyloidogenic processing of the APP695 isoform has been demonstrated in neuronal cells. However, it has been reported previously that in both human brain and cerebrospinal fluid, an antibody to the initial part of the Aβ sequence recognized only the soluble forms of APP that were also reactive to antibodies against the KPI domain, leading to the suggestion that Aβ may be generated in vivo in humans specifically from the non-KPI 695 isoform (40, 41). The increased expression of the KPI-containing isoforms of APP in the brain of AD patients (7–9) and following excitotoxic, ischemic, or oxidative insult (10–12) may thus reflect a neuroprotective process to reduce the production of Aβ, particularly the more amyloidogenic Aβ1–42, from the 695 isoform.
The regulated intramembrane processing of APP by γ-secretase appears to require prior shedding of its ectodomain by the actions of either the α-secretase, mediated by one or more metalloproteinases, or the β-secretase BACE1 (42, 43). γ-Secretase-mediated processing of the C-terminal “stub” of APP formed by α- or β-secretase cleavage then generates the AICD and either the fragment p3 (from α-secretase action) or Aβ (from β-secretase action) (44). Elucidating the physiological roles of AICD has proved elusive, in part because of its lability if present in the cytosolic compartment (45). It is, however, protected against degradation when channeled through endosomal compartments to the nucleus. Cao and Südhof (17) first reported that AICD could stimulate reporter gene activation, and the peptide has been localized in so-called nuclear transcription factories alongside the Notch intracellular domain (18, 19). Several target genes for AICD have subsequently emerged, including the amyloid-degrading enzyme NEP, providing a novel feedback mechanism limiting amyloid accumulation (21, 24). However, a number of studies have failed to observe AICD-mediated transcriptional activation in a variety of model systems (22, 23). These anomalies have never been satisfactorily resolved but may well reflect the use of artificial constructs employing truncated forms of APP rather than the intact protein and/or the use of non-neuronal cell lines. Nevertheless, chromatin immunoprecipitation studies have shown that AICD interacts with the promoters for NEP and that this binding correlates inversely with that of HDAC1 (24). Transcriptional activation of NEP expression therefore now represents a well validated model of AICD functional activity.
Unlike APP751 and APP770, the tissue distribution of APP695 is much more restricted and, like its processing enzyme BACE1, it is predominantly neuronally localized, suggesting that the β-secretase pathway may be a preferred route for APP695 metabolism in neurons. Some recent evidence would support this viewpoint (20, 46), although direct competition between the α- and β-secretase pathways has more commonly been assumed. Using a cell-based Gal4-driven luciferase reporter gene assay for γ-secretase-mediated cleavage of APP, Hoey et al. (46) showed that treatment of mouse primary cortical neurons with an α-secretase inhibitor (TAPI-1) stimulated luciferase activity, whereas a β-secretase inhibitor (C3) substantially decreased luciferase activity. This led to the conclusion that in these neurons, the β-secretase amyloidogenic pathway of APP metabolism primarily mediates AICD-dependent nuclear signaling (46). Subsequently, Goodger et al. (20) demonstrated that by blocking endocytosis or inhibiting β-secretase, translocation of AICD to the nucleus was reduced. These two studies are consistent with a preferred β-secretase pathway for AICD production, although neither study monitored direct AICD promoter binding nor its effect on endogenous gene expression. In apparent contradiction to these studies, Sala Frigerio et al. (47) have recently reported that β-secretase cleavage is not required for the generation of AICD. However, in these studies, cellular AICD levels were detected only by immunoblotting and, again, functional gene responses were not monitored.
We have therefore endeavored to resolve these major ambiguities and establish which APP metabolic pathway(s) is/are responsible for the functional activity of AICD. Furthermore, for the first time, we have compared the abilities of the different APP isoforms to act as substrates for nuclear AICD generation as monitored by cell fractionation studies, gene expression, and ChIP analysis. By comparing SH-SY5Y cells overexpressing each of the APP isoforms, we were initially struck by the marked enhancement of endogenous NEP mRNA expression detected in the APP695-expressing cells as compared with mock-transfected or APP751- and APP770-expressing cells. This up-regulation in APP695 cells was entirely dependent on both β-secretase and γ-secretase activity and reflected direct binding of AICD to the NEP promoters as monitored by ChIP. In contrast, the APP751- and APP770-expressing cells showed enrichment of HDAC1 binding, but not AICD, on the promoters, consistent with transcriptional repression. We have further established that inhibition of β-secretase caused the replacement of AICD by HDAC1 on the NEP promoter in the APP695-expressing cells, whereas α-secretase inhibition did not affect AICD binding to the NEP promoter, nor the levels of endogenous NEP mRNA expression. All three APP isoforms were able to produce a significant increase in Aβ1–40 levels as compared with mock-transfected cells, whereas only APP695-overexpressing cells produced a significant increase in Aβ1–42 peptide. Hence, these data establish that the β-secretase, amyloidogenic pathway acting on APP695 is the predominant pathway generating Aβ1–42 and AICD and mediating gene regulation. These conclusions are further supported by the demonstration that Aβ production and AICD-mediated regulation of NEP expression are additionally enhanced in cells expressing the Swedish mutant APP695. Furthermore, another neuronal line, Neuro2a, also showed enhanced AICD occupancy of the NEP promoter and up-regulation of NEP expression only in cells overexpressing the 695 isoform. In contrast, a non-neuronal cell line, HEK293, failed to show this effect, demonstrating neuronal specificity.
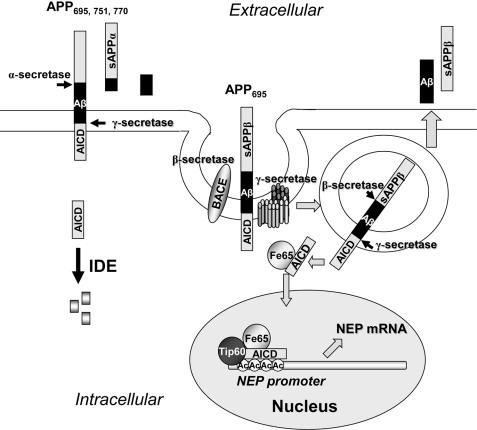
Taken together, our observations may well explain the controversy that has surrounded functional activity for AICD because transcriptional effects in model cell lines will depend critically on the nature and integrity of the APP constructs that are used. Furthermore, the total cellular levels of AICD, as monitored by immunoblotting (48), may not reflect the minor pool of AICD generated by β-secretase that is functionally active in regulating gene transcription. The mechanism underlying the functional differences between the APP isoforms appears to reflect the preferential transit of APP695 through a cholesterol-dependent and cholesterol-mediated endocytic pathway, consistent with previous reports implicating lipid raft involvement in the amyloidogenic pathway (48, 49). These pathways are summarized in Fig. 8, showing the distinct cleavage of APP (all isoforms) at the plasma membrane by α-secretase (50) and showing the preferential cleavage of APP695 by β-secretase in a subpopulation of BACE1-containing endosomes following their co-localization in lipid rafts and endocytosis (48, 49). Retrograde transport of AICD to the nucleus is presumed to be stabilized by formation of a protein complex with Fe65 and possibly other proteins (20). In contrast, cytosolic AICD formed at the plasma membrane via the non-amyloidogenic pathway is known to be rapidly metabolized by insulin-degrading enzyme and hence is non-functional (45).
FIGURE 8.
A model for the endocytosis and nuclear delivery of transcriptionally active AICD. APP695 is sequestered along with BACE1 and γ-secretase complexes into lipid raft domains, and processing of the APP occurs following endocytosis where the acidic interior environment favors the catalytic action of the secretases (46), which are aspartic proteinases. The AICD, in combination with Fe65, is delivered to the nucleus by retrograde transport (20), where it can facilitate specific gene transcription, e.g. of the NEP gene (21, 24). In contrast, the predominant action of the metalloenzyme α-secretase on APP isoforms occurs at the cell surface. The subsequent action of γ-secretase releases AICD into the cytosol, where it can be degraded by insulin-degrading enzyme (IDE) (41). Ac, acetyl.
A number of factors may underlie these metabolic differences, reflecting differential compartmentation, distinct secretase/substrate kinetics, and/or the involvement of different adapter proteins modulating secretase actions. Sequestration of the APP isoforms into distinct endosomal populations must precede β-secretase action because once the APP ectodomain is removed by β-secretase, the residual substrate for γ-secretase is identical in all cases. This differential compartmentation may reflect the distinct ligand-induced internalization of APP751 and APP770, as compared with APP695, through forming complexes with ligands of protease nexin 2 such as the low density lipoprotein receptor-related protein (LRP), which can mediate neurite outgrowth (51–53). Additionally, APP695 associates with assembled NMDA receptors, which has led to speculation that APP may function as a regulator of intracellular trafficking mechanisms (54). Such a mechanism could deliver the APP isoforms to different internal compartments, which may contain distinct γ-secretase protein complexes generating different end products. In conclusion, these data emphasize the need for a much fuller understanding of the APP interactome and the influence of these interactions on the trafficking and metabolism of the different APP isoforms. Aβ1–42 and AICD may both contribute to AD pathology (55). Our observations could therefore have novel therapeutic implications because if APP695 generates predominantly both metabolites, manipulating this isoform may provide a selective advantage.
Acknowledgments
We thank Drs. C. and E. Eckman (Mayo Clinic, Jacksonville, FL) for the provision of the antibodies for detection of Aβ by ELISA and Dr J. P. Boyle (University of Leeds, UK) for supplying the stable SH-SY5Y cell line incorporating APPSwe.
This work was supported by grants from the United Kingdom Medical Research Council (Grants G9824728, G0501565, and G0802189) and the Alzheimer's Research Trust (Grants ART/PG2008/2 and ART/PhD2009/4).
♦ This article was selected as a Paper of the Week.

The on-line version of this article (available at http://www.jbc.org) contains supplemental Fig. S1.
- AD
- Alzheimer disease
- Aβ
- amyloid β
- AICD
- amyloid precursor protein intracellular domain
- APP
- amyloid precursor protein
- sAPPα
- soluble ectodomain of APP after α-secretase cleavage
- sAPPβ
- soluble ectodomain of APP after β-secretase cleavage
- BACE1
- β-site APP-cleaving enzyme-1
- HDAC
- histone deacetylase
- KPI
- Kunitz-type protease inhibitor
- NEP
- neprilysin
- Tricine
- N-[2-hydroxy-1,1-bis(hydroxymethyl)ethyl]glycine.
REFERENCES
- 1.Selkoe D. J. (1991) Neuron 6, 487–498 [DOI] [PubMed] [Google Scholar]
- 2.Hardy J. A., Higgins G. A. (1992) Science 256, 184–185 [DOI] [PubMed] [Google Scholar]
- 3.Nalivaeva N. N., Fisk L. R., Belyaev N. D., Turner A. J. (2008) Curr. Alzheimer Res. 5, 212–224 [DOI] [PubMed] [Google Scholar]
- 4.Hersh L. B., Rodgers D. W. (2008) Curr. Alzheimer Res. 5, 225–231 [DOI] [PubMed] [Google Scholar]
- 5.Sandbrink R., Masters C. L., Beyreuther K. (1996) Ann. N.Y. Acad. Sci. 777, 281–287 [DOI] [PubMed] [Google Scholar]
- 6.Beyreuther K., Pollwein P., Multhaup G., Mönning U., König G., Dyrks T., Schubert W., Masters C. L. (1993) Ann. N.Y. Acad. Sci. 695, 91–102 [DOI] [PubMed] [Google Scholar]
- 7.Tanaka S., Shiojiri S., Takahashi Y., Kitaguchi N., Ito H., Kameyama M., Kimura J., Nakamura S., Ueda K. (1989) Biochem. Biophys. Res. Commun. 165, 1406–1414 [DOI] [PubMed] [Google Scholar]
- 8.Spillantini M. G., Hunt S. P., Ulrich J., Goedert M. (1989) Brain Res. Mol. Brain Res. 6, 143–150 [DOI] [PubMed] [Google Scholar]
- 9.Moir R. D., Lynch T., Bush A. I., Whyte S., Henry A., Portbury S., Multhaup G., Small D. H., Tanzi R. E., Beyreuther K., Masters C. L. (1998) J. Biol. Chem. 273, 5013–5019 [DOI] [PubMed] [Google Scholar]
- 10.Willoughby D. A., Rozovsky I., Lo A. C., Finch C. E. (1995) J. Mol. Neurosci. 6, 257–276 [DOI] [PubMed] [Google Scholar]
- 11.Panegyres P. K. (1998) J. Neural Transm. 105, 463–478 [DOI] [PubMed] [Google Scholar]
- 12.Mucke L., Abraham C. R., Ruppe M. D., Rockenstein E. M., Toggas S. M., Mallory M., Alford M., Masliah E. (1995) J. Exp. Med. 181, 1551–1556 [DOI] [PMC free article] [PubMed] [Google Scholar]
- 13.Mattson M. P. (1997) Physiol. Rev. 77, 1081–1132 [DOI] [PubMed] [Google Scholar]
- 14.Hardy J. (2009) J. Neurochem. 110, 1129–1134 [DOI] [PubMed] [Google Scholar]
- 15.Henriques A. G., Vieira S. I., Rebelo S., Domingues S. C., da Cruz e Silva E. F., da Cruz e Silva O. A. (2007) J. Alzheimers Dis. 11, 85–95 [DOI] [PubMed] [Google Scholar]
- 16.Lathia J. D., Mattson M. P., Cheng A. (2008) J. Neurochem. 107, 1471–1481 [DOI] [PMC free article] [PubMed] [Google Scholar]
- 17.Cao X., Südhof T. C. (2001) Science 293, 115–120 [DOI] [PubMed] [Google Scholar]
- 18.von Rotz R. C., Kohli B. M., Bosset J., Meier M., Suzuki T., Nitsch R. M., Konietzko U. (2004) J. Cell. Sci. 117, 4435–4448 [DOI] [PubMed] [Google Scholar]
- 19.Konietzko U., Goodger Z. V., Meyer M., Kohli B. M., Bosset J., Lahiri D. K., Nitsch R. M. (2010) Neurobiol. Aging 31, 58–73 [DOI] [PMC free article] [PubMed] [Google Scholar]
- 20.Goodger Z. V., Rajendran L., Trutzel A., Kohli B. M., Nitsch R. M., Konietzko U. (2009) J. Cell. Sci. 122, 3703–3714 [DOI] [PubMed] [Google Scholar]
- 21.Pardossi-Piquard R., Petit A., Kawarai T., Sunyach C., Alves da Costa C., Vincent B., Ring S., D'Adamio L., Shen J., Müller U., St George Hyslop P., Checler F. (2005) Neuron 46, 541–554 [DOI] [PubMed] [Google Scholar]
- 22.Chen A. C., Selkoe D. J. (2007) Neuron 53, 479–483 [DOI] [PubMed] [Google Scholar]
- 23.Hébert S. S., Serneels L., Tolia A., Craessaerts K., Derks C., Filippov M. A., Müller U., De Strooper B. (2006) EMBO Rep. 7, 739–745 [DOI] [PMC free article] [PubMed] [Google Scholar]
- 24.Belyaev N. D., Nalivaeva N. N., Makova N. Z., Turner A. J. (2009) EMBO Rep. 10, 94–100 [DOI] [PMC free article] [PubMed] [Google Scholar]
- 25.Nalivaeva N. N., Belyaev N. D., Turner A. J. (2009) Trends Pharmacol. Sci. 30, 509–514 [DOI] [PubMed] [Google Scholar]
- 26.Zhang X. Z., Li X. J., Zhang H. Y. (2010) Brain Res. Bull. 81, 3–6 [DOI] [PubMed] [Google Scholar]
- 27.Nili E., Cojocaru G. S., Kalma Y., Ginsberg D., Copeland N. G., Gilbert D. J., Jenkins N. A., Berger R., Shaklai S., Amariglio N., Brok-Simoni F., Simon A. J., Rechavi G. (2001) J. Cell. Sci. 114, 3297–3307 [DOI] [PubMed] [Google Scholar]
- 28.Parvathy S., Hussain I., Karran E. H., Turner A. J., Hooper N. M. (1998) Biochemistry 37, 1680–1685 [DOI] [PubMed] [Google Scholar]
- 29.Haugabook S. J., Yager D. M., Eckman E. A., Golde T. E., Younkin S. G., Eckman C. B. (2001) J. Neurosci. Methods. 108, 171–179 [DOI] [PubMed] [Google Scholar]
- 30.Zuccato C., Belyaev N., Conforti P., Ooi L., Tartari M., Papadimou E., MacDonald M., Fossale E., Zeitlin S., Buckley N., Cattaneo E. (2007) J. Neurosci. 27, 6972–6983 [DOI] [PMC free article] [PubMed] [Google Scholar]
- 31.Lefranc-Jullien S., Sunyach C., Checler F. (2006) J. Neurochem. 97, 807–817 [DOI] [PubMed] [Google Scholar]
- 32.Ohyagi Y., Asahara H., Chui D. H., Tsuruta Y., Sakae N., Miyoshi K., Yamada T., Kikuchi H., Taniwaki T., Murai H., Ikezoe K., Furuya H., Kawarabayashi T., Shoji M., Checler F., Iwaki T., Makifuchi T., Takeda K., Kira J., Tabira T. (2005) FASEB J. 19, 255–257 [DOI] [PubMed] [Google Scholar]
- 33.Ishimaru F., Shipp M. A. (1995) Blood 85, 3199–3207 [PubMed] [Google Scholar]
- 34.Li C., Chen G., Gerard N. P., Gerard C., Bozic C. R., Hersh L. B. (1995) Gene 164, 363–366 [DOI] [PubMed] [Google Scholar]
- 35.Citron M., Oltersdorf T., Haass C., McConlogue L., Hung A. Y., Seubert P., Vigo-Pelfrey C., Lieberburg I., Selkoe D. J. (1992) Nature 360, 672–674 [DOI] [PubMed] [Google Scholar]
- 36.Forman M. S., Cook D. G., Leight S., Doms R. W., Lee V. M. (1997) J. Biol. Chem. 272, 32247–32253 [DOI] [PubMed] [Google Scholar]
- 37.Cordy J. M., Hussain I., Dingwall C., Hooper N. M., Turner A. J. (2003) Proc. Natl. Acad. Sci. U.S.A. 100, 11735–11740 [DOI] [PMC free article] [PubMed] [Google Scholar]
- 38.Vetrivel K. S., Thinakaran G. (2010) Biochim. Biophys. Acta. 1801, 860–867 [DOI] [PMC free article] [PubMed] [Google Scholar]
- 39.Smith R. P., Higuchi D. A., Broze G. J., Jr. (1990) Science 248, 1126–1128 [DOI] [PubMed] [Google Scholar]
- 40.Kametani F., Tanaka K., Ishii T., Ikeda S., Kennedy H. E., Allsop D. (1993) Biochem. Biophys. Res. Commun. 191, 392–398 [DOI] [PubMed] [Google Scholar]
- 41.Kennedy H., Kametani F., Allsop D. (1992) Neurodegeneration 1, 59–64 [Google Scholar]
- 42.Allinson T. M., Parkin E. T., Turner A. J., Hooper N. M. (2003) J. Neurosci. Res. 74, 342–352 [DOI] [PubMed] [Google Scholar]
- 43.Hunt C. E., Turner A. J. (2009) FEBS J. 276, 1845–1859 [DOI] [PubMed] [Google Scholar]
- 44.Müller T., Meyer H. E., Egensperger R., Marcus K. (2008) Prog. Neurobiol. 85, 393–406 [DOI] [PubMed] [Google Scholar]
- 45.Edbauer D., Willem M., Lammich S., Steiner H., Haass C. (2002) J. Biol. Chem. 277, 13389–13393 [DOI] [PubMed] [Google Scholar]
- 46.Hoey S. E., Williams R. J., Perkinton M. S. (2009) J. Neurosci. 29, 4442–4460 [DOI] [PMC free article] [PubMed] [Google Scholar]
- 47.Sala Frigerio C., Fadeeva J. V., Minogue A. M., Citron M., Van Leuven F., Staufenbiel M., Paganetti P., Selkoe D. J., Walsh D. M. (2010) FEBS J. 277, 1503–1518 [DOI] [PMC free article] [PubMed] [Google Scholar]
- 48.Cordy J. M., Hooper N. M., Turner A. J. (2006) Mol. Membr. Biol. 23, 111–122 [DOI] [PubMed] [Google Scholar]
- 49.Ehehalt R., Keller P., Haass C., Thiele C., Simons K. (2003) J. Cell. Biol. 160, 113–123 [DOI] [PMC free article] [PubMed] [Google Scholar]
- 50.Parvathy S., Hussain I., Karran E. H., Turner A. J., Hooper N. M. (1999) Biochemistry 38, 9728–9734 [DOI] [PubMed] [Google Scholar]
- 51.Knauer M. F., Orlando R. A., Glabe C. G. (1996) Brain Res. 740, 6–14 [DOI] [PubMed] [Google Scholar]
- 52.Postuma R. B., Martins R. N., Cappai R., Beyreuther K., Masters C. L., Strickland D. K., Mok S. S., Small D. H. (1998) FEBS Lett. 428, 13–16 [DOI] [PubMed] [Google Scholar]
- 53.Goto J. J., Tanzi R. E. (2002) J. Mol. Neurosci. 19, 37–41 [DOI] [PubMed] [Google Scholar]
- 54.Cousins S. L., Hoey S. E., Stephenson F. A., Perkinton M. S. (2009) J. Neurochem. 111, 1501–1513 [DOI] [PubMed] [Google Scholar]
- 55.Ghosal K., Vogt D. L., Liang M., Shen Y., Lamb B. T., Pimplikar S. W. (2009) Proc. Natl. Acad. Sci. U.S.A. 106, 18367–18372 [DOI] [PMC free article] [PubMed] [Google Scholar]


