Abstract
The reaction center-binding D1 protein of Photosystem II is oxidatively damaged by excessive visible light or moderate heat stress. The metalloprotease FtsH has been suggested as responsible for the degradation of the D1 protein. We have analyzed the distribution and subunit structures of FtsH in spinach thylakoids and various membrane fractions derived from the thylakoids using clear native polyacrylamide gel electrophoresis and Western blot analysis. FtsH was found not only in the stroma thylakoids but also in the Photosystem II-enriched grana membranes. Monomeric, dimeric, and hexameric FtsH proteases were present as major subunit structures in thylakoids, whereas only hexameric FtsH proteases were detected in Triton X-100-solubilized Photosystem II membranes. Importantly, among the membrane fractions examined, hexameric FtsH proteases were most abundant in the Photosystem II membranes. In accordance with this finding, D1 degradation took place in the Photosystem II membranes under light stress. Sucrose density gradient centrifugation analysis of thylakoids and the Photosystem II membranes solubilized with n-dodecyl-β-d-maltoside and a chemical cross-linking study of thylakoids showed localization of FtsH near the Photosystem II light-harvesting chlorophyll-protein supercomplexes in the grana. These results suggest that part of the FtsH hexamers are juxtapositioned to PSII complexes in the grana in darkness, carrying out immediate degradation of the photodamaged D1 protein under light stress.
Keywords: Chloroplast, Membrane Structure, Metalloprotease, Photosynthesis, Protease, D1 Degradation, FtsH Protease, Grana Stacking, Photosystem II, Light Stress
Introduction
When plants are exposed to light or heat stress from the environment, the reaction center-binding protein D1 of Photosystem II (PSII)2 is invariably damaged and a specific protease(s) degrades the damaged protein, which is finally removed from the PSII complex and replaced (1–3). Studies examining the turnover of the D1 protein have focused on detecting the proteases that are involved in the degradation of D1. The most likely protease candidates are the FtsH (filamentation temperature-sensitive H) proteases (3–9). The ftsH gene encodes a 71-kDa protein that is essential for the cell viability of Escherichia coli (10). Homologs of the gene have been identified in cyanobacteria, mitochondria, and chloroplasts. In Arabidopsis thaliana, 12 genes encode FtsH proteins, and the gene products from nine of these genes have been identified in chloroplasts (11). In these products, four isoforms, FtsH1, FtsH2, FtsH5, and FtsH8, accumulate in Arabidopsis leaves grown under normal conditions (12). Of the FtsH subunits, which form an active hexameric ring structure, FtsH1 and 5 (type A subunits) and FtsH2 and 8 (type B subunits) are closely related pairs. The FtsH hexamers are composed of two type A subunits and four type B subunits (7, 13). Among the FtsH subunits located in chloroplasts, FtsH2 is most abundant, and mutants lacking the FtsH2 subunits show severe variegation and photoinhibition (14, 15). In a previous study, we showed that FtsH proteases are also involved in the primary cleavage of the D1 protein under moderate heat stress (8).
FtsH belongs to the AAA+ (ATPase associated with various cellular activities plus) superfamily. Structural analyses of bacterial FtsH showed that FtsH proteases, like other AAA+ proteases, form hexameric ring structures (16–20). Six active sites are located inside a hexameric molecule (17). Each FtsH subunit has two transmembrane helices, the activity of which depends on ATP and Zn2+ ions, and its size ranges from 66 to 81 kDa (21). In chloroplasts of higher plants, it is not clear whether such large complexes are present throughout thylakoids, even in the grana regions. The size of the hexameric FtsH in prokaryotes is almost comparable with that of ATP synthase (19, 20); thus FtsH hexamers may be excluded from the stacked regions of thylakoids and thereby be located in the stroma thylakoids, grana margins, and grana end membranes.
Biological membranes are highly crowded with various proteins and protein complexes, and the thylakoids of higher plant chloroplasts are no exception (22, 23). In the grana, free diffusion of large protein complexes on the thylakoids may be considerably restricted (24, 25). It has been proposed that a large proportion of FtsH in thylakoids exists in the stroma thylakoids, where they participate in the degradation of the photo- and heat-damaged D1 protein (4, 9). According to this notion, the PSII complexes containing the damaged D1 protein must migrate from the grana where the PSII complexes are enriched to the stroma thylakoids where PSII repair is thought to occur. An important unsolved question is how the large PSII supercomplex interacts with the hexameric FtsH in the highly crowded membrane environment. To answer this question, information describing the distribution of FtsH proteases in thylakoids is important.
In this study, we analyzed the distribution and subunit structures of FtsH proteases in various membrane fractions prepared from spinach thylakoids. Unexpectedly, we found a considerable amount of FtsH hexamer in the dark-adapted PSII membranes, which are equivalent to the grana. Sucrose density gradient centrifugation analysis of thylakoids and Photosytem II membranes solubilized with n-dodecyl-β-d-maltoside (DM) and a chemical cross-linking study of thylakoids indicate that at least some of the FtsH proteases are localized near the light-harvesting chlorophyll-protein complexes of PSII (LHCII). These results strongly suggest that the damaged D1 protein is recognized by FtsH proteases that are located near PSII in the grana.
EXPERIMENTAL PROCEDURES
Isolation of Thylakoids and Various Fractions of Thylakoids
Fresh spinach leaves were purchased from a local market, and intact chloroplasts were isolated as previously reported (26). Thylakoid membranes were obtained by osmolysis of the intact chloroplasts with a hypotonic solution containing 5 mm MgCl2 and 10 mm Hepes-KOH (pH 7.5). The mixture was subsequently centrifuged at 15,000 × g for 10 min, and the pellets were resuspended in a solution containing 0.1 m sorbitol, 15 mm NaCl, 5 mm MgCl2, and 50 mm Tricine-KOH (pH 7.6) (solution A). After washing twice with solution A, the thylakoids were resuspended in the same buffer solution at 1.0 mg of chlorophyll ml−1. PSII membranes were prepared by the treatment of the thylakoids with Triton X-100 as described previously (27). The PSII core complexes were isolated by the treatment of the PSII membranes with 2.0–2.6% (w/v) n-heptyl-β-d-thioglucoside (HTG) (28). The grana and stroma thylakoids were separated by treating the thylakoids with digitonin and Triton X-100 (29). Digitonin (Sigma) was purified before use. We carried out all of the preparation steps at 4 °C in a dark room under a green safe light.
Stress Treatment and Measurement of Oxygen-evolving Activity
Heat treatment of the thylakoid membranes was carried out by incubating the samples in black tubes in a circulating water bath at 40 °C. When thylakoids and PSII membranes were treated with high light, the samples were placed in a water bath at 25 °C, and strong light (intensity, 1,000 μmol of photons m−2 s−1) was irradiated through a heat absorbing filter. The oxygen-evolving activity of thylakoids was measured using a Hansatech oxygen electrode as described previously (30).
SDS/Urea-PAGE, Clear Native PAGE, and Western Blot Analysis
SDS/urea-PAGE and Western blot analysis were carried out as described previously (26, 27). Thylakoid membranes and membrane fractions derived from the thylakoids were suspended in 20 mm Hepes-NaOH (pH 7.0), 25% glycerol, and 10 mm MgCl2 (solution B), and the chlorophyll concentration was adjusted to 0.25 mg ml−1. Clear native (CN)-PAGE was used to determine the subunit structure of FtsH complexes in thylakoid membranes. The samples subjected to moderate heat or high light treatment were solubilized with 1.5% DM at 4 °C for 10 min, followed by centrifugation at 18,000 × g for 20 min to remove insoluble materials. The supernatant was loaded onto a gel with a gradient of 5–13% acrylamide, and electrophoresis was performed for 2 h at 4 °C where the voltage was gradually increased from 70 to 300 V. The composition of the electrode buffers for CN-PAGE was 50 mm Tricine, 7.5 mm imidazole (pH 7.0), 0.05% Triton X-100, and 0.05% deoxycholic acid sodium salt (Merck) for the cathode buffer and 25 mm imidazole HCl (pH 7.0) for the anode buffer. The antibodies against the DE loop of the D1 protein, the C terminus of the D1 protein, CP43 and CP47 (the antenna chlorophyll-binding proteins of PSII core showing relative molecular masses of 43,000 and 47,000, respectively, in SDS-PAGE), cyt f, LHCII, and VAR2 (FtsH2 from Arabidopsis) were used for Western blot analysis. These antibodies, except for VAR2, were purchased from AgriSera. Horseradish peroxidase-conjugated anti-rabbit antibody (Bio-Rad) was used as the secondary antibody. Immuno-decorated bands were detected by fluorography with ECL (Amersham Biosciences). Where indicated, a metalloprotease inhibitor EDTA (1 mm disodium salt), a serine protease inhibitor aprotinin (5 μm), and a serine and cysteine protease inhibitor leupeptin (5 μm) were used.
Sucrose Density Gradient Centrifugation
Thylakoids or PSII-enriched membranes (0.8 mg chlorophyll ml−1) were treated with 0.75–1.25% DM for 30 min on ice. The suspension was loaded onto a sucrose density gradient (0.1–1.3 m sucrose, 5 mm Tricine-NaOH, pH 8.0, 0.01% DM) and centrifuged with a Beckman ultracentrifuge at 177,000 × g for 24 h using a SW41Ti rotor.
Chemical Cross-linking
Cross-linking reaction was performed with 1-ethyl-3-(3-dimethylaminopropyl)-carbodi-imide (EDC) (0 Å cross-linker; Pierce) and bis(sulfosuccinimidyl)suberate (BS3) (spacer arm distance of 11.4 Å; Pierce) using PSII-enriched membranes (0.25 mg of chlorophyll ml−1). The final concentration of the cross-linkers was adjusted to 0.25 mm. The mixtures were incubated at room temperature for 5 min, and the reaction was stopped with an equal volume of the quench solution (1 m Tris-HCl, pH 8.0). After centrifugation at 25,000 × g for 10 min, the supernatant was removed, and the pellet was solubilized with lysis buffer (125 mm Tris-HCl pH 6.8, 5% (w/v) SDS, 8 mm urea, 5 mm EDTA, 5% (w/v) sucrose, and 5% (v/v) β-mercaptoethanol in the case of BS3) and loaded onto the SDS/urea-PAGE. Each lane contained 2.5 μg of chlorophyll.
RESULTS
Distribution of FtsH Proteases in Spinach Thylakoids
A large part of FtsH proteases are assumed to exist in the stroma thylakoids (4, 9). An active FtsH protease forms a hexameric ring structure; however, it is unclear whether the hexamer is the only subunit structure that the protease forms in the thylakoids.
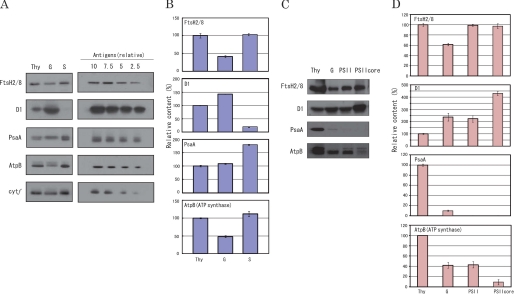
Initially, the distribution of FtsH was examined by quantifying the FtsH2 and 8 (FtsH2/8) proteases in thylakoids and various membrane fractions obtained from the thylakoids, including the grana, stroma thylakoids, PSII membranes, and PSII core complexes (Fig. 1). An antibody against VAR2, which corresponds to FtsH2 in A. thaliana, was used. FtsH2 and 8 (FtsH2/8) are the major FtsH proteases in thylakoids. FtsH2/8 comprise two-thirds of the total FtsH in thylakoids, and because the ratio of FtsH2/8 and another group of FtsH, FtsH1 and 5 (FtsH1/5), is fixed at 2:1 (13), we can judge the relative abundance of FtsH in each membrane fraction by simply measuring the amount of FtsH2/8. First, the relative amounts of FtsH proteases in the thylakoids, grana, and stroma thylakoids were compared on the basis of cyt f in the cyt b6/f complex, which is present homogeneously in the thylakoids (Fig. 1, A and B). The data show that FtsH is more abundant in the stroma thylakoids than in the grana. Next, we compared the contents of FtsH among the grana, PSII membranes, and PSII core samples on the same chlorophyll basis, because cyt b6/f is probably removed in the purified PSII membranes and PSII cores, and we may not be able to compare the amounts of FtsH in each membrane fraction on the basis of cyt f any more (Fig. 1, C and D). It is natural to consider that the Triton-solubilized PSII membranes (Fig. 1, PSII) and the grana fraction obtained by the digitonin-Triton treatment of the thylakoids (in Fig. 1, G) are equivalent in terms of the content of PSII. Actually, the content of the D1 protein was almost identical in both preparations on the same chlorophyll basis (Fig. 1D). However, the content of FtsH in the grana was smaller than the PSII membranes. This is probably because a large part of FtsH was partitioned into other fractions during the grana preparation, which included several differential centrifugation steps following treatment with digitonin and Triton X-100 (supplemental Fig. S1). The data showing the presence of a small amount of PsaA and ATP synthase in the digitonin/Triton-solubilized grana and to a lesser extent with PsaA in the Triton-solubilized PSII membranes (Fig. 1) suggest that these membrane samples contain the grana margins and grana end membranes. It was also suggested that the Triton-solubilized PSII membranes are more purified than the digitonin/Triton-fractionated grana samples in terms of the content of grana, because the former samples contain less PsaA protein. Because the molecular size of the FtsH hexamers is almost the same as that of ATP synthases, FtsH hexamers may be easily adopted by the grana margins and grana end membranes. FtsH was also detected in the PSII core, which was devoid of most of LHCII but retained other proteins including extrinsic proteins of PSII.
FIGURE 1.
Distribution of FtsH proteases in thylakoids and various membrane fractions derived from the thylakoids. A, Western blot analysis showing the amounts of FtsH2/8 proteases, the D1 protein, PsaA, AtpB, and cyt f in spinach thylakoids (Thy), digitonin/Triton X-100 solubilized grana (G), and stroma thylakoids (S). In the left halves of the gels, the amount of the sample in each lane was adjusted on the basis of cyt f, whereby the band of cyt f (the bottom gel) in each lane showed the same density in the fluorogram. The amounts of the samples were equivalent to 1 μg of chlorophyll for the thylakoids, 5 μg of chlorophyll for the grana, and 0.24 μg of chlorophyll for the stroma thylakoids. In the right halves of the gels, the gradient of each antigen that was used for quantification of the bands in the left half of each gel is shown. B, the relative amounts of FtsH2/8 proteases, the D1 protein, PsaA, and AtpB in thylakoids (Thy), grana (G), and stroma thylakoids (S). The amount of each protein was measured using Scion Image software. C, Western blot analysis showing the amounts of FtsH2/8 proteases, the D1 protein, PsaA, and AtpB in thylakoids (Thy), grana (G), Triton X-100 solubilized PSII membranes (PSII) and PSII core complexes (PSII core). D, the relative amounts of FtsH2/8, the D1 protein, PsaA, and AtpB in each membrane sample. The membrane samples were subjected to SDS/urea-PAGE and subsequently to Western blot analysis with the antibodies against VAR2 from A. thaliana FtsH2, the C terminus of the D1 protein, PsaA, AtpB, and cyt f. The data are the means of three independent measurements ± S.D.
Subunit Structure of FtsH Proteases
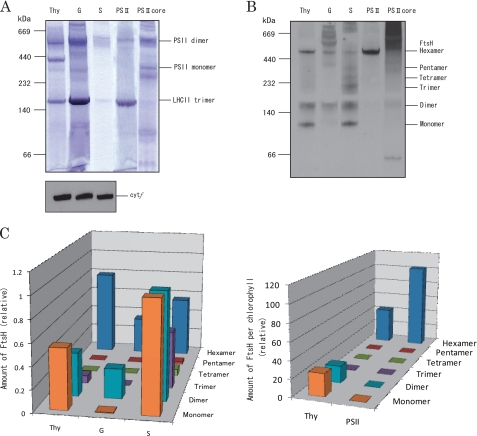
We next compared the subunit structures of the FtsH proteases in the thylakoids, grana, stroma thylakoids, PSII membranes, and PSII core complexes by CN-PAGE and Western blotting using the antibody against VAR2 (FtsH2). In CN-PAGE, several large protein complexes were detected in thylakoids and the membrane fractions derived from them (Fig. 2A). Monomers and oligomers of FtsH were identified by the subsequent Western blot analysis (Fig. 2B). In thylakoids, we detected monomeric, dimeric, and hexameric FtsH. Interestingly, only FtsH hexamers were present in PSII membranes. The amounts of monomers and oligomers were compared between the thylakoids, grana, and stroma thylakoids on the basis of cyt f (Fig. 2, B, three lanes on the left side of the fluorogram, and C, left panel), whereas those between the thylakoids and PSII membranes were compared on the basis of chlorophyll (Fig. 2, B, two lanes on the right-hand side of the fluorogram, and C, right panel). From these results, it is shown that the presence of the hexameric FtsH was most prominent in the PSII membranes among the thylakoids and the other membrane fractions derived from the thylakoids. In the stroma thylakoids, FtsH proteases were present in all possible subunit forms, i.e. monomers, dimers, trimers, tetramers, pentamers, and hexamers. In the PSII core, FtsH was detected by Western blotting (Fig. 1), but no significant amount of FtsH was detected by CN-PAGE and subsequent immunoblotting (Fig. 2B). This is because FtsH in the PSII core, which had been treated with Triton X-100 and HTG, formed large aggregates, which migrate more slowly than the FtsH hexamers. Probably the FtsH proteases in this fraction became denatured or destabilized after two successive detergent treatments.
FIGURE 2.
Composition and distribution of FtsH proteases revealed by CN-PAGE and Western blot analysis. A, CN-PAGE of thylakoids (Thy), grana (G), stroma thylakoids (S), PSII membranes (PSII), and PSII core complexes (PSII core). The protein complexes were stained by Coomassie Brilliant Blue. Molecular markers are shown on the left-hand side of the gel, and the positions of PSII dimer, monomer, and LHCII trimer are indicated on the right-hand side of the gel. The amounts of membrane samples loaded were the same as those described in Fig. 1A. After this adjustment, the amounts of the proteins in the lanes of Thy, G, and S become comparable with each other on the basis of cyt f. At the bottom, the amount of cyt f in each lane is shown by Western blot analysis. The amounts of proteins in Thy, PSII, and PSII core lanes were comparable with each other on the basis of chlorophyll. B, Western blot analysis with anti-VAR2 antibody showing monomers and oligomers of FtsH in the same gel as that used in A. The molecular markers are shown on the left-hand side of the gel, and the sizes of the FtsH monomer and oligomers are shown on the right-hand side of the gel. C, quantification of the FtsH monomers and oligomers in thylakoids and the membranes fractions on the basis of cyt f (left) and chlorophyll (right). The data are the means ± S.D. (n = 3).
Degradation of the D1 Protein in the PSII Membranes under Light Stress
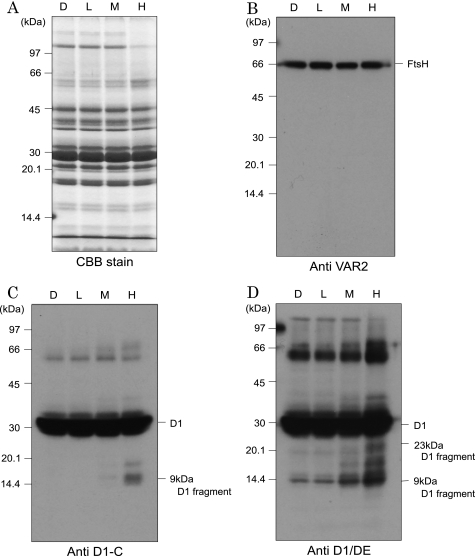
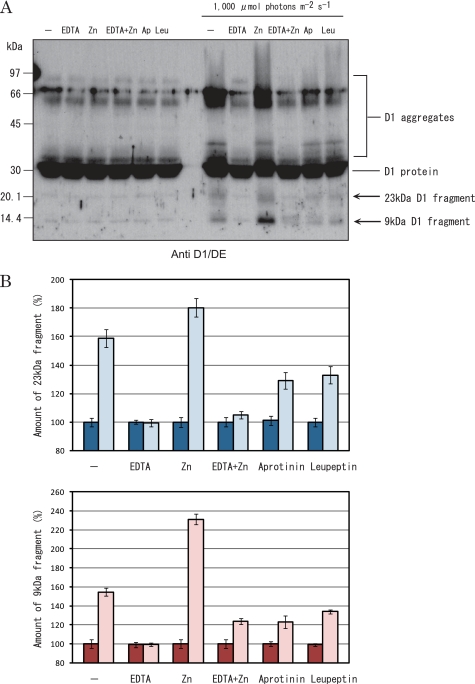
To determine whether degradation of the D1 protein takes place in the grana, the Triton X-100-solubilized PSII membranes, which were equivalent to the grana, were illuminated with excessive light, and degradation of the D1 protein was examined by Western blot analysis with specific antibodies. Strong illumination (500–2,000 μmol of photons m−2 s−1) of the thylakoids resulted in inhibition of oxygen evolving activity and degradation of the D1 protein (supplemental Fig. S2). 23-kDa N-terminal and 9-kDa C-terminal fragments were identified as cleavage products of the D1 protein. The same cleavage of the D1 protein took place in the PSII membranes upon strong illumination (Fig. 3). This observation suggests that degradation of the D1 protein takes place in the grana. The D1 degradation was stimulated by the addition of 0.15 mm ZnCl2 and inhibited by the presence of 1 mm EDTA, suggesting that a metalloprotease(s), probably FtsH, participated in the degradation of the D1 protein (Fig. 4).
FIGURE 3.
Degradation of the D1 protein in PSII membranes under excessive illumination. A, a profile of the proteins in the PSII membranes shown by SDS/urea-PAGE and the subsequent Coomassie Brilliant Blue staining. D, L, M, and H at the top of the gel indicate the dark control and the samples illuminated with low, medium, and high light with intensities of 20, 500, and 2,000 μmol of photons m−2 s−1, respectively, for 60 min at 20 °C. Each sample contained 1 μg of chlorophyll. B–D, Western blot analysis of FtsH and the D1 protein in PSII membranes under light stress. The antibodies against VAR2 (B), the C terminus of the D1 protein (C), and the DE loop of the D1 protein (D) were used. The molecular markers are shown on the left-hand side of the gel, and the positions of D1, D1 fragments, and FtsH are indicated on the right-hand side of the gel. The other conditions are the same as those described for A.
FIGURE 4.
Effects of various protease inhibitors on degradation of the D1 protein under excessive illumination. A, a typical fluorogram of Western blot analysis showing the D1 protein of the PSII membranes. The samples were either dark incubated (left half of the gel) or illuminated with strong light with an intensity of 1,000 μmol of photons m−2 s−1 for 60 min (right half of the gel) at 20 °C in the presence and absence of various protease inhibitors and/or ZnCl2 (0.15 mm) and subsequently subjected to SDS/urea-PAGE and Western blot analysis. The antibody against the DE loop of the D1 protein was used. At the top of the gel, Ap and Leu represent aprotinin and leupeptin, respectively. EDTA, aprotinin, and leupeptin were used at the concentrations of 1 mm, 5 μm, and 5 μm, respectively. Each lane contains PSII membranes equivalent to 2.5 μg of chlorophyll. B, the amounts of 23-kDa (top) and 9-kDa (bottom) fragments of the D1 protein. The data are derived from the Western blot analysis in A. The bars with strong color represent dark controls, and the bars with weak color represent the D1 fragments produced under strong illumination.
Interaction of FtsH Proteases with LHCII
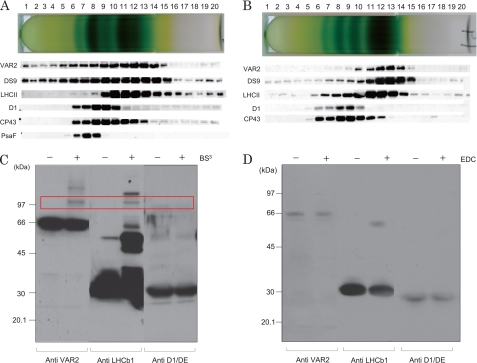
To examine the association of the FtsH proteases with PSII, we solubilized thylakoids and PSII membranes with DM (1.25% (w/v) for thylakoids and 0.75% for PSII membranes) for 30 min at 4 °C and subsequently fractionated chlorophyll-protein complexes using sucrose density gradient centrifugation (Fig. 5, A and B). Western blot analysis using specific antibodies revealed co-migration of FtsH proteases and LHCII. Association of FtsH proteases with LHCII was demonstrated by chemical cross-linking studies in which the effects of several chemical cross-linkers such as EDC and BS3 were examined with PSII membranes (Fig. 5, C and D). EDC is a 0 Å cross-linker, whereas BS3 has a spacer arm distance of 11.4 Å. We found that FtsH proteases and the LHCII protein cross-linked to form large adducts when we use BS3, but no cross-linked product was detected with the use of EDC. These results indicate that the FtsH proteases are not an immediate neighbor but are still juxtaposition to the LHCII proteins. The chemical cross-linking products between the D1 protein and FtsH proteases were not detected. Additional supporting evidence for close association of FtsH with LHCII was obtained when PSII core samples were prepared from PSII membranes by treatment with HTG to remove LHCII. Following the centrifugation of HTG-treated PSII membranes, a large part of FtsH was detected together with LHCII in the supernatant (supplemental Fig. S3).
FIGURE 5.
Sucrose density gradient centrifugation and chemical cross-linking analysis showing the localization of FtsH proteases in the thylakoids and PSII membranes. A, sucrose density gradient centrifugation following the solubilization of thylakoids with DM. After centrifugation, the fractions of the tube were subjected to SDS/urea-PAGE and Western blot analysis with specific antibodies (indicated on the left-hand side of the gels). B, the same as A except PSII membranes were used as the sample. C, chemical cross-linking study of PSII membranes using BS3 to identify the nearest neighbor protein interactions. After the separation of the proteins in the PSII membranes by SDS/urea-PAGE, the antibodies against VAR2, LHCb1, and the DE loop of the D1 protein were used for the subsequent Western blot analysis. − and + at the top of the gel indicate the absence and presence of 0.25 mm BS3, respectively. The bands that appeared after the cross-linking reaction are indicated by the red square and represent the cross-linked products of FtsH and LHCb1. Molecular markers are shown on the left-hand side of the gel. D, chemical cross-linking study of PSII membranes using EDC. The concentration of EDC was 5 mm. The other conditions were the same as those described in C.
Stability of FtsH Proteases under Light and Heat Stresses
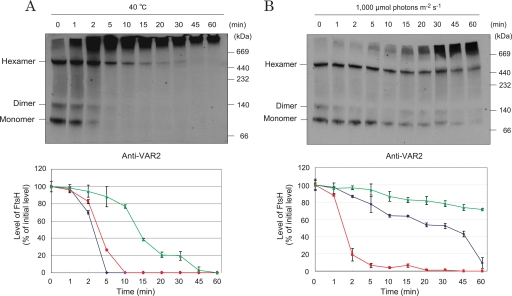
Under moderate heat stress, where thylakoids were incubated at 40 °C, oxygen-evolving activity decreased, and the D1 protein showed degradation (supplemental Fig. S2). Under these conditions, most of the FtsH monomers and dimers in the thylakoids disappeared within 10 min, whereas the levels of the hexameric FtsH proteases remained constant at least for 30 min (Fig. 6A). Under light stress conditions (intensity, 1,000 μmol of photons m−2 s−1), FtsH hexamers in thylakoids were stable even in longer stress periods (Fig. 6B).
FIGURE 6.
Stability of FtsH proteases under heat and light stresses. A, effects of moderate heat stress on FtsH monomers, dimers, and hexamers in thylakoids. The thylakoids were incubated at 40 °C for 0–60 min, and CN-PAGE and Western blot analysis with an antibody against anti-VAR2 were performed to detect FtsH complexes (top). The location of the FtsH monomer, dimer, and hexamer are shown on the left-hand side of the gel. Molecular markers are shown on the right-hand side of the gel. The amounts of monomeric and oligomeric FtsH proteases were quantified using the Scion Image software (bottom). Blue, red, and green lines represent monomeric, dimeric, and hexameric FtsH, respectively. The data are the means of three independent measurements ± S.D. B, effects of light stress on FtsH monomers, dimers, and hexamers in thylakoids. The thylakoids were illuminated with high light (intensity, 1,000 μmol of photons m−2 s−1) for 0–60 min at 20 °C. The amounts of monomeric, dimeric, and hexameric FtsH proteases were measured. The other conditions were the same as those described for A.
DISCUSSION
Hexameric FtsH protease in bacteria, mitochondria, and chloroplasts has a relative molecular mass of 400–480 kDa, with a large hydrophilic ring structure containing ATPase domains and zinc-dependent protease domains (16, 17, 19, 20). Localization of such a large structure in spinach thylakoids is expected to be confined to the unstacked regions of thylakoids, i.e. the stroma thylakoids, grana end membranes, and grana margins. This is because the space between the stacked thylakoid membranes is considered to be too small to allow the presence of protein complexes with large extrusions (4, 9). Our present study suggested the coexistence of hexameric FtsH with PSII-LHCII supercomplexes in the PSII membranes representing the grana (Figs. 2 and 5). The Triton X-100-solubilized PSII membranes, which is equivalent to the grana, may contain not only the grana cores but also grana margins, judging from the content of AtpB (an ATP synthase subunit) protein (Fig. 1). Comparison of the amounts of FtsH, the D1 protein, PsaA protein, and AtpB protein in the thylakoids, digitonin/Triton-fractionated grana, and stroma thylakoids and Triton-solubilized PSII membranes suggests that FtsH is present not only in the stroma thylakoids but also in the grana (Fig. 1). The Triton-solubilized PSII membranes seem to represent more purified grana compared with the digitonin/Triton-solubilized grana fraction (Fig. 1). Indeed, former studies on isolation of PSII-enriched membranes from higher plants showed that the concentration of Triton X-100, rather than the combination of digitonin and Triton X-100, is important for the purification of the PSII membranes (31–35).
Detection of FtsH in the PSII core reflects either a small contamination of other membrane regions in this fraction or the real presence of FtsH in the grana core. The former possibility is low because the PSII core showed almost no contamination of PsaA and AtpB (Fig. 1D). On the other hand, the latter possibility must fulfill the requirement that the protein complexes that reside in between the two stacked thylakoid membranes fit to the narrow space, as described below.
The structure of the cytosolic region of the FtsH hexamer has been proposed based on x-ray crystallography of bacterial proteases (16, 17, 19, 20). The hexameric structure of FtsH from the thermophilic bacterium Aquifex aeolicus shows a flat cylinder-like shape with a diameter of 135 Å and a height of 65 Å (20). The structure shows a flexible conformation between the open and closed structures, which take different shapes depending on activation of ATPase and protease activities (36). Because the membrane protein substrates of FtsH proteases have to be extracted from the lipid bilayer, the ATPase domains of FtsH that recognize and unfold the substrates should come close to the substrates on the surface of thylakoids upon proteolysis. The D1 protein in PSII has been suggested to be the substrate of FtsH (3–8, 37). The proposed cleavage site is either the N terminus (38) or the DE loop of the D1 protein (2, 3), which is exposed to the stroma side and becomes a target of the thylakoid FtsH. Although the structure of the isolated hydrophilic part of FtsH has been solved by x-ray crystallography, the native conformation of FtsH in the membranes is not known. It is possible that the presence of the N-terminal transmembrane helices of FtsH and the lipid bilayer induce a different conformation of the FtsH hexamer from the non-membrane-bound structure reported so far.
Thylakoid stacking in higher plant chloroplasts has been investigated extensively (24, 25). The most recent study showed the three-dimensional organization of thylakoid membranes with dual-axis electron microscope tomography (39). According to this study, each membrane unit in the grana is connected to its neighbors as well as to the surrounding stroma thylakoids; thus the grana show highly connected morphologies. Under these conditions, the movement of protein complexes in the grana may be significantly restricted. However, light stress and heat stress induce unstacking of thylakoids (3, 30), which should increase the mobility of the protein complexes on the thylakoids. It was reported that within the grana, the surface of adjacent layers of the membrane are separated by ∼60 Å in the dark-adapted sample (40). If that is correct, FtsH hexamers can access the space between the stacked thylakoids in the grana, but they are also tightly oppressed by the adjacent membrane and therefore immobile in darkness. This situation may, however, be suitable for avoiding unnecessary degradation of the D1 protein.
Light or heat stress causes damage to the D1 protein, and significant unstacking of thylakoids takes place simultaneously (3, 30). This thylakoid unstacking may stimulate lateral diffusion of FtsH in the grana including the grana margins, making it easy for FtsH to access the damaged PSII core. Under low light, reversible swelling of thylakoids takes place because of electron transport-coupled H+ transport from the stroma to the thylakoid lumen with a concomitant uptake of water into the lumenal space (41), which should also change the distribution of protein complexes including the PSII complexes and FtsH hexamers.
The presence of D1 degradation activity in the grana that was stimulated by ZnCl2 and inhibited by the addition of EDTA suggests the presence of a metalloprotease, most probably FtsH, in the grana (Fig. 4). Degradation of the D1 protein in PSII complexes was reported previously (42). The protease responsible for D1 degradation under light stress has been suggested to be serine-type, and CP43 in the PSII core complex was once reported to have the serine-type protease activity (43), although it has been not confirmed since then. Thus the long-sought serine-type protease is not clearly identified yet. More recent studies with the mutants of a cyanobacterium Synechocystis PCC6803 and also with those of A. thaliana suggest involvement of a metalloprotease FtsH in the degradation of the D1 protein after light stress (4–7, 9). Our present results suggest that FtsH is involved in the proteolysis of the photodamaged D1 protein in the grana.
Before FtsH carries out degradation of the D1 protein, the D1 protein may be dephosphorylated, and CP43 should be detached from the PSII complex (2). Thus, dephosphorylation of the D1 protein and dissociation of CP43 from the PSII complex may be the rate-limiting step in the degradation of the D1 protein. However, the requirement of dephosphorylation of the D1 protein before degradation of D1 was questioned by the study using a STN7/8 mutant of A. thaliana, where the D1 protein was not phosphorylated because of the lack of a kinase (44). If dephosphorylation of the D1 protein is not needed for subsequent degradation of the D1 protein, dissociation of CP43 from PSII complexes may become a major rate-limiting step in the degradation of D1. The approach of active FtsH proteases to the damaged D1 protein will be the next rate-limiting step, as described above.
In thylakoid membranes, hexameric FtsH proteases were detected near the PSII complexes and were shown to maintain their hexameric structure through light stress and moderate heat stress (Fig. 6). Previously it was shown by mass spectrometry with a cyanobacterium that FtsH is present in the PSII reaction center complexes (45). Our present results suggest that the grana, including the grana margins and grana end membranes, are probably the areas where degradation of the D1 protein takes place in spinach thylakoids. Consecutive steps including monomerization of PSII dimers, detachment of CP43 from the PSII complexes, build-up of the proteolysis-active FtsH hexamers, and access of hexameric FtsH to the damaged D1 protein possibly take place in the grana.
Considering the efficiency of D1 degradation under stress, a close neighbor relationship between the PSII complex and FtsH proteases should exist in the grana. The data herein showing co-migration of PSII complexes and FtsH protease in sucrose density gradient centrifugation and chemical cross-linking of LHCII and FtsH proteases strongly support the localization of FtsH hexamers near the PSII-LHCII supercomplexes (Fig. 5).
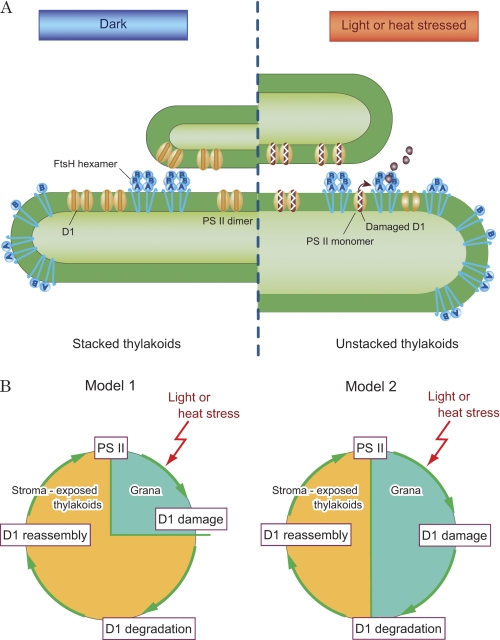
In conclusion, localization of FtsH near the PSII complex in the grana is probably the most efficient way to repair the photo- or heat-damaged D1 protein in the PSII complex that is highly enriched in the grana (Fig. 7A). This localization of FtsH most likely represents an effective way to circumvent long distance transfer of proteases and damaged PSII complexes through the crowded traffic present on the thylakoid membrane. To maintain the efficient degradation of the D1 protein, the FtsH hexamers should be juxtapositioned to the PSII complex to access the damaged D1 protein immediately. We thus propose a new model (Fig. 7B) to the damage-degradation process of the D1 protein, which has been based on the lengthy migration of both the damaged substrate proteins and proteases present in thylakoids. In this model, we suggest that both the damage to the D1 protein and degradation of the D1 protein occur in the grana.
FIGURE 7.
A schematic representation of the distribution of FtsH proteases in thylakoid membranes and models showing turnover of the D1 protein. A, distribution of FtsH in thylakoid membranes. Hexameric FtsH proteases are abundant at the grana regions. Under light or heat stress, the damaged PSII dimers are converted to monomers, and degradation of the damaged D1 protein is initiated by the action of FtsH proteases that are present near the PSII complexes in the grana. In contrast, FtsH proteases with various subunit structures exist in the stroma thylakoids, and they probably represent the monomers, intermediate oligomers, and hexamers in the course of the assembly and degradation process of FtsH. Both the assembly and degradation of FtsH are possibly triggered by light and heat stresses. Under these conditions, the thylakoids show swelling and unstacking, which may stimulate the interaction between FtsH proteases and damaged PSII complexes. B, two models depicting turnover of the D1 protein under light or heat stress. Model 1 indicates that degradation of the D1 protein occurs exclusively in the unstacked regions of thylakoids, whereas Model 2 predicts that D1 degradation takes place both in the grana and the unstacked regions of thylakoids.
Supplementary Material
Acknowledgments
We thank Dr. W. Sakamoto (Okayama University) for kindly providing the antibody against VAR2. Thanks are also due to Dr. Björn Lundin for valuable discussion and to Anna Fujiwara and Daisuke Nanba for technical assistance.
This work was supported by a Grant-in-Aid for Scientific Research Number 20570039 from the Ministry of Education, Culture, Sports, Science and Technology of Japan, the Wesco Science Promotion Foundation, and the Ryobi Foundation (to Y. Y.). Support also comes from Japan Society for the Promotion of Science Research Fellowships for Young Scientists (to Miho Yoshioka).

The on-line version of this article (available at http://www.jbc.org) contains supplemental Figs. S1–S3.
- PSII
- Photosystem II
- LHCII
- the light-harvesting chlorophyll-protein complex of PSII
- HTG
- n-heptyl-β-d-thioglucoside
- CN-PAGE
- clear native PAGE
- DM
- n-dodecyl β-d-maltoside
- EDC
- 1-ethyl-3-(3-dimethylaminopropyl)-carbodi-imide
- BS3
- bis(sulfosuccinimidyl)suberate
- PsaA
- one of the two major core proteins of Photosystem I
- Tricine
- N-[2-hydroxy-1,1-bis(hydroxymethyl)ethyl]glycine
- cyt
- cytochrome.
REFERENCES
- 1.Barber J., Andersson B. (1992) Trends Biochem. Sci. 17, 61–66 [DOI] [PubMed] [Google Scholar]
- 2.Aro E. M., Virgin I., Andersson B. (1993) Biochim. Biophys. Acta 1143, 113–134 [DOI] [PubMed] [Google Scholar]
- 3.Yamamoto Y., Aminaka R., Yoshioka M., Khatoon M., Komayama K., Takenaka D., Yamashita A., Nijo N., Inagawa K., Morita N., Sasaki T. (2008) Photosynth. Res. 98, 589–608 [DOI] [PubMed] [Google Scholar]
- 4.Lindahl M., Tabak S., Cseke L., Pichersky E., Andersson B., Adam Z. (1996) J. Biol. Chem. 271, 29329–29334 [DOI] [PubMed] [Google Scholar]
- 5.Bailey S., Thompson E., Nixon P. J., Horton P., Mullineaux C. W., Robinson C., Mann N. H. (2002) J. Biol. Chem. 277, 2006–2011 [DOI] [PubMed] [Google Scholar]
- 6.Silva P., Thompson E., Bailey S., Kruse O., Mullineaux C. W., Robinson C., Mann N. H., Nixon P. J. (2003) Plant Cell 15, 2152–2164 [DOI] [PMC free article] [PubMed] [Google Scholar]
- 7.Adam Z., Rudella A., van Wijk K. J. (2006) Curr. Opin. Plant. Biol. 9, 234–240 [DOI] [PubMed] [Google Scholar]
- 8.Yoshioka M., Uchida S., Mori H., Komayama K., Ohira S., Morita N., Nakanishi T., Yamamoto Y. (2006) J. Biol. Chem. 281, 21660–21669 [DOI] [PubMed] [Google Scholar]
- 9.Andersson B., Aro E. M. (1997) Physiol. Plant. 100, 780–793 [Google Scholar]
- 10.Ito K., Akiyama Y. (2005) Annu. Rev. Microbiol. 59, 211–231 [DOI] [PubMed] [Google Scholar]
- 11.Sakamoto W., Zaltsman A., Adam Z., Takahashi Y. (2003) Plant Cell 15, 2843–2855 [DOI] [PMC free article] [PubMed] [Google Scholar]
- 12.Sinvany-Villalobo G., Davydov O., Ben-Ari G., Zaltsman A., Raskind A., Adam Z. (2004) Plant Physiol. 135, 1336–1345 [DOI] [PMC free article] [PubMed] [Google Scholar]
- 13.Zaltsman A., Ori N., Adam Z. (2005) Plant Cell 17, 2782–2790 [DOI] [PMC free article] [PubMed] [Google Scholar]
- 14.Chen M., Choi Y., Voytas D. F., Rodermel S. (2000) Plant J. 22, 303–313 [DOI] [PubMed] [Google Scholar]
- 15.Sakamoto W., Tamura T., Hanba-Tomita Y., Murata M. (2002) Genes Cells 7, 769–780 [DOI] [PubMed] [Google Scholar]
- 16.Krzywda S., Brzozowski A. M., Verma C., Karata K., Ogura T., Wilkinson A. J. (2002) Structure 10, 1073–1083 [DOI] [PubMed] [Google Scholar]
- 17.Bieniossek C., Schalch T., Bumann M., Meister M., Meier R., Baumann U. (2006) Proc. Natl. Acad. Sci. U.S.A. 103, 3066–3071 [DOI] [PMC free article] [PubMed] [Google Scholar]
- 18.Baumeister W., Walz J., Zühl F., Seemüller E. (1998) Cell 92, 367–380 [DOI] [PubMed] [Google Scholar]
- 19.Niwa H., Tsuchiya D., Makyio H., Yoshida M., Morikawa K. (2002) Structure 10, 1415–1423 [DOI] [PubMed] [Google Scholar]
- 20.Suno R., Niwa H., Tsuchiya D., Zhang X., Yoshida M., Morikawa K. (2006) Mol. Cell 22, 575–585 [DOI] [PubMed] [Google Scholar]
- 21.Adam Z., Clarke A. K. (2002) Trends Plant Sci. 7, 451–456 [DOI] [PubMed] [Google Scholar]
- 22.Kirchhoff H. (2008) Trends Plant Sci. 13, 201–207 [DOI] [PubMed] [Google Scholar]
- 23.Mullineaux C. W. (2008) Photochem. Photobiol. 84, 1310–1316 [DOI] [PubMed] [Google Scholar]
- 24.Albertsson P. (2001) Trends Plant Sci. 6, 349–358 [DOI] [PubMed] [Google Scholar]
- 25.Mustárdy L., Garab G. (2003) Trends Plant Sci. 8, 117–122 [DOI] [PubMed] [Google Scholar]
- 26.Yamamoto Y., Nishi Y., Yamasaki H., Uchida S., Ohira S. (2004) Methods Mol. Biol. 274, 217–227 [DOI] [PubMed] [Google Scholar]
- 27.Yamamoto Y., Sakuma S., Shen J. R. (2004) Methods Mol. Biol. 274, 29–36 [DOI] [PubMed] [Google Scholar]
- 28.Enami I., Kamino K., Shen J. R., Satoh K., Katoh S. (1989) Biochim. Biophys. Acta 977, 33–39 [Google Scholar]
- 29.Leto K. J., Bell E., McIntosh L. (1985) EMBO J. 4, 1645–1653 [DOI] [PMC free article] [PubMed] [Google Scholar]
- 30.Khatoon M., Inagawa K., Pospísil P., Yamashita A., Yoshioka M., Lundin B., Horie J., Morita N., Jajoo A., Yamamoto Y. (2009) J. Biol. Chem. 284, 25343–25352 [DOI] [PMC free article] [PubMed] [Google Scholar]
- 31.Yamamoto Y., Doi M., Tamura N., Nishimura M. (1981) FEBS Lett. 133, 265–268 [Google Scholar]
- 32.Berthold D. A., Babcock G. T., Yocum C. F. (1981) FEBS Lett. 134, 231–234 [Google Scholar]
- 33.Kuwabara T., Murata N. (1982) Plant Cell Physiol. 23, 533–539 [Google Scholar]
- 34.Yamamoto Y., Ueda T., Shinkai H., Nishimura M. (1982) Biochim. Biophys. Acta 679, 347–350 [Google Scholar]
- 35.Dunahay T. G., Staehelin L. A., Seibert M., Ogilvie P. D., Berg S. P. (1984) Biochim. Biophys. Acta 764, 179–193 [Google Scholar]
- 36.Bieniossek C., Niederhauser B., Baumann U. M. (2009) Proc. Natl. Acad. Sci. U.S.A. 106, 21579–21584 [DOI] [PMC free article] [PubMed] [Google Scholar]
- 37.Komenda J., Barker M., Kuviková S., de Vries R., Mullineaux C. W., Tichy M., Nixon P. J. (2006) J. Biol. Chem. 281, 1145–1151 [DOI] [PubMed] [Google Scholar]
- 38.Komenda J., Tichy M., Prásil O., Knoppová J., Kuviková S., de Vries R., Nixon P. J. (2007) Plant Cell 19, 2839–2854 [DOI] [PMC free article] [PubMed] [Google Scholar]
- 39.Shimoni E., Rav-Hon O., Ohad I., Brumfeld V., Reich Z. (2005) Plant Cell 17, 2580–2586 [DOI] [PMC free article] [PubMed] [Google Scholar]
- 40.Arvidsson P. O., Sundby C. (1999) Aust. J. Plant Physiol. 26, 687–694 [Google Scholar]
- 41.Packer L., Murakami S. (1972) Methods Enzymol. 24, 181–205 [DOI] [PubMed] [Google Scholar]
- 42.Shipton C. A., Barber J. (1991) Proc. Natl. Acad. Sci. U.S.A. 88, 6691–6695 [DOI] [PMC free article] [PubMed] [Google Scholar]
- 43.Salter A. H., Virgin I., Hagman A., Andersson B. (1992) Biochemistry 31, 3990–3998 [DOI] [PubMed] [Google Scholar]
- 44.Bonardi V., Pesaresi P., Becker T., Schleiff E., Wagner R., Pfannschmidt T., Jahns P., Leister D. (2005) Nature 437, 1179–1182 [DOI] [PubMed] [Google Scholar]
- 45.Kashino Y., Lauber W. M., Carroll J. A., Wang Q., Whitmarsh J., Satoh K., Pakrasi H. B. (2002) Biochemistry 41, 8004–8012 [DOI] [PubMed] [Google Scholar]
Associated Data
This section collects any data citations, data availability statements, or supplementary materials included in this article.


