

Abstract
Epilepsy is a neurological disorder characterized by recurrent seizures which affects about 1% people worldwide. During the past decades, some mechanisms involved in ictogenesis (generation of seizures) have been identified and, to some extent, partially understood. However, regarding epileptogenesis (process by which a neuronal system becomes epileptic), underlying mechanisms remain elusive. This difficulty is mostly related to the fact that epileptogenesis can only be addressed using experimental models. In this study, we have analyzed the shape of a specific electrophysiological pattern, referred to as “epileptic spike”, encountered during the epileptogenesis process in an in vivo model of temporal lobe epilepsy (mouse, kainate). Results show that the features of these transient events (duration and amplitude) change as a function of time as the brain evolves towards the chronic epileptic state characterized by the appearance of spontaneous seizures. Using a detailed computational model of the hippocampus (CA1 sub-field), an interpretation of observed modifications is provided, in relationship with possible alterations that take place in underlying neuronal circuits.
I. Introduction
Epilepsy is characterized by recurrent seizures that dramatically affect the patient’s life. At present, the processes by which the normal brain develops epilepsy (i.e. epileptogenesis) are still largely unknown [1] and progress must be accomplished in order to understand how hyperexcitability develops in neuronal systems up to a point where they start to spontaneously generate seizures. Conversely to ictogenesis (transition from interictal to ictal activity), epileptogenesis can only be studied in experimental models [2, 3]. Typically, in such models, a damaging insult (like traumatic brain injury, stroke or cerebral infections) is provoked in the mammalian brain which undergoes subsequent molecular, cellular and network alterations. These alterations eventually lead to the occurrence of recurrent seizures (that define the chronic epileptic state) after a more or less long period of time, often referred to as the latent period (during which no seizures are observed).
In this study, we focused on an in vivo model of epileptogenesis that showed relevance in the context of mesial temporal lobe epilepsy (TLE) which is the most common form of refractory epilepsy. In this mouse model treated with kainic acid (KA) [4], we recorded intracerebral electroencephalographic (iEEG) signals from the hippocampus and cerebral cortex. These electrophysiological signals showed dramatic changes on a day-after-day basis. In particular, after a few days following the KA microinjection, isolated paroxysmal events (so-called “epileptic spikes”) could be observed in iEEG signals, as also reported elsewhere [4]. It is noteworthy that such events are also observed in epileptic patients, in particular using iEEG (during pre-surgical evaluation of drug-resistant epilepsy). The clinical value of epileptic spikes is still a matter of debate [5, 6]. The objective of this study was two-fold: i) to follow, in time, the evolution of epileptic spikes (number, shape features) as epileptogenesis progressively develops in the mouse brain and ii) to relate some relevant changes to possible underlying alterations of neuronal circuits that generate such events. Results showed that epileptic spikes detected over the latent period underwent significant changes that were reproducible among KA-treated animals. Such changes could be explained by a computational network model of detailed neurons that we recently developed to interpret local field potential recorded in the hippocampus [7].
II. Material and Methods
A. In vivo model of temporal lobe epilepsy
1. Animals and surgery
Experiments were conducted on eight 80±5 day old C57BL/6J (B6) male mice housed in individual cages with food and water ad libitum and kept in a 21±1°C and 12-h light/dark cycle conditions. All animal procedures were conducted in accordance with the European Communities Council Directive of 24 November 1986 (86/609/EEC). The experimental design was made to minimize animal suffering and reduce the number of animals used.
Five mice were stereotaxically injected under general anesthesia (chloral hydrate 400 ml/kg i.p.) with 50 nl of a 20 mM solution of kainic acid (KA) in 0.9% NaCl into the right dorsal hippocampus (anteroposterior=−2, mediolateral=−1.5, dorsoventral=−2 mm) with bregma as reference according to Franklin & Paxinos atlas. Three control mice were injected with saline solution under the same protocol.
After intrahippocampal injection, all mice were implanted with a bipolar electrode inserted into the injected hippocampus with the same coordinate as for the injection site and two monopolar surface electrodes placed over the right frontoparietal cortex and over the cerebellum (reference electrode). The electrodes were made of a polyester isolated stainless steel wire (Ø=139 μm) and fixed to the skull with cyanoacrylate and dental acrylic cement and finally connected to a female connector placed on top of the cement. Upon completion of the experiments, histological analyses were performed to verify the location of the KA injection, the location of the hippocampal electrode and the pattern of neuronal loss/dispersion of dentate gyrus granule cells.
2. EEG recordings
iEEG signals were recorded on a video-EEG monitoring system (Deltamed TM). Signals were sampled at 256 Hz. One hardware high-pass filter was present in the acquisition procedure (cut-off frequency: 0.16 Hz) in order to remove DC offset or some very slow activity that may contaminate the baseline. It had no effect on the shape of epileptic events. Settings of the acquisition procedure remained the same among animals and over the total recording period (about 1 month).
EEG activities were recorded in freely moving animals placed in a transparency plexiglas cage placed in a Faraday cage. Mice were recorded between 1 pm and 5 pm during 3 hours, at regular intervals (3, 6, 9, 12, 15, 18, 21, 24, 27 and 30 days after surgery).
B. Intracerebal EEG analysis
1. Epileptic spike detection
A semi-interactive spike detection method was developed in order to extract events of interest, prior to the characterization of their shape. The detection made use of two types of a priori information about events to be detected: i) a “fast” spike component is always present and ii) the polarity of this spike component is positive (according to the bipolar montage that was used).
Based on these assumptions, we designed a two-stage detection procedure. The first stage was a pre-processing of iEEG signals aimed at computing a time-varying quantity that reflects, by its mean value, the presence of events of interest. The second stage performed an optimal detection of significant changes in the mean of the above quantity.
Regarding the first stage, the iEEG signal was first centered (DC offset removal). Negative amplitudes of the filtered signal were set to zero in order to only keep transients of “positive polarity”. It was then squared and band-pass filtered using a Gabor filtering technique. The filter length was 0.2 seconds. The bandwidth that led to “maximal response” in the presence of epileptic spikes was 20 Hz (20–40 Hz). Finally, the power of this filtered signal was used as the input quantity to the second stage. Indeed, this time-varying quantity takes low values in absence of “sharp transients” in the original signal. Conversely, its mean increases abruptly in the presence of “sharp transients”. In order detect these changes (second stage), we used the optimal algorithm, initially proposed by Page and Hinkley [8]. The key idea of this algorithm (also known as the “cumulative sum algorithm”) is to perform a test on the mean of the quantity to analyze. Performances of this algorithm depend on two parameters, namely a bias value v a threshold value λ, allowing for deciding if a significant change has occurred. Both parameters were defined by the expert using a user-friendly interface that graphically represents estimated detection times upon iEEG signals for manually-adjusted parameter values. Once adjusted, parameters did not change when the detection procedure was applied on long-duration signals. Finally, we estimated the false alarm (false positive) and the non detection (false negative) rate on a subset of data. The following performance values could be evaluated: specificity = 85% and sensitivity = 70%.
2. Epileptic spike characterization
Epileptic spikes were characterized using time-domain features as depicted in Fig 1.C. These features included: the amplitude and duration of the spike component w.r.t. baseline (APeak, DPeak) as well as the amplitude and duration of the negative wave that follows the spike (AWave, DWave).
Fig. 1.
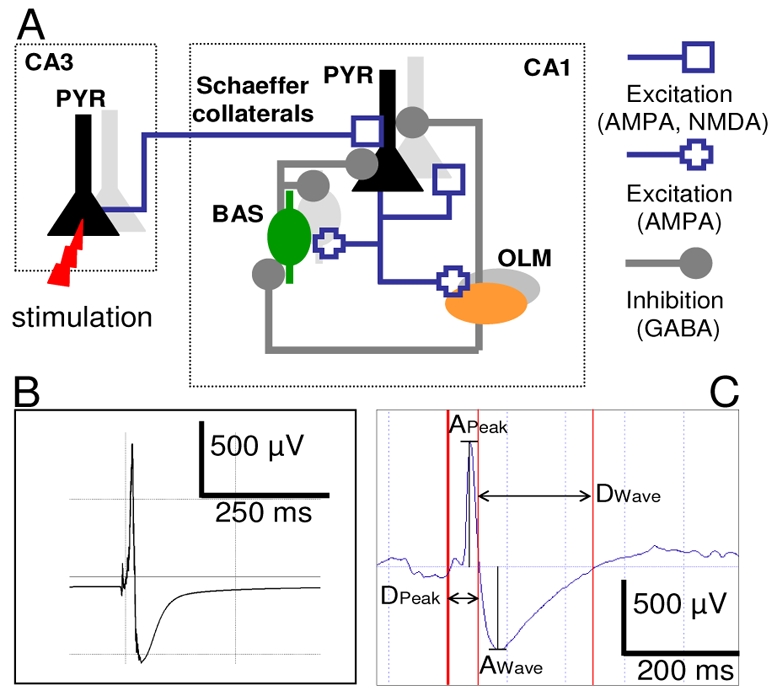
A. Schematic representation of the computational model. The network model included about 2500 pyramidal cells (PYR), 312 basket (BAS) and 312 oriens-lacunosum moleculare (OLM) interneurons spatially arranged in 3D volume (not shown here). Neurons models were interconnected through glutamateric and GABAergic synapses that reproduce the physiological organization and main features of the hippocampus CA1 subfield. CA1 network was simulated by an “external” array of pyramidal cells representing CA3 cells afferent activity. The recording electrode was positioned at the center of the 3D volume. See [7] for details. B. Example of simulated epileptic spike. C. Example of real epileptic spike and measured time-domain features.
The above features were computed using an automatic algorithm. First, markers were determined to separate peaks and waves from the background activity. These instants directly gave us the durations DPeak and DWave. Then, we calculated the maximum value of the peaks and the minimum value of the waves to obtain the amplitudes APeak and AWave. Total amplitude was estimated as A = APeak+ AWave and total duration was estimated as D = DPeak+ DWave.
To prevent possible variability of amplitude between the different mice, amplitudes were normalized by standard deviation of the signal (only calm phases) of the corresponded day. We arbitrarily fixed three threshold conditions for which a detected event is not considered as a spike: i) 0.2 × APeak < − AWave <1.5 × APeak, ii) DPeak < DWave, and iii) DPeak+ DWave < 300 ms. These conditions allowed us to exclude possible artifacts.
C. Modeling of intracerebal EEG spikes generated in the hippocampus
In order to interpret the evolution of features actually measured on epileptic spikes, we made use of a recently published computational model aimed at mimicking the hippocampus CA1 subfield activity [7]. In brief, this model consisted in a detailed representation of the CA1 network which includes pyramidal (PYR) cells and interneurons (basket - BAS - and oriens-lacunosum moleculare - OLM - cells). Two-compartment (PYR) and one-compartment (BAS and OLM) neuron models were based on the Hodgkin and Huxley formalism [9, 10]. They were connected to reproduce the CA1 circuit (fig. 1.A) in accordance with commonly accepted assumptions (location of synapses and receptors, synaptic strength, connectivity patterns).
Connections were either glutamatergic (AMPA and NMDA) and GABAergic synapses. The total number of cells was defined as 3124 upon biophysical arguments (PYR: 80%, interneurons: 20%). Connectivity patterns were fixed according to literature data. Finally, the whole network was stimulated by an afferent volley of quasi-synchronous action potentials coming from an “external array of cells”, in order to mimic the input from CA3 to CA1. The reconstruction of the local field potentials (LFP) in the model made use of the dipole theory. Three assumptions were made.
First, due to their spatial arrangement ‘in palisades’, pyramidal cells are the main contributors to the LFP. Second, each pyramidal cell is considered as a current source (longitudinal current flowing along the somatodendritic axis) positioned within a volume conductor characterized by a homogeneous conductivity. Third, according to the superposition theorem, the contributions of all pyramidal cells sum up instantaneously at the level of the extracellular recording electrode, placed at the center of the modeled network. An example of simulated spike is displayed in Fig. 1.B.
III. Results
Typical examples of spikes detected from day 3 to day 30 after KA injection are displayed in Fig. 2. The general shape of detected events was found to be reproducible, with a visually-noticeable increase of amplitude and duration as a function of day of recording. The semi-automatic detection procedure was applied in the 50 recordings and led to the identification of 3683 spikes in the 5 KA-treated mice. No spike was detected in the three control animals. The total number of spikes increased significantly from day 3 to day 30, as shown in Fig. 3.
Fig. 2.
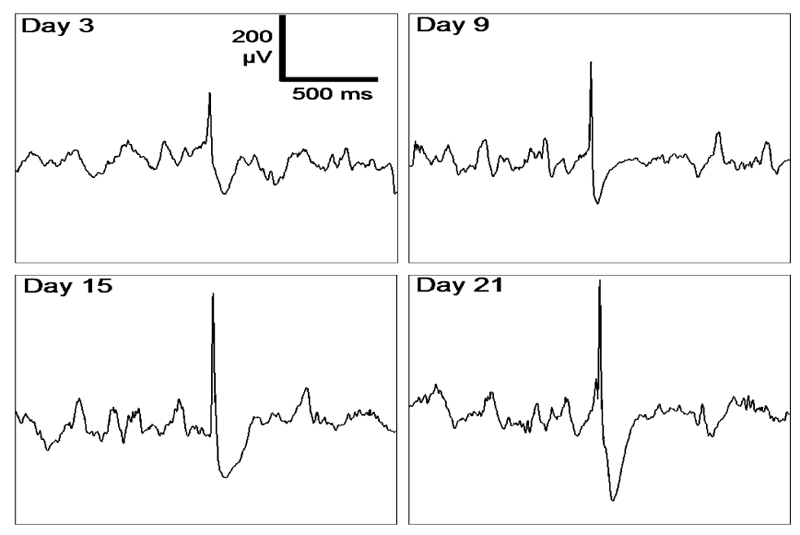
Typical paroxysmal events (“epileptic spikes”) recorded from the mouse hippocampus ipsilaterally with respect to the KA injection side (3, 9, 15 and 21 days after injection). These transient events are not observed in control animals. The shape evolves with epileptogenesis. Note that the amplitude of the background activity remains constant in time.
Fig. 3.
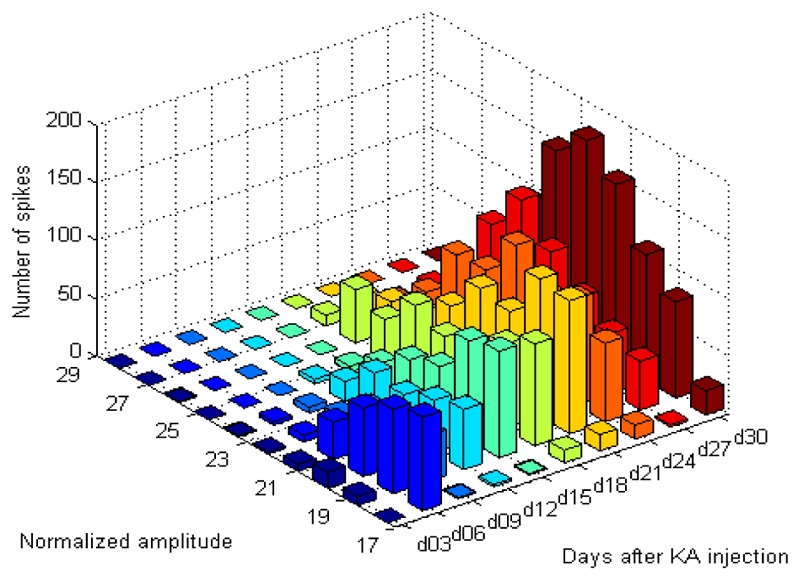
Histogram that presents the number of spikes in each range of normalized amplitude. These amounts are given versus days after surgery (coded in colors).
Extracted features (amplitude and duration) were then grouped by subjects and days. Averages of each group were analyzed using the Repeated-measures one-way ANOVA. Curves represent averages and standard errors versus days in Fig 4A and Fig 4B. Results showed a statistically-significant increase of both features. In particular, distributions of amplitudes computed over the [day 18, day 30] period are significantly different from those computed over the [day 03, day 15] period. The increase in the mean values of this feature is especially due to the presence of more and more high-amplitude spikes through days.
Fig. 4.
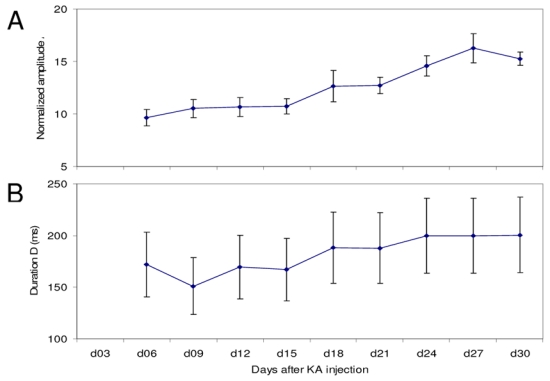
Evolution of features of spikes through epileptogenesis. Dots Represents mean values and whiskers represent standard errors. Repeated-measures one-way ANOVA were performed separately on both amplitude and duration. They show a significant increase for amplitude (p<0.1%) and duration (p<2%). Day 3 was not considered for analysis due to a lack of data.
Eventually, we searched the computational model for some excitation- and inhibition-related conditions that could explain the observed modifications. Although thorough parameter sensitivity is still to be performed, we were able to identify some key parameters which directly influence the amplitude and duration of simulated spikes (Fig. 5). Precisely, the increase (× 2) of AMPAergic and the decrease (× 0.3) of GABAergic led to an amplitude increase equal to 65%. The GABAA reversal potential was also identified as playing a major role of the spike duration.
Fig. 5.
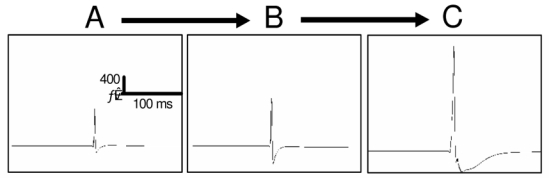
Simulated epileptic spikes obtained for (A→B) increased AMPAergic currents and reduced GABAergic on PYR cells and for (B→C) increased GABAA reversal potential.
IV. Discussion and Conclusion
We focused on a particular event, i.e. the epileptic spike, that appears in the epileptogenic brain. From a methodological viewpoint, we could verified that the spike detection procedure remain a critical step. By removing all artifacts in iEEG signals and by adapting the detector to events of interest, we were able to show that the shape features of epileptic spikes do change as epilepsy progressively develops in the mouse brain.
Interestingly, interictal spikes in an rodent in vivo model of TLE (repetitive injection of KA) have been cautiously quantified during epileptogenesis [11]. In this study, authors showed that rats that developed chronic epilepsy had significantly increased interictal iEEG spike frequencies compared to those that did not develop epilepsy. Our experimental data corroborate this study as we also noticed the spike frequency increase, although our in vivo model is different. Moreover, authors suggested that increase in frequency of interictal spikes is a predictive bio-marker of epileptogenicity. In this respect, our results go beyond their quantification of the spike frequency and show that the amplitude and duration of these typical events may reflect some plasticity-related effects taking place during epileptogenesis. Following this idea, we introduced a computational model as a bridge between recorded iEEG signals and mechanisms involved in the underlying neuronal circuits [12]. We found that some specific model parameters could explain the observed modifications of spikes, in terms of amplitude and duration. Interestingly, regarding the increase of AMPAergic currents, some in vitro studies have shown that seizure-like ictal episodes are sufficient to cause i) fast and lasting changes in the excitation/inhibition balance in hippocampal networks [13, 14], ii) a long-term potentiation (LTP) of Schaffer collateral evoked field excitatory post-synaptic potentials (EPSPs) in the CA1 [14] and iii) an enhancement of AMPA receptor-mediated transmission of CA3–CA1 synapses [15].
Overall, our results demonstrate that epileptic spikes could constitute potential bio-markers of the epileptogenesis process and that modeling can be used to bridge between these bio-markers and the underlying alterations taking place in the epileptogenic brain tissue.
Acknowledgments
The authors wish to thank Gabriel Dieuset for his assistance in the experimental procedures.
This work was supported by Region de Bretgane (CREATE call 2009, EPIGONE Project). CH, SDG, BM and FW are with INSERM U642; Université de Rennes 1; Rennes; F-35000; PB is with CNRS UMR6026; Université de Rennes 1; Rennes; F-35000.
References
- 1.Dichter MA. Emerging concepts in the pathogenesis of epilepsy and epileptogenesis. Arch Neurol. 2009;66:443–7. doi: 10.1001/archneurol.2009.10. [DOI] [PubMed] [Google Scholar]
- 2.Bender RA, Baram TZ. Epileptogenesis in the developing brain: what can we learn from animal models? Epilepsia. 2007;48(Suppl 5):2–6. doi: 10.1111/j.1528-1167.2007.01281.x. [DOI] [PMC free article] [PubMed] [Google Scholar]
- 3.Pitkanen A, Kharatishvili I, Karhunen H, Lukasiuk K, Immonen R, Nairismagi J, Grohn O, Nissinen J. Epileptogenesis in experimental models. Epilepsia. 2007;48(Suppl 2):13–20. doi: 10.1111/j.1528-1167.2007.01063.x. [DOI] [PubMed] [Google Scholar]
- 4.Bouilleret V, Ridoux V, Depaulis A, Marescaux C, Nehlig A, Le Gal La Salle G. Recurrent seizures and hippocampal sclerosis following intrahippocampal kainate injection in adult mice: electroencephalography, histopathology and synaptic reorganization similar to mesial temporal lobe epilepsy. Neuroscience. 1999;89:717–29. doi: 10.1016/s0306-4522(98)00401-1. [DOI] [PubMed] [Google Scholar]
- 5.Avoli M, Biagini G, de Curtis M. Do Interictal Spikes Sustain Seizures and Epileptogenesis? Epilepsy Curr. 2006;6:203–207. doi: 10.1111/j.1535-7511.2006.00146.x. [DOI] [PMC free article] [PubMed] [Google Scholar]
- 6.Bourien J, Bartolomei F, Bellanger JJ, Gavaret M, Chauvel P, Wendling F. A method to identify reproducible subsets of co-activated structures during interictal spikes. Application to intracerebral EEG in temporal lobe epilepsy. Clin Neurophysiol. 2005;116:443–55. doi: 10.1016/j.clinph.2004.08.010. [DOI] [PubMed] [Google Scholar]
- 7.Demont-Guignard S, Benquet P, Gerber U, Wendling F. Analysis of intracerebral EEG recordings of epileptic spikes: insights from a neural network model. IEEE Trans Biomed Eng. 2009;56:2782–95. doi: 10.1109/TBME.2009.2028015. [DOI] [PMC free article] [PubMed] [Google Scholar]
- 8.Hinkley D. Inference about the change point from cumulative sumtests. Biometrika. 1970;58:509–523. [Google Scholar]
- 9.Hodgkin AL, Huxley AF. The components of membrane conductance in the giant axon of Loligo. J Physiol. 1952;116:473–96. doi: 10.1113/jphysiol.1952.sp004718. [DOI] [PMC free article] [PubMed] [Google Scholar]
- 10.Hodgkin AL, Huxley AF, Katz B. Measurement of currentvoltage relations in the membrane of the giant axon of Loligo. J Physiol. 1952;116:424–48. doi: 10.1113/jphysiol.1952.sp004716. [DOI] [PMC free article] [PubMed] [Google Scholar]
- 11.White A, Williams PA, Hellier JL, Clark S, Edward Dudek F, Staley KJ. EEG spike activity precedes epilepsy after kainateinduced status epilepticus. Epilepsia. 51:371–83. doi: 10.1111/j.1528-1167.2009.02339.x. [DOI] [PMC free article] [PubMed] [Google Scholar]
- 12.Wendling F. Computational models of epileptic activity: a bridge between observation and pathophysiological interpretation. Expert Rev Neurother. 2008;8:889–96. doi: 10.1586/14737175.8.6.889. [DOI] [PMC free article] [PubMed] [Google Scholar]
- 13.Debanne D, Thompson SM, Gahwiler BH. A brief period of epileptiform activity strengthens excitatory synapses in the rat hippocampus in vitro. Epilepsia. 2006;47:247–56. doi: 10.1111/j.1528-1167.2006.00416.x. [DOI] [PubMed] [Google Scholar]
- 14.Lopantsev V, Both M, Draguhn A. Rapid plasticity at inhibitory and excitatory synapses in the hippocampus induced by ictal epileptiform discharges. Eur J Neurosci. 2009;29:1153–64. doi: 10.1111/j.1460-9568.2009.06663.x. [DOI] [PubMed] [Google Scholar]
- 15.Abegg MH, Savic N, Ehrengruber MU, McKinney RA, Gahwiler BH. Epileptiform activity in rat hippocampus strengthens excitatory synapses. J Physiol. 2004;554:439–48. doi: 10.1113/jphysiol.2003.052662. [DOI] [PMC free article] [PubMed] [Google Scholar]