

Abstract
We investigated the phenomenon of ultrasonic cleavage of DNA by analyzing a large set of cleavage patterns of DNA restriction fragments using polyacrylamide gel electrophoresis. The cleavage intensity of individual phosphodiester bonds was found to depend on the nucleotide sequence and the position of the bond with respect to the ends of the fragment. The relative intensities of cleavage of the central phosphodiester bond in 16 dinucleotides and 256 tetranucleotides were determined by multivariate statistical analysis. We observed a remarkable enhancement of the mean values of the relative intensities of cleavage (cleavage rates) in phosphodiester bonds following deoxycytidine, which diminished in the row of dinucleotides: d(CpG) > d(CpA) > d(CpT) >> d(CpC). The cleavage rates for all pairs of complementary dinucleotides were significantly different from each other. The effect of flanking nucleotides in tetranucleotides on cleavage rates of all 16 types of central dinucleotides was also statistically significant. The sequence-dependent ultrasonic cleavage rates of dinucleotides are consistent with reported data on the intensity of the conformational motion of their 5′-deoxyribose. As a measure of local conformational dynamics, cleavage rates may be useful for characterizing functional regions of the genome.
Introduction
The earliest observations of DNA ultrasonic fragmentation in aqueous solution were reported in 1952 (1). It was found that the viscosity of DNA solutions decreased with exposure to sonic waves, whereas the optical density at 260 nm remained unchanged. Subsequent analyses have shown that ultrasound irradiation of DNA solution leads to the cleavage and formation of double-stranded oligonucleotides of various lengths with a phosphorylated 5′-end and a hydroxyl group at the 3′-end (2–5). Experiments have also shown that ultrasonic cleavage of DNA represents a mechanochemical reaction induced by cavitational processes in irradiated solution (6).
Recent polyacrylamide gel (PAAG) electrophoresis studies of solutions containing 3′-end-labeled double-stranded DNA fragments treated with 44 kHz ultrasound revealed that the intensity of cleavage at a given position depends on the nucleotide sequence and occurs predominantly at the 5′-CpG-3′ dinucleotide (7), thus establishing the effects of sequence on ultrasonic cleavage.
The DNA nucleotide sequence determines favorable conformational states, as well as the dynamics and flexibility of those states (8–12). This property of DNA is crucial for protein-DNA and drug-DNA recognition (13–16). Various modes of protein-DNA recognition are based on the internal sequence-specific flexibility of DNA (17,18).
Data on the structural flexibility of short oligonucleotides have been obtained by various experimental methods, including crystal structure data sets (10,11,19), NMR, and Fourier transform infrared and Raman spectroscopy (12,20). The sensitivity of extensive DNA fragments to nonspecific nucleases has resulted in experimental data regarding their bendability (21,22), and the irregularity of accessible surface areas of the hydrogen atoms of the DNA backbone has been detected by oxidative strand scission (23–25).
Ultrasonic cleavage analysis is a new method for studying the sequence-dependent properties of lengthy DNA fragments (26,27). To conduct a comprehensive study of the sequence-dependent ultrasonic cleavage of DNA, we analyzed a large experimental data set covering ultrasonic cleavage obtained by sonication of 3′-end-labeled double-stranded restriction fragments of known sequences. All notations correspond to standard descriptions of DNA and RNA structures (28).
Materials and Methods
Restriction fragments of DNA were generated by digestion of λ DNA (Sibenzyme, Novosibirsk, Russia) and plasmids pBR322, pUC18, and pGEM7(f+) (Promega), and their modified analogs, which contained different insertions into the polylinkers by the corresponding restriction endonucleases.
The fragments were 3′-end-labeled with [α-33P]dATP, [α-33P]dCTP, or [α-32P]dATP (FGUP Institute of Reactor Materials, Zarechnii, Sverdlovskaya oblast, Russia) in the presence of the unlabeled other dNTP and the Klenow fragment of Escherichia coli DNA-polymerase I (Sibenzyme). The DNA fragments were isolated by nondenaturing PAAG in a 1-mm-thick 5% gel with subsequent elution and precipitation (29).
Sonication of DNA fragments
For sonication, 10 μL of DNA fragments (∼104 Bq) in water were mixed with 10 μL of 0.2 M NaOAc, pH 6.0, in the bottom of a thin-walled polypropylene microcentrifuge tube of 0.2 mL capacity (N801-0540; Perkin-Elmer). The final concentration of the fragments was 5–10 μg/mL (∼10 μM basepair).
The test tubes were placed in a Teflon ring that contained a central slot (15 mm in diameter) and radial slots for the test tubes. The test-tube ends were located ∼0.5 cm below the horn sonicator edge, which had a diameter of 12 mm. The ring and horn sonicator were placed in a vessel with water and crushed ice (see Fig. S1 in the Supporting Material). Ultrasound was generated by a 300 W generator UZDN-2T (Ukraine) with a frequency of 22 kHz using the maximum power output. The sonication was adjusted in continuous operation mode at 1-min intervals, and after each interval the ring was turned 180° and fresh ice was added. The ultrasonic power exerted on the system was determined calorimetrically and exceeded 60 W. To obtain rough measurements of the chemical effects induced by cavitation inside the tubes, we used a test tube containing 0.05 M KI in 0.025% starch solution. After 8 min of irradiation, the coloration extent was equal to that obtained by adding ∼0.1 mM of hydrogen peroxide. This yield is comparable to reported results obtained under normal temperature conditions and with ultrasound intensity exceeding 2 W/cm2 (30). It is worth noting that both low ultrasound frequency and low temperature conditions are known to increase the power of cavitational effects (6).
Separation of DNA fragments in denaturing gel
After sonication was completed, the samples were combined with 180 μL of a solution containing 0.15 M NaCl, 50 mM Tris-HCl (pH 7.5), and 10 mM EDTA. The samples were then extracted with phenol. The DNA was precipitated with ethanol, washed with 70% ethanol, dried, and dissolved in 1 μL of 95% formamide (which contained 15 mM EDTA (pH 8.0), 0.05% bromphenol blue, and 0.05% xylencyanol FF). It was then heated for 1 min at 90°C, rapidly cooled down to 0°C, and applied on denaturing PAAG (length: 40 cm; gradient width: 0.15–0.45 mm).
Electrophoresis was carried out for 55 min (100 W, 2500 V) at 60–70°C. Afterward, the gel was fixed in 10% acetic acid and dried on a glass plate pretreated with γ-methacrylpropyloxysilane (LKB, Sweden). The dried gel was exposed to a luminescent screen and then scanned with a Cyclone Storage Phosphor System device (Packard BioScience). Cleavage pattern bands were assigned to particular nucleotide sequences of fragments by comparison with the lanes of A+G track DNA samples. The nucleotide sequences and other supplementary materials are available at http://grok.imb.ac.ru/en/.
Gel analysis
To analyze the gels, we used the SAFA package (31) to align the gel lanes, calculate the overall intensity of each band, and correlate the band sequence with the corresponding nucleotide sequence. Band intensities are sensitive to various parameters of the experiment. To account for such effects, it was important to calculate the normalized values of cleavage intensities. The absolute value of an individual band's intensity, or cleavage intensity, is denoted as I, and the normalized value, or relative intensity of cleavage, is denoted as R. We normalized the band intensities by dividing their values by the local basic band intensity values, which were determined by using the moving-average method separately for each band (i.e., the intensity of each band was divided by the mean value calculated using the intensities of a number of adjacent bands). The optimal number of adjacent bands used for the mean intensity calculation has been shown to be 31. Lowering this number results in an increased scattering of data points, whereas increasing the number of adjacent bands does not change the ratio of the obtained relative intensities of cleavage but does lead to a decrease in the number of analyzed data points.
Results and Discussion
Fig. 1 demonstrates the gel image obtained after sonication of the DNA fragments for various periods of time. This image represents the results of ultrasonic irradiation of three fragments that differed in initial length (311, 251, and 218 basepairs, respectively) but shared the same basepair sequences. The left part of the gel contains lanes that correspond to cleavage of the longest fragment (lanes 1–6). The central part represents lanes corresponding to cleavage of the middle-sized fragment (lanes 7–12), and the lanes at the right side of the gel demonstrate the cleavage patterns of the shortest fragment (lanes 13–17). It is clear that increasing the irradiation time from 2 to 16 min leads to a sufficient increase in overall cleavage intensity for all three types of fragments. Fig. 1 also demonstrates that the addition of tiourea has no visible effect on the cleavage patterns (lanes 11 and 12). The same result was obtained when free radical scavengers (dithiothreitol and sodium ascorbate) were added to the irradiated solution (data not shown). On the other hand, adding 50% glycerol, which increased the viscosity of the solution by roughly 10-fold, led to a significant increase in cleavage intensities (lanes 3, 8, and 14). The cleavage patterns obtained by adding glycerol are similar to those obtained without it but with a longer irradiation time. Thus, increasing the viscosity of the solution leads to an overall increase in cleavage intensity but does not affect the relative intensities of cleavage. This dependence of the ultrasonic cleavage intensity on the solution viscosity is one of the distinctive features of a mechanochemical reaction (6).
Figure 1.
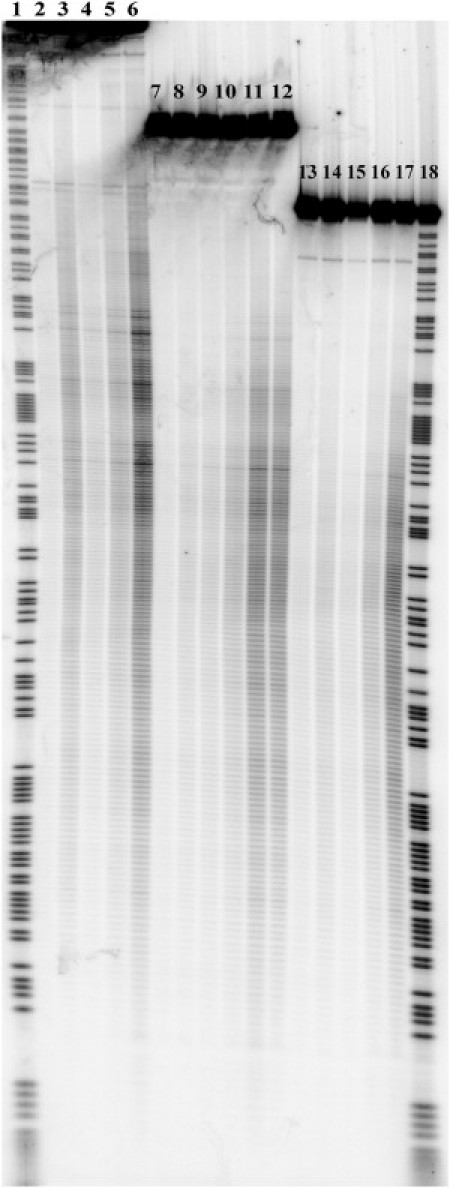
Cleavage pattern of DNA fragments in 6% denaturing PAAG after irradiation with ultrasound (22 kHz). Lanes 1 and 18: Chemical cleavage by purines. Lanes 2, 7, and 13: Sonication of fragments for 2 min. Lanes 3, 8, and 14: Sonication of fragments for 2 min in the presence of 50% glycerol. Lanes 4, 9, and 15: Sonication of fragments for 4 min. Lanes 5, 10, and 16: Sonication of fragments for 8 min. Lanes 6, 11, and 17: Sonication of fragments for 16 min. Lane 12: Sonication of fragments for 16 min in the presence of 0.5 M tiourea.
Fig. 1 also demonstrates the positional effect (i.e., the damping of ultrasonic cleavage) at sites that are closer to the ends of the DNA fragments. Accordingly, the darkest bands of the cleavage patterns that give the highest values of cleavage intensity correspond to breakages at the central part of the DNA fragments. This relevant feature of ultrasonic cleavage patterns of DNA also supports the idea of mechanochemical nature of the cleavage process observed in our experiments.
The significant role of the positional effect and the minor influence of free radical scavengers on the observed cleavage patterns lead us to conclude that the cleavage of DNA induced by free radicals in solution was negligible in our experiments. The distinctive features of free radical cleavage of DNA on the gel (i.e., the emergence of overall cleavage background with no positional preference) were observed only at higher temperature conditions (>25°C; data not shown).
Fig. 2 presents the results of the gel digitization. Profiles of the intensity of cleavage (I) for several lanes of Fig. 1 are shown. Profiles of the relative intensity of cleavage (R) calculated for 2 lanes by normalization procedure (which eliminates the positional effect) are given below the intensity profiles. The values of the relative intensities of cleavage along with the corresponding local nucleotide sequences are used as the input data for a statistical analysis of sequence effects on ultrasonic cleavage of DNA.
Figure 2.
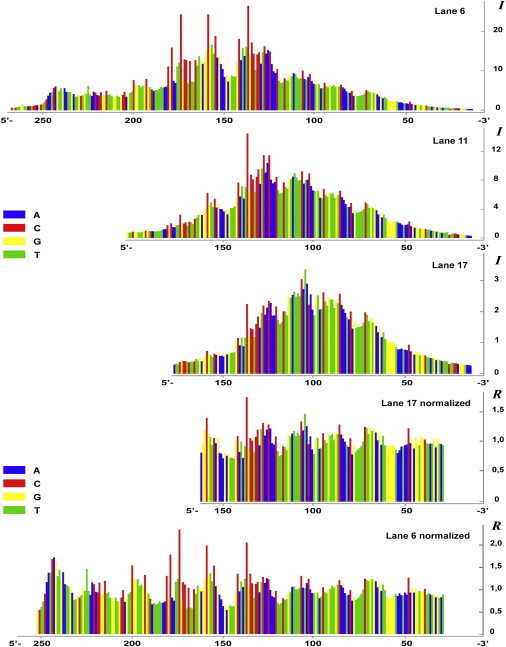
Pattern of lanes obtained by computer digitization of the gel band densities. Histograms correspond to lanes in Fig. 1. The upper plot represents the profile of intensity of cleavage (I) for lane 6 and is followed by the same type of profiles built for lanes 11 and 17. The last two plots represent profiles of the relative intensity of cleavage (R) for lanes 17 and 6, obtained by the moving-average method, to demonstrate the normalization procedure described in Materials and Methods.
We analyzed the cleavage patterns for 48 different radiolabeled DNA restriction fragments with lengths ranging from 100 to several thousand basepairs from λ-phage DNA and plasmids pBR322, pUC18, and pGEM7(f+) (Promega), and their modified analogs, which contained different insertions into the polylinkers. For statistical analysis, we used the central parts of the gels where the bands were clearly separated. Because experiments with the same sequences showed some data scattering, these experiments were repeated two or three times. It should be noted that 1–2% of the greatest intensities, as well as 1–2% of the lowest intensities, were out of scope in the statistical treatment. The first group of excluded values (i.e., the greatest intensities) came from gel defects or foreign fragments (an example of such a defect is clearly seen in the lower-left corner of Fig. 1), whereas the second group (the lowest intensities) results from incorrect approximation of the overall band intensity value due to its curvature or overlap with neighboring band (such overlaps can also be seen in the upper part of the lanes shown in Fig. 1).
Statistical analysis
To analyze the dependence between the nucleotide sequence and the relative intensity of ultrasonic cleavage (R) of the central phosphodiester bond in all possible di- and tetranucleotides, we used analysis of variance, nonparametric methods (i.e., the Kruskal-Wallis test and Brown-Mood test (32)), and multiple-comparison methods (i.e., Student's t-test, Tukey-Kramer test, and Dunn test (32)). We noted that the nonparametric analysis yielded the same results as the parametric analysis.
The results from statistical treatment of the 20,588 relative cleavage intensities for each of 16 dinucleotides are listed in Table 1 and Fig. 3, and Table S1 and Fig. 4 show the intensities for 256 tetranucleotides. The mean values of the relative cleavage intensities, or cleavage rates, of the dinucleotides were not significantly different from the corresponding values from a previous study (26) in which the total length of the analyzed sequences was ∼2500 nucleotides.
Table 1.
Sample characteristics of ultrasonic cleavage rates for dinucleotides
| N | S | 95% confidence limits |
||||
|---|---|---|---|---|---|---|
| Lower limit | Upper limit | |||||
| AA | 1636 | 0.919 | 0.129 | 0.003 | 0.913 | 0.926 |
| AC | 1076 | 0.913 | 0.128 | 0.004 | 0.905 | 0.920 |
| AG | 1028 | 0.900 | 0.124 | 0.004 | 0.892 | 0.907 |
| AT | 1374 | 0.904 | 0.119 | 0.003 | 0.898 | 0.910 |
| CA | 1265 | 1.160 | 0.209 | 0.006 | 1.149 | 1.172 |
| CC | 1141 | 1.007 | 0.144 | 0.004 | 0.999 | 1.015 |
| CG | 1230 | 1.444 | 0.334 | 0.010 | 1.426 | 1.463 |
| CT | 1077 | 1.130 | 0.198 | 0.006 | 1.118 | 1.142 |
| GA | 1153 | 0.970 | 0.133 | 0.004 | 0.962 | 0.978 |
| GC | 1317 | 0.954 | 0.146 | 0.004 | 0.947 | 0.962 |
| GG | 1168 | 0.922 | 0.145 | 0.004 | 0.914 | 0.931 |
| GT | 1101 | 0.952 | 0.126 | 0.004 | 0.944 | 0.959 |
| TA | 1065 | 0.973 | 0.120 | 0.004 | 0.966 | 0.980 |
| TC | 1173 | 0.912 | 0.131 | 0.004 | 0.904 | 0.919 |
| TG | 1305 | 0.979 | 0.126 | 0.003 | 0.972 | 0.986 |
| TT | 1672 | 0.932 | 0.127 | 0.003 | 0.938 | 0.938 |
N, sample size;, mean value; S, standard deviation;, standard error of the mean.
Figure 3.
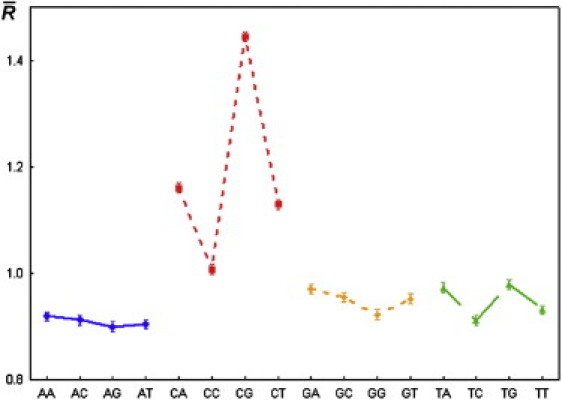
Mean values of the relative intensity of cleavage (cleavage rates) for all dinucleotides, and 95% confidence limits for the population mean. Symbols: ■, ▴, ⋄, ○–mean value; I 95% confidence limits for the population mean.
Figure 4.
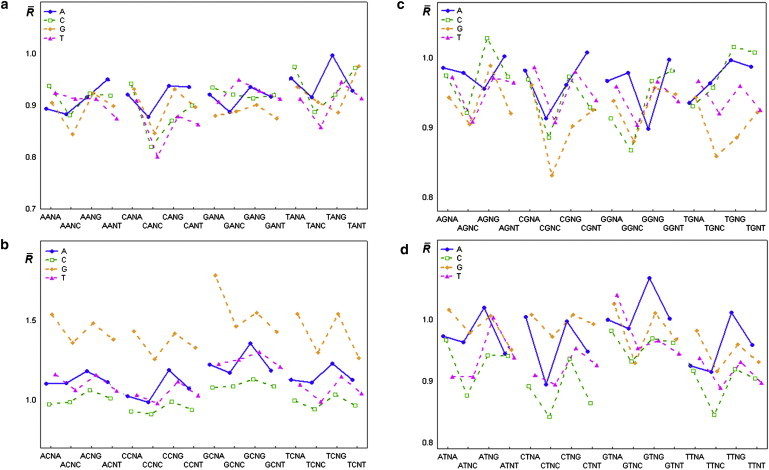
(a–d) Mean values of the relative intensity of cleavage (cleavage rates) for all tetranucleotides. Symbol:■, ▴, ⋄, ○ mean value.
The effect of the dinucleotide type on the cleavage rate was statistically significant (p << 0.05). Moreover, there was a significant difference between the cleavage rates at complementary dinucleotides. Therefore, cleavage of particular phosphodiester bond does not always result in cleavage of the opposite phosphodiester bond in the complementary strand.
Of importance, the cleavage rates at dinucleotides d(CpC), d(CpT), d(CpA), and d(CpG) are significantly different from each other and also different from the cleavage rates obtained for all other dinucleotides. The cleavage rate of dinucleotide d(CpG) was the highest of all 16 dinucleotides.
Our analysis of the dependence of nucleotide type on the ultrasonic cleavage rate at the 3′-position in all four groups of dinucleotides leads us to conclude that this dependence was significant in each group (p << 0.05).
The results of the statistical analysis of the relative cleavage intensities of the central phosphodiester bond in tetranucleotides (Fig. 4 and Table S1) reveal the context dependence of cleavage rates in dinucleotides.
We analyzed the effect of the flanking nucleotides dN1 and dN4 for all tetranucleotides d(N1pN2pN3pN4) on their ultrasonic cleavage rates, for each of 16 variants of the central dinucleotides d(N2pN3), and found that this effect was statistically significant in all 16 groups of tetranucleotides. The cleavage rates corresponding to tetranucleotides d(GpCpApG), d(GpCpGpA), d(GpTpApG), and d(GpTpTpA) were maximal for four groups of tetranucleotides (d(N1pCpApN4), d(N1pCpGpN4), d(N1pTpApN4), and d(N1pTpTpN4), respectively).
What physical processes in aqueous solution under sonication lead to DNA cleavage?
The ultrasonic cleavage of DNA reported here is most likely the result of hydrodynamic shearing stresses caused by the collapse of cavitation bubbles (6,33). Their collapse results in a drastic increase of local temperature and pressure (30,34,35). The critical size of the bubbles weakly depends on the sound frequency in a wide frequency range. Shearing forces that act on the DNA fragments are thought to originate from high-velocity gradients of water near the collapsing bubble. It is known that in the case of asymmetric collapse, the velocity of the microjets can values of >100 m/s (33), whereas the theoretical value of the bubble's interface velocity in the case of symmetrical collapse might exceed 200 m/s (6). High-velocity gradients in the streaming solution may cause mechanical deformation of the molecule by friction forces. Thus, the observed cleavage of DNA fragments most likely represents a complex mechanochemical process, which includes mechanical deformation of the molecule before the actual chemical reaction takes place (6). Because cavitational flows are accompanied by turbulence, any mathematical treatment of the problem is restricted to highly simplified models.
To estimate the values of the shearing forces that act on DNA molecules in cavitating solution, we used the model proposed by Thomas (36). This model is generally accepted for describing the degradation of polymers in cavitating solution. Our computation of cavitation bubble dynamics showed that in the final stage of the bubble's collapse, the radial velocity gradient calculated for water flow near the bubble's interface exceeded 107 s−1. Calculations showed that such flow gradients are capable of producing stretching forces acting on a 200 basepair DNA fragment of >3 nN (unpublished results). Single-molecule studies of various polymers have shown that the rupture force of a single covalent bond is in the nanonewton range and depends logarithmically on the stretching rate (37). We should note that single-molecule studies on double-stranded DNA mechanics have clearly demonstrated the existence of several stages upon DNA stretching, such as B→S-form transition and melting (38). Nevertheless, the timescale of these experiments is approximately seconds, whereas the impulsive stretching force in cavitation flow acts on timescales of several nanoseconds. Hence, we assume that drastic conformational changes in DNA, such as the B→S transition, do not occur in this case.
What physical properties of B-DNA affect the ultrasonic cleavage rate?
Two independent features roughly characterize the patterns of DNA cleavage. The first one is the positional effect: the intensity of cleavage steadily enhances from the ends of the restriction fragment to its center (Figs. 1 and 2). This property of the cleavage pattern likely reflects the mechanical nature of a molecule's deformation process, which results in its breakage.
The second and most intriguing feature of the obtained ultrasonic cleavage patterns is their sequence specificity. Many of the physical properties of double-helical DNA depend on the nucleotide sequence. For example, DNA duplex stability is effectively described by a thermodynamic approach (e.g., the nearest-neighbor model (39)). However, ultrasonic cleavage rates are not in line with the values of the effective free energies of this model. The cleavage rates in d(CpG) and d(GpC) are significantly different, whereas the effective free energies of these steps are roughly the same. On the other hand, the formation of unusual structures, such as kinks and bubbles, occurs mostly at AT-rich sites, but according to our data, the DNA cleavage rate at these sites is not significantly different from the average level.
We now analyze the relationship between the obtained sequence-dependent ultrasonic cleavage rates and the reported effects of the sequence on B-DNA conformational dynamics. A number of conformational motions are coupled with each other in double-stranded DNA. The most relevant of these, in the sugar phosphate backbone, is the S↔N interconversion of the deoxyribose ring (40–43) and BI↔BII motion (8,44–46). Sugar ring interconversion is transmitted to trans↔gauche+ variations of δ torsion (see Fig. 5), influencing the orientation of the C3′-O3′ bond (8), which is involved in the cleavage process and also is coupled with mutual rotation of the sugar around the glycosidic bond (variation of χ) (47), as well as with BI↔BII motion (8,48).
Figure 5.
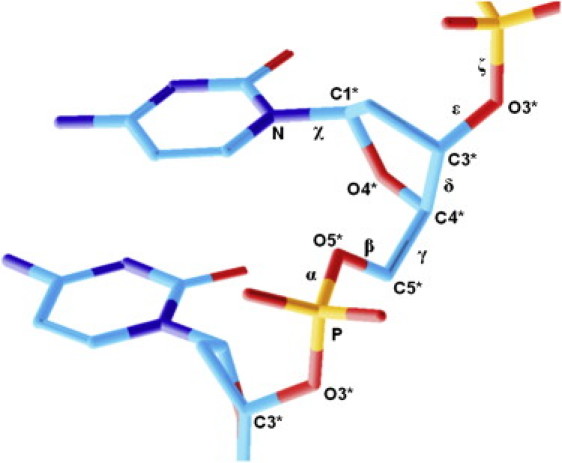
Schematic representation of a dideoxynucleotide fragment with notation corresponding to the standard description.
The remarkable enhancement of the ultrasonic cleavage rate in the phosphodiester bond after deoxycytidine addition is evident from the statistical analysis (Table 1, Figs. 3 and 4, and Table S1). It is clear that some local property of the sugar phosphate junction in dinucleotides with deoxycytidine on the 5′-end d(CpN) is unique from that of any other dinucleotide. This assumption is supported by theoretical and experimental data. Ab initio quantum mechanical calculations in a previous study (49) revealed the unique properties of deoxycytidine: the lowest potential energy region for glycosidic angle χ in deoxycytidine is in the anti-region (relevant to the A-form DNA) for both the Northern and Southern energy minima of deoxyribose. All other nucleosides in the Southern energy minima prefer the high-anti region for χ. Moreover, conformations of the Northern region for deoxyribose in deoxycytidine are characterized by a slightly lower potential energy than in the Southern region (50). The higher conformational entropy of the A-form DNA compared with the B-form for the GG/CC step, which distinguishes it from the AA/TT step (51), is the consequence of conformational energetics, thus confirming the unique conformational behavior of deoxycytidine. Hence, the conformational preferences of deoxycytidine are out of keeping with the regular conformational characteristics of B-DNA (angle χ in the high-anti region, pseudorotation in the S-region). The lack of consensus between polymeric regularity and local stability may induce enhanced conformational S↔N motion in deoxycytidine. In fact, this motion was registered in an NMR 13C spin relaxation study accompanied by molecular-dynamics (MD) simulation (52).
Another relevant conformational motion of the sugar phosphate backbone in B-DNA is determined by the relation of ɛ/ζ torsions and comprises transitions between the canonical state BI (trans/gauche−) and the minor state BII (gauche−/trans). The preference in BI/BII conformation equilibrium is also sequence-dependent (12). A conformational exchange of the phosphate and deoxyribose groups was previously revealed by an NMR study (48) in which dynamic conformational coupling between equilibriums BI↔BII and S↔N in the B-DNA backbone was established. The reported statistics on BI/BII equilibrium ratios in the context of different sequences (12) do not show any correlation between the percentage of the minor BII state and the value of the cleavage rate. The high percentage of the minor BII state in dinucleotides d(CpG) and d(CpA), which exhibited a high cleavage rate in our experiments, is also found in d(TpG), d(GpG), d(GpC), and d(GpA), with an appreciably lower cleavage rate. Moreover, although the cleavage rate in d(CpT) is high, no cases of BII substate in d(CpT) have been reported, and d(ApG), which shows a minor cleavage rate, is characterized by a high percentage of BII substate. Thus, BI↔BII equilibrium in itself does not account for the enhancement of cleavage intensity in d(CpN) dinucleotides.
The only peculiarity in the conformational dynamics of the sugar phosphate backbone that is in line with the ultrasonic cleavage rates is the enhancement of the S↔N interconversion of the deoxyribose moiety in deoxycytidine. Hence, the conformational flexibility of deoxyribose is likely to be the dominant factor affecting ultrasonic cleavage rate of DNA.
This enhancement of cleavage may be the result of a C3′-O3′ bond reorientation during the S↔N interconversion of deoxyribose, because in the N-state this bond tends to align with the local helical axis of the DNA fragment (see Fig. 6). When an impulsive stretching force acts on the molecule, the decrease in the angle between the helical axis and the particular C3′-O3′ bond leads to an increase in the stretching component of its vibrational energy, which may decrease the activation energy of the hydrolysis reaction. The cleavage rate obtained for the d(CpG) dinucleotide exceeds the relative average level of cleavage by a factor of 1.5. According to the Arrhenius equation, this ratio may be explained by an additional lowering of the activation barrier of the hydrolysis reaction by just 0.4 kT.
Figure 6.
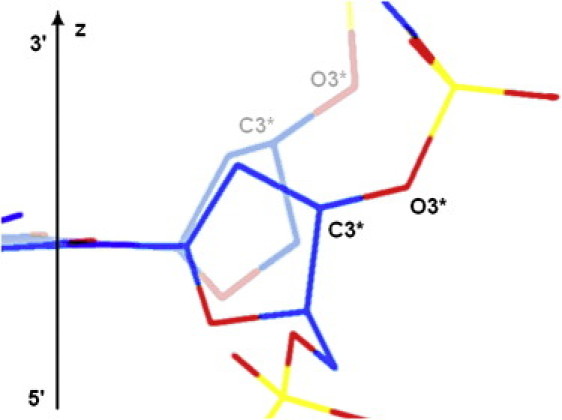
Schematic representation of a possible change in the C3′-O3′ bond alignment during S↔N interconversion of deoxyribose in B-DNA. The fragment of the sugar-phosphate backbone with the N-state of deoxyribose is shown faded, and that with the S-state is bright. The angle between the DNA helical axis (shown as vertical z axis) and the direction of the C3′-O3′ bond is lower in the N-state than in the S-state.
The ultrasonic cleavage rate in d(CpC) dinucleotide is sufficiently lower than that in other d(CpN) dinucleotides. This result may be due to silencing of the S↔N interconversion of deoxyribose in sequential deoxycytidines, in accord with previous NMR data (48). This negative interference effect may also be the result of the reported positive correlation between the BII conformation and N-type puckering of deoxyribose on the 5′-end of dinucleotide, and the negative correlation of BII percentages in sequential phosphates. The assumption of deoxyribose S↔N motion suppression in neighboring deoxicytidines may be also supported by the results of a statistical analysis of the relative intensities of the central phosphodiester bond in tetranucleotides d(N1pCpN3pN4) (Table S2). The results of multiple-comparison tests (Table S3) show that the cleavage rates for tetranucleotides of type d(CpCpN3pN4) are minimal compared with the cleavage rates of d(N1pCpN3pN4) tetranucleotides. Moreover, among 64 tetranucleotides of type d(N1pCpN3pN4), the lowest cleavage rate is found in d(CpCpCpC) (see Fig. 4 and Table S1). Thus, if the intensity of S↔N motion is the dominant factor affecting the ultrasonic cleavage rate, the negative interference effect of BI↔BII motion on S↔N motion in sequential deoxycytidines is evident.
The ultrasonic cleavage rate reflects the sequence-specific local flexibility of B-DNA
The ultrasonic cleavage rate is modulated by sugar ring interconversion and also correlates with the local flexibility of B-DNA. On the dinucleotide level of description, ultrasonic cleavage rates are consistent with the range of experimentally obtained step deformabilities: PyPu > PuPu > PuPy (53). By summarizing cleavage rates for dinucleotides that form three groups of steps (see Table 1), and taking into account the different numbers of dinucleotides included in the steps, we obtain a row of indices (2.32, 1.92, 1.86) that is consistent with the above-mentioned deformability range.
The local properties of DNA, such as sequence-specific conformational dynamics and deformability, are important factors in the biological functioning of DNA. For example, an increased nucleosome positioning preference was found for the periodically repeated tetranucleotide d(CpTpApC) (54). Our data show that the difference between cleavage rates in complementary tetranucleotides d(CpTpApC) and d(GpApTpG) (1.068 and 0.895, respectively; see Fig. 4 and Table S1) is maximal (0.173) among all 16 tetranucleotides with the central d(TpA) step. Therefore, we conclude that the difference in flexibility between complementary chains is an important factor in the ability to form nucleosomes.
The obtained cleavage rates for tetranucleotides show trends that are consistent with previous results from extended MD simulations (55) and complex investigations using NMR and MD (56,57). For example, it was shown that the conformational mobility of CpG is higher in d(TpCpGpA) than in d(ApCpGpT) (51). The ultrasound cleavage rates in these tetranucleotides are 1.543 for d(TpCpGpA), and 1.381 for d(ApCpGpT) (see Fig. 4 and Table S1). Tetranucleotide d(ApCpGpT) is a part of the conserved gene promoter cAMP response element (CRE), which has the sequence d(TpGpApCpGpTpCpA) recognized by a nuclear factor (CREB) that regulates the expression of many genes. It is well known that the sequence-specific modulations of DNA flexibility may go beyond the tetranucleotide level. For instance, the flexibility of the central CpG step in d(GpApCpGpTpC), according to NMR and MD data (57), is higher than that of the corresponding site in d(ApApCpGpTpT). In our statistic sample, these hexanucleotides were met 11 and 9 times, respectively, and the corresponding cleavage rates were 1.61 and 1.32. This result is also consistent with the above-mentioned findings regarding CRE flexibility.
The presence of islands with a high content of d(CpG) (possessing the highest value of ultrasonic cleavage rate) upstream and downstream of structural genes may provide a mechanism of gene shuffling during evolution. Epigenetic mechanisms based on d(CpG) methylation (58) may be a consequence of the unique properties of this step. The enzyme may recognize the unusual structure of the d(CpG) dinucleotide and flip cytosines out of the DNA helix during methylation more efficiently than the other bases.
Conclusions
The effect of ultrasound on a DNA solution leads to sequence-specific DNA cleavage, as revealed by PAAG electrophoresis. The sequence specificity of ultrasonic cleavage is the result of sequence-dependent conformational dynamics, and is likely modulated by the intensity of the sugar ring S↔N interconversion.
Sequence-specific ultrasonic cleavage rates were obtained for all possible 16 dinucleotide steps, as well as for all 256 tetranucleotide steps.
We conclude that cleavage rates, as a measure of the local conformational dynamics of DNA, may be useful for characterizing functional regions of the genome. Each complementary chain can be characterized independently by the cleavage rate, and thus the diversity of conformational dynamics in both complementary chains can be estimated. Such a numerical evaluation may be useful for identifying promoter regions in the genome and assessing preferences for nucleosome positioning.
Acknowledgments
We thank V. I. Salyanov, E. A. Vorobiev, and S. M. Ergebekov for their help in carrying out the experiments and for useful discussions about the results.
This study was supported by the Program of the Presidium of the Russian Academy of Sciences on Molecular and Cell Biology, and the Russian Foundation for Basic Research (projects 08-04-01739 and 07-04-01031).
Footnotes
This is an Open Access article distributed under the terms of the Creative Commons-Attribution Noncommercial License (http://creativecommons.org/licenses/by-nc/2.0/), which permits unrestricted noncommercial use, distribution, and reproduction in any medium, provided the original work is properly cited.
Supporting Material
References
- 1.Laland S.G., Overend W.G., Stacey M. Deoxypentose nucleic acids. Part III. Some effects of ultrasonic waves on deoxypentose nucleic acids. J. Chem. Soc. 1952:303–310. [Google Scholar]
- 2.Doty P., McGill B.B., Rice S.A. The properties of sonic fragments of deoxyribosenucleic acid. Proc. Natl. Acad. Sci. USA. 1958;44:432–438. doi: 10.1073/pnas.44.5.432. [DOI] [PMC free article] [PubMed] [Google Scholar]
- 3.Freifelder D., Davison P.F. Studies on the sonic degradation of deoxyribonucleic acid. Biophys. J. 1962;2:235–247. doi: 10.1016/s0006-3495(62)86852-0. [DOI] [PMC free article] [PubMed] [Google Scholar]
- 4.Pritchard N.J., Hughes D.E., Peacocke A.R. The ultrasonic degradation of biological macromolecules under conditions of stable cavitation. I. Theory, methods, and application to deoxyribonucleic acid. Biopolymers. 1965;4:259–273. doi: 10.1002/bip.1968.360060414. [DOI] [PubMed] [Google Scholar]
- 5.Elsner H.I., Lindblad E.B. Ultrasonic degradation of DNA. DNA. 1989;8:697–701. doi: 10.1089/dna.1989.8.697. [DOI] [PubMed] [Google Scholar]
- 6.Basedow, A. M., and E. B. Ebert. 1977. Ultrasonic degradation of polymers in solution. Advances in Polymers Science. A. Abe, A.-C. Albertsson, …, J. Genzer, editors. Springer, Berlin/Heidelberg. 22:83–148.
- 7.Grokhovsky S.L. Specificity of DNA cleavage by ultrasound. Mol. Biol. (Mosk) 2006;40:317–325. [Google Scholar]
- 8.Fratini A.V., Kopka M.L., Dickerson R.E. Reversible bending and helix geometry in a B-DNA dodecamer: CGCGAATTBrCGCG. J. Biol. Chem. 1982;257:14686–14707. [PubMed] [Google Scholar]
- 9.Kielkopf C.L., Ding S., Rees D.C. Conformational flexibility of B-DNA at 0.74 A resolution: d(CCAGTACTGG)(2) J. Mol. Biol. 2000;296:787–801. doi: 10.1006/jmbi.1999.3478. [DOI] [PubMed] [Google Scholar]
- 10.Sims G.E., Kim S.-H. Global mapping of nucleic acid conformational space: dinucleoside monophosphate conformations and transition pathways among conformational classes. Nucleic Acids Res. 2003;31:5607–5616. doi: 10.1093/nar/gkg750. [DOI] [PMC free article] [PubMed] [Google Scholar]
- 11.Svozil D., Kalina J., Schneider B. DNA conformations and their sequence preferences. Nucleic Acids Res. 2008;36:3690–3706. doi: 10.1093/nar/gkn260. [DOI] [PMC free article] [PubMed] [Google Scholar]
- 12.Heddi B., Oguey C., Hartmann B. Intrinsic flexibility of B-DNA: the experimental TRX scale. Nucleic Acids Res. 2010;38:1034–1047. doi: 10.1093/nar/gkp962. [DOI] [PMC free article] [PubMed] [Google Scholar]
- 13.Wecker K., Bonnet M.C., Delepierre M. The role of the phosphorus BI-BII transition in protein–DNA recognition: the NF-κB complex. Nucleic Acids Res. 2006;30:4452–4459. doi: 10.1093/nar/gkf559. [DOI] [PMC free article] [PubMed] [Google Scholar]
- 14.Huang D.B., Phelps C.B., Ghosh G. Crystal structure of a free κB DNA: insights into DNA recognition by transcription factor NF-κB. J. Mol. Biol. 2005;346:147–160. doi: 10.1016/j.jmb.2004.11.042. [DOI] [PubMed] [Google Scholar]
- 15.Ha S.C., Choi J., Kim K.K. The structures of non-CG-repeat Z-DNAs co-crystallized with the Z-DNA-binding domain, hZ α(ADAR1) Nucleic Acids Res. 2009;37:629–637. doi: 10.1093/nar/gkn976. [DOI] [PMC free article] [PubMed] [Google Scholar]
- 16.Becker N.B., Wolff L., Everaers R. Indirect readout: detection of optimized subsequences and calculation of relative binding affinities using different DNA elastic potentials. Nucleic Acids Res. 2006;34:5638–5649. doi: 10.1093/nar/gkl683. [DOI] [PMC free article] [PubMed] [Google Scholar]
- 17.Bailly Ch., Waring M.J., Travers A.A. Effects of base substitutions on the binding of a DNA-bending protein. J. Mol. Biol. 1995;253:1–7. doi: 10.1006/jmbi.1995.0530. [DOI] [PubMed] [Google Scholar]
- 18.Rohs R., West S.M., Honig B. Nuance in the double-helix and its role in protein-DNA recognition. Curr. Opin. Struct. Biol. 2009;19:171–177. doi: 10.1016/j.sbi.2009.03.002. [DOI] [PMC free article] [PubMed] [Google Scholar]
- 19.Olson W.K., Gorin A.A., Zhurkin V.B. DNA sequence-dependent deformability deduced from protein-DNA crystal complexes. Proc. Natl. Acad. Sci. USA. 1998;95:11163–11168. doi: 10.1073/pnas.95.19.11163. [DOI] [PMC free article] [PubMed] [Google Scholar]
- 20.Abi-Ghanem J., Heddi B., Hartmann B. DNA structure from phosphate chemical shifts. Nucleic Acids Res. 2010;38:1119–1128. doi: 10.1093/nar/gkp1061. [DOI] [PMC free article] [PubMed] [Google Scholar]
- 21.Hogan M.E., Roberson M.W., Austin R.H. DNA flexibility variation may dominate DNase I cleavage. Proc. Natl. Acad. Sci. USA. 1989;86:9273–9277. doi: 10.1073/pnas.86.23.9273. [DOI] [PMC free article] [PubMed] [Google Scholar]
- 22.Brukner I., Jurukovski V., Savic A. Sequence-dependent structural variations of DNA revealed by DNase I. Nucleic Acids Res. 1990;18:891–894. doi: 10.1093/nar/18.4.891. [DOI] [PMC free article] [PubMed] [Google Scholar]
- 23.Price M.A., Tullius T.D. Using hydroxyl radical to probe DNA structure. Methods Enzymol. 1992;212:194–219. doi: 10.1016/0076-6879(92)12013-g. [DOI] [PubMed] [Google Scholar]
- 24.Balasubramanian B., Pogozelski W.K., Tullius T.D. DNA strand breaking by the hydroxyl radical is governed by the accessible surface areas of the hydrogen atoms of the DNA backbone. Proc. Natl. Acad. Sci. USA. 1998;95:9738–9743. doi: 10.1073/pnas.95.17.9738. [DOI] [PMC free article] [PubMed] [Google Scholar]
- 25.Parker S.C.J., Hansen L., Margulies E.H. Local DNA topography correlates with functional noncoding regions of the human genome. Science. 2009;324:389–392. doi: 10.1126/science.1169050. [DOI] [PMC free article] [PubMed] [Google Scholar]
- 26.Grokhovsky S.L., Il'icheva I.A., Nechipurenko Yu. D. Ultrasonic cleavage of DNA: quantitative analysis of sequence specificity. Biophyzica. 2008;53:250–251. [Google Scholar]
- 27.Il'icheva I.A., Nechipurenko D.Yu., Grokhovsky S.L. Ultrasonic cleavage of nicked DNA. J. Biomol. Struct. Dyn. 2009;27:391–398. doi: 10.1080/07391102.2009.10507325. [DOI] [PubMed] [Google Scholar]
- 28.Dickerson R.E., Bansal M., Zhurkin V.B. Definitions and nomenclature of nucleic acid structure parameters. J. Mol. Biol. 1989;205:787–791. doi: 10.1016/0022-2836(89)90324-0. [DOI] [PubMed] [Google Scholar]
- 29.Maniatis T., Fritsch E.F., Sambrook J. Cold Spring Harbor Laboratory Press; Cold Spring Harbor, NY: 1982. Molecular Cloning: A Laboratory Manual. [Google Scholar]
- 30.Margulis M.A. Himiya; Moscow: 1984. Osnovi Zvukohimii. [Google Scholar]
- 31.Das R., Laederach A., Altman R.B. SAFA: semi-automated footprinting analysis software for high-throughput quantification of nucleic acid footprinting experiments. RNA. 2005;11:344–354. doi: 10.1261/rna.7214405. [DOI] [PMC free article] [PubMed] [Google Scholar]
- 32.Zar J.H. Prentice Hall; Upper Saddle River, NJ: 1999. Biostatistical Analysis. [Google Scholar]
- 33.Suslick K.S., Price G.J. Applications of ultrasound to materials chemistry. Ann. Rev. Mater. Sci. 1999;29:295–326. [Google Scholar]
- 34.Didenko Y.T., McNamara W.B., Suslick K.S. Temperature of multibubble sonoluminescence in water. J. Phys. Chem. A. 1999;103:10783–10788. [Google Scholar]
- 35.McNamara W.B., Didenko Y.T., Suslick K.S. Sonoluminescence temperatures during multibubble cavitation. Nature. 1999;401:772–775. doi: 10.1103/PhysRevLett.84.777. [DOI] [PubMed] [Google Scholar]
- 36.Thomas J.R. Sonic degradation of high polymers in solution. J. Phys. Chem. 1959;63:1725. [Google Scholar]
- 37.Schmidt S.W., Beyer M.K., Clausen-Schaumann H. Dynamic strength of the silicon-carbon bond observed over three decades of force-loading rates. J. Am. Chem. Soc. 2008;130:3664–3668. doi: 10.1021/ja710642a. [DOI] [PubMed] [Google Scholar]
- 38.Bustamante C., Smith S.B., Smith D. Single-molecule studies of DNA mechanics. Curr. Opin. Struct. Biol. 2000;10:279–285. doi: 10.1016/s0959-440x(00)00085-3. [DOI] [PubMed] [Google Scholar]
- 39.SantaLucia J., Jr. A unified view of polymer, dumbbell, and oligonucleotide DNA nearest-neighbor thermodynamics. Proc. Natl. Acad. Sci. USA. 1998;95:1460–1465. doi: 10.1073/pnas.95.4.1460. [DOI] [PMC free article] [PubMed] [Google Scholar]
- 40.Thomas G.A., Peticolas W.L. Flexibility of nucleic acid conformations. 1. Comparison of the intensities of the Raman-active backbone vibrations in double-helical nucleic acids and model double-helical dinucleotides crystals. J. Am. Chem. Soc. 1983;105:986–992. [Google Scholar]
- 41.Thomas G.A., Peticolas W.L. Fluctuations in nucleic acid conformations. 2. Raman spectroscopic evidence of varying ring pucker in A-T polynucleotides. J. Am. Chem. Soc. 1983;105:993–996. [Google Scholar]
- 42.Wartell R.M., Harrell J.T. Characteristics and variations of B-type DNA conformations in solution: a quantitative analysis of Raman band intensities of eight DNAs. Biochemistry. 1986;25:2664–2671. doi: 10.1021/bi00357a056. [DOI] [PubMed] [Google Scholar]
- 43.Rinkel L.J., Altona C. Conformational analysis of the deoxyribofuranose ring in DNA by means of sums of proton-proton coupling constants: a graphical method. J. Biomol. Struct. Dyn. 1987;4:621–649. doi: 10.1080/07391102.1987.10507665. [DOI] [PubMed] [Google Scholar]
- 44.Gorenstein D.G. Stereoelectronic effects in biomolecules. Chem. Rev. 1987;87:1047–1077. [Google Scholar]
- 45.Djuranovic D., Hartmann B. DNA fine structure and dynamics in crystals and in solution: the impact of BI/BII backbone conformations. Biopolymers. 2004;73:356–368. doi: 10.1002/bip.10528. [DOI] [PubMed] [Google Scholar]
- 46.Heddi B., Foloppe N., Hartmann B. Quantification of DNA BI/BII backbone states in solution. Implications for DNA overall structure and recognition. J. Am. Chem. Soc. 2006;128:9170–9177. doi: 10.1021/ja061686j. [DOI] [PubMed] [Google Scholar]
- 47.Donohue J., Trueblood K.N. Base pairing in DNA. J. Mol. Biol. 1960;2:363–371. doi: 10.1016/s0022-2836(60)80047-2. [DOI] [PubMed] [Google Scholar]
- 48.Isaacs R.J., Spielmann H.P. NMR evidence for mechanical coupling of phosphate B(I)-B(II) transitions with deoxyribose conformational exchange in DNA. J. Mol. Biol. 2001;311:149–160. doi: 10.1006/jmbi.2001.4855. [DOI] [PubMed] [Google Scholar]
- 49.Foloppe N., MacKerell, Jr A.D. Contribution of the phosphodiester backbone and glicosil linkage intrinsic torsional energetic to DNA structure and dynamics. J. Phys. Chem. 1999;103:10955–10964. [Google Scholar]
- 50.Foloppe N., MacKerell A.D., Jr. Intrinsic conformational properties of deoxyribonucleosides: implicated role for cytosine in the equilibrium among the A, B, and Z forms of DNA. Biophys. J. 1999;76:3206–3218. doi: 10.1016/S0006-3495(99)77472-2. [DOI] [PMC free article] [PubMed] [Google Scholar]
- 51.Il'icheva I.A., Vlasov P.K., Tumanyan V.G. The intramolecular impact to the sequence specificity of B—>A transition: low energy conformational variations in AA/TT and GG/CC steps. J. Biomol. Struct. Dyn. 2010;27:667–693. [PubMed] [Google Scholar]
- 52.Duchardt E., Nilsson L., Schleucher J. Cytosine ribose flexibility in DNA: a combined NMR 13C spin relaxation and molecular dynamics simulation study. Nucleic Acids Res. 2008;36:4211–4219. doi: 10.1093/nar/gkn375. [DOI] [PMC free article] [PubMed] [Google Scholar]
- 53.Okonogi T.M., Alley S.C., Robinson B.H. Sequence-dependent dynamics of duplex DNA: the applicability of a dinucleotide model. Biophys. J. 2002;83:3446–3459. doi: 10.1016/S0006-3495(02)75344-7. [DOI] [PMC free article] [PubMed] [Google Scholar]
- 54.Takasuka T.E., Stein A. Direct measurements of nucleosome-forming preferences of periodic DNA motifs challenge established models. Nucleic Acids Res. 2010;38:5672–5680. doi: 10.1093/nar/gkq279. [DOI] [PMC free article] [PubMed] [Google Scholar]
- 55.Fujii S., Kono H., Sarai A. Sequence-dependent DNA deformability studied using molecular dynamics simulations. Nucleic Acids Res. 2007;35:6063–6074. doi: 10.1093/nar/gkm627. [DOI] [PMC free article] [PubMed] [Google Scholar]
- 56.Lefebvre A., Mauffret O., Fermandjian S. Structural behavior of the CpG step in two related oligonucleotides reflects its malleability in solution. Biochemistry. 1995;34:12019–12028. doi: 10.1021/bi00037a045. [DOI] [PubMed] [Google Scholar]
- 57.Cordier C., Marcourt L., Dodin G. Conformational variation of the central CG site in d(ATGACGTCAT)2 and d(GAAAACGTTTTC)2. An NMR, molecular modelling and 3D-homology investigation. Eur. J. Biochem. 1999;261:722–733. doi: 10.1046/j.1432-1327.1999.00314.x. [DOI] [PubMed] [Google Scholar]
- 58.Doerfler W., Borm P., editors. DNA Methylation: Basic Mechanisms. Springer-Verlag; Berlin/Heidelberg, Germany: 2006. [Google Scholar]
Associated Data
This section collects any data citations, data availability statements, or supplementary materials included in this article.