

Abstract
Membrane proteins constitute >30% of the proteins in an average cell, and yet the number of currently known structures of unique membrane proteins is <300. To develop new concepts for membrane protein structure determination, we have explored the serial nanocrystallography method, in which fully hydrated protein nanocrystals are delivered to an x-ray beam within a liquid jet at room temperature. As a model system, we have collected x-ray powder diffraction data from the integral membrane protein Photosystem I, which consists of 36 subunits and 381 cofactors. Data were collected from crystals ranging in size from 100 nm to 2 μm. The results demonstrate that there are membrane protein crystals that contain <100 unit cells (200 total molecules) and that 3D crystals of membrane proteins, which contain <200 molecules, may be suitable for structural investigation. Serial nanocrystallography overcomes the problem of x-ray damage, which is currently one of the major limitations for x-ray structure determination of small crystals. By combining serial nanocrystallography with x-ray free-electron laser sources in the future, it may be possible to produce molecular-resolution electron-density maps using membrane protein crystals that contain only a few hundred or thousand unit cells.
Introduction
The structure and function of molecules are strongly related at the atomic and molecular levels. Therefore, structure determination is one important clue to the complexity seen in biological macromolecules. The structure forms the basis for elucidation of the reaction mechanisms and understanding how the structure relates to the function and the dynamics of the molecules. To date, >60,000 protein structures have been solved by x-ray crystallography, electron microscopy, and NMR. However, structural information is rare for large multiprotein complexes and membrane proteins, with <300 unique membrane protein structures determined to date. Membrane protein structure determination is of extreme importance for understanding fundamental principles in biology, because these proteins are the key players in the most important processes of all living cells, such as respiration; photosynthesis; ion, nutrient, and hormone transport; cell communication; signal transduction; vision; and nerve function. About 30% of all proteins in cells are membrane proteins, and they are of great importance for human health, with >60% of all drugs currently available targeted at membrane proteins. Despite their extremely high impact, only three medically relevant human membrane protein structures have been determined to date, that of a G-protein-coupled receptor (1–3), human aquaporin-5 (4), and human leukotriene C4 synthase (5).
Three major techniques have been established to date for structure determination of proteins: x-ray crystallography, NMR, and electron microscopy (single-particle and electron crystallography). The techniques are complementary and have contributed significantly to the understanding of the structure and function of proteins, and of membrane proteins in particular. The majority of protein structures in the Protein Data Bank have been determined by x-ray crystallography, which requires the growth of large, well-ordered protein crystals. There are several challenges for membrane protein crystallography, which involve overexpression, purification, and stabilization of the proteins. Even if these obstacles are overcome, the growth of large well-ordered single crystals is the next hurdle and bottleneck for membrane protein crystallography. Due to the large problem of radiation damage, data collection from protein crystals is currently done nearly exclusively at liquid-nitrogen temperature. Finding appropriate freezing conditions to minimize radiation damage can be a further challenge for membrane protein structure determination. However, even at cryogenic temperatures, radiation damage may limit the final resolution of the structure (6).
The size of the crystals used for x-ray crystallography is of particular importance, because the integrated intensity of an x-ray diffraction peak from a crystal is proportional to the ratio of its diffracting volume to its unit cell volume. The size of a typical single crystal used for conventional protein crystallography would be on the order of 50–500 μm. The difficulties associated with the crystallization of proteins are well known (6,7), and the larger and more complicated the protein structure becomes, the more challenging are the tasks required to isolate the protein intact and to grow large, well-diffracting crystals. In particular, membrane proteins are notoriously difficult to crystallize due to their amphiphilic nature (8).
An example of a difficult-to-crystallize membrane protein is Photosystem I (PSI), which has been used as a test protein for our studies. Photosystem I is a large membrane protein complex that catalyzes the second light-induced charge separation step of oxygenic photosynthesis. In cyanobacteria, the protein is a trimer with a molecular mass of 1,056,000 Da. The first micron-sized crystals of PSI, from the thermophilic cyanobacterium Thermosynechococcus elongatus, were reported in 1988 (9). The first structural model of PSI, based on crystal diffraction to 6 Å resolution, was determined in 1993 (10,11), followed by a 4-Å structure in 1996 (12) and an improved structure at 4 Å in 1999 (13,14). All of these medium-resolution structures were solved from large crystals that were shifted after each diffraction-pattern recording during the data collection, as it was extremely difficult to establish freezing conditions due to the weak crystal contacts and the high solvent content of 78%. In 2001, the structure of Photosystem I was unraveled at 2.5 Å resolution (15) from crystals that were incubated in sucrose before freezing. Thus, 13 years intervened between the growth of the first microcrystals and determination of the first near-atomic-resolution structure of Photosystem I based on large, well-ordered single crystals under cryogenic conditions (16).
Other examples of a successful long-term effort to solve the structures of large membrane protein complexes are the cytochrome b6f complex (17,18) or the G-protein-coupled receptors (1–3,19–22). The structure determination of the first human membrane protein involved a lengthy process where the data were collected as partial data sets from microcrystals grown in lipid cubic phases (2). Progress has been made in automated data collection on frozen microcrystals, and automated screening of protein crystals at microfocus beamlines can be used for structure determination of membrane proteins (23,24), but the crystals must be frozen and data collection is very time-consuming. X-ray-induced radiation damage is an inherent problem for x-ray-based methods of structure determination. This problem is especially problematic for data collection on small crystals. Small crystals give rise to fainter diffraction patterns due to dose-limited exposure times, thereby seriously limiting the resolution to which diffraction signals can be recorded (25). For a given crystal size, the integrated diffraction intensity is inversely proportional to the unit-cell volume, so large complexes are much more difficult to measure than smaller proteins, because they contain a smaller number of unit cells in the same crystal volume. The methods developed for freezing the crystals have reduced, but not eliminated, the problem (26,27).
Conventional powder diffraction on proteins has recently been revived, and promising methods have been developed to utilize small protein crystals for structure determination (28,29). However, powder diffraction of protein crystals is limited by peak overlap and radiation damage. Furthermore, the increased unit-cell dimensions of large complexes make high-resolution structure determination by powder diffraction challenging, if not impossible. As an example, when the PSI structure was solved at 6 Å resolution, the data set contained 19,896 unique reflections (10), whereas at 2.5 Å resolution, 240,347 unique reflections were collected (15).
It would be of great value to introduce new methods that use small single crystals, or even individual molecules, for structure determination, especially if they could also eliminate freezing, x-ray damage, and crystal mounting. Such a technique may ultimately be within reach using the serial crystallography method (30,31), where diffraction patterns are collected from a stream of individual molecules or nanocrystals. The idea of collecting x-ray diffraction patterns of individual molecules was one of the major driving forces for the development of the x-ray free-electron lasers (XFELs), which produce femtosecond coherent x-ray pulses with a peak brilliance that exceeds that of third-generation synchrotron sources by 12 orders of magnitude. Experiments at the world's first femtosecond soft x-ray laser, FLASH, at Deutsches Elektronen Synchrotron in Germany, demonstrated the diffract-before-destroy principle (32) for a target etched into a silicon-nitride film (33). It has also been shown at FLASH that diffraction of biological nanoparticles can be obtained (34), but with an x-ray wavelength of >8 nm, FLASH did not allow the determination of molecular structures. The Linac Coherent Light Source (LCLS) in Stanford is the first hard x-ray laser, which began operation in the fall of 2009 with a 0.7-nm wavelength. In December 2010, the LCLS will have a beamline available with a wavelength of 0.15 nm. However, simulations have shown that the diffraction signal of a single nonperiodic biological molecule is extremely weak and requires new analysis methods or a substantial further improvement of the x-ray flux and the detector technology (35).
This leads to the idea of serial nanocrystallography, where the gap between conventional crystallography, which uses large single crystals, and single-molecule x-ray diffraction is filled by data collection from a fully hydrated stream of nanocrystals. However, it is not known whether the size of membrane protein crystals has a lower limit below which the protein aggregates are unordered or nonexistent. Theories of crystal growth postulate that for each crystal, a critical radius, rc, exists. Crystals smaller than rc would dissolve, whereas crystals above the rc would be stable (36). Dynamic light scattering has been used to determine the aggregation behavior of proteins during crystallization (37), but these measurements cannot determine whether an aggregate is crystalline or amorphous. Consequently, it is not known whether clusters of membrane proteins in the nanometer size range would be unordered aggregates that could not be used for diffraction studies or ordered crystalline phases that could potentially be utilized for x-ray diffraction studies. To complicate the situation, to our knowledge, no data exist regarding the critical radius of membrane proteins.
As a prerequisite for determining the viability of serial nanocrystallography, the aim of this study is to determine the prevalence of membrane protein crystals less than a micrometer along a side. In addition, the study sought to determine the scattering power of these submicron crystals and to address their potential use for structure determination of membrane proteins. The experiment was carried out using Photosystem I as a model system, because its complexity and large unit-cell constants allow for a lower boundary on the number of unit cells contained within a crystal of a given size. Success with Photosystem I would indicate that the serial nanocrystallography method could be generalized for use with other membrane proteins and soluble proteins. Powder diffraction patterns are collected from a stream of fully hydrated Photosystem I crystals at room temperature. In this article, we show the existence of three-dimensional membrane-protein crystals on the scale of a few hundred nanometers and the ability of these crystals to contribute measureable x-ray diffraction after relatively short exposure times.
Materials and Methods
PSI was isolated from the thermophilic cyanobacterium Thermosynechococcus elongatus, and crystals were grown as described previously (38). The cells were grown under low-light conditions, allowing for a higher yield of trimeric PSI. The cells were harvested and lysed using a microfluidizer (M-110L, Microfluidics, Newton, MA). The protein was solubilized by addition of 0.6% (m/v) β-dodecyl maltoside (βDDM) and purified using anion-exchange chromatography. The eluent solutions for the chromatography consisted of 20 mM MES, pH 6.4, 0.02% (m/v) βDDM, and concentrations of MgSO4 varying between 100 and 150 mM. After purification, the protein solution was diluted to low MgSO4 concentrations by the addition of a buffer containing 5 mM MES, pH 6.4, and 0.02% (m/v) βDDM. Upon dilution of the MgSO4 concentration, the protein was concentrated to 10 mg/mL. Crystals were observed at MgSO4 concentrations <8 mM.
The maximum size of the crystals used for injection was restricted using in-line filters with pore sizes of 100, 220, or 500 nm, depending on the particular experiment. The solutions were prefiltered before being placed in the sample reservoir of the nozzle so as to limit the clogging of the in-line filter. The jets were run at flow rates between 10 and 30 μL/min and had an after-filtration PSI concentration of 1.95 mg/mL using the 500-nm filter size. At the flow rates used for these experiments, the injector produces a jet with a diameter of 10 μm and droplets of twice that diameter that contain, on average, 4.7 × 10⁶ PSI trimers in the form of nanocrystals.
Diffraction studies
x-ray diffraction data were collected at beam line 9.0.1 of the Advanced Light Source at Lawrence Berkeley National Laboratory, using photon energies of 520 eV and 1560 eV. The PSI samples were introduced to the interaction region using a liquid jet of diameter 10 μm produced by the gas-dynamic virtual nozzle as detailed previously (39) and as shown in Fig. S1 in the Supporting Material. Using the scheme shown in Fig. 1, diffraction patterns were obtained from the continuous area of the jet before Rayleigh breakup occurs. This reduces the background in the diffraction patterns produced by the shape transform of the jet to a streak perpendicular to the jet. The illuminated volume contained many crystals in different orientations at any time, producing the observed powder diffraction patterns. Diffraction patterns were collected using an on-axis charge-coupled-device (CCD) detector or an off-axis CCD detector, which doubled the achievable resolution from 2.8 nm to 1.4 nm. The ninth harmonic of a 10-cm-period undulator was focused into a 50-μm beam spot by an off-axis zone plate segment, providing a total incident photon flux of 1012 photons/s with a bandwidth of ∼1% for the 1560-eV x-rays.
Figure 1.

Overview of the serial powder crystallography experiment. An aqueous solution containing many PSI crystallites passes through an incident x-ray beam, creating a powder diffraction pattern.
Using the on-axis detector, powder diffraction rings at high resolution (2.8 nm) could be recorded with a total exposure of 200 s using a total sample solution of 74 μL in volume, corresponding to 143 μg of PSI for the 500 nm filtered solution. To avoid pixel saturation and improve the counting statistics at higher scattering angles with the detector moved off-axis, repeated 30-s exposures were taken and averaged during postprocessing. The maximum exposure time for a single CCD exposure is determined both by the strength of the background signal and by the strength of the scattered signal at small scattering angles. A high background signal and a large scattered signal at low spatial frequencies will cause detector saturation and signal bleeding for exposures >30 s. The statistics of the signal at large scatterings angles is improved by averaging many such CCD recordings. This continuous signal is readily subtracted from the semidiscreet powder rings.
Results and Discussions
The serial nanocrystallography experiment was used to establish the existence of membrane-protein crystals that are only a few hundred nanometers/side. In addition, the scattering power of these small crystals was measured to ascertain the viability of using protein nanocrystals for structural determination at a conventional synchrotron source. The experiments were also aimed at providing a test for the liquid injector and proving its suitability for the injection of fully hydrated protein nanocrystals into an x-ray beam. Microfocused synchrotron beamlines typically allow the use of crystals as small as 1 μm, and so the project sought to test whether membrane-protein crystals of <0.5 μm/side exist. The hypothesis was that since showers of microcrystals are often produced in crystallization screens, nanocrystals may also be produced, and in greater numbers.
As compared to nano- and microcrystals, large single PSI crystals of dimensions 0.5 mm × 0.5 mm × 2 mm, which have been used to obtain x-ray diffraction to 2.5 Å resolution (15), have a volume of 5 × 10¹⁷ nm3, equaling 4 × 10¹³ total unit cells within the crystal containing 8 × 10¹³ PSI trimers (with a beam focus of 0.3 mm × 0.3 mm and depth of 0.5 mm yielding 9 × 10¹² unit cells in the beam). These single-crystal patterns were collected using 1-Å wavelength at third-generation synchrotrons and a single-crystal pattern is shown for reference in Fig. S2.
To test whether the submicron PSI crystallites exist, inline filters were used to restrict the maximum size allowed into the interaction region. After filtering a PSI-crystal suspension with a 500-nm filter and placing the filtrate under an optical microscope, the solution appeared turbid. A completely illuminated (500-nm)3 crystal would contain 8 × 8 × 30 (× 3) unit cells (the ×3 term arises from the hexagonal crystal shape with respect to the PSI unit cell), corresponding to 5800 unit cells containing only 11,600 PSI trimers within the crystal, allowing for 5% variation in the pore size. Fig. 2 shows the diffraction pattern obtained from the (500-nm)3 PSI crystals using 1560-eV x-rays, with a maximum resolution of 2.8 nm at the corner of the detector. In these preliminary experiments, diffraction was observed to the edges of the detector, so the maximum resolution was instrument-limited. The ratio of the number of scattering unit cells in a single crystal of 0.5 mm × 0.5 mm × 2 mm to the number of unit cells in a single 500-nm crystal used for this powder diffraction experiment is 8 × 10⁸.
Figure 2.
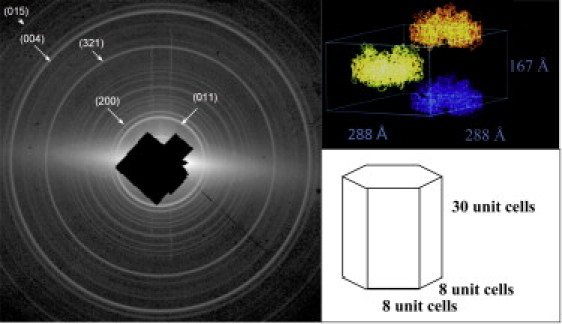
(Left) Diffraction pattern from 500 nm PSI crystals with an on-axis detector and x-ray energy of 1560 eV (λ = 0.8 nm). The resolution at the corner of the detector is 2.8 nm. A total of 11520 PSI trimers are in each crystal. The pattern is wavelength-limited. (Top right) A schematic view of the determined unit cell for PSI showing the unit-cell dimensions. (Bottom right) A drawing of a PSI crystal used for single-crystal diffraction studies showing the number of unit cells in a (500-nm)3 crystal.
Additional diffraction data were collected with the detector moved off-axis diagonally, so that the center of the diffraction pattern was in one corner of the detector. The data shown in Fig. 3 a are from (500-nm)3 crystals using 1560-eV x-rays. At this energy, the maximum attainable resolution is 1.4 nm, but the observable diffraction pattern extends only to ∼2.8 nm (after adding ten 30-s exposures), indicating that the resolution was limited by the background scattering. In addition, at higher angles, the powder lines have smaller spacing and would have been hard to measure due to peak broadening from the instrument, as well as the shape transform of the crystallites. As a result, the beamline was optimized for the third harmonic of the undulator, at 520 eV, allowing higher flux and scattering strength through a lower resolution of 4.0 nm in the corner of the detector. The diffraction pattern recorded from the (500-nm)3 crystals is shown in Fig. 3 b, and as can be seen, the data extend out to the highest measurable scattering angle. Using longer-wavelength x-rays results in a greater separation between diffraction rings and broader peaks due to particle-size effects (i.e., more samples per ring and fewer ring overlaps). Though the resolution is limited, use of this energy can provide more complete information regarding the quality of the crystals studied.
Figure 3.
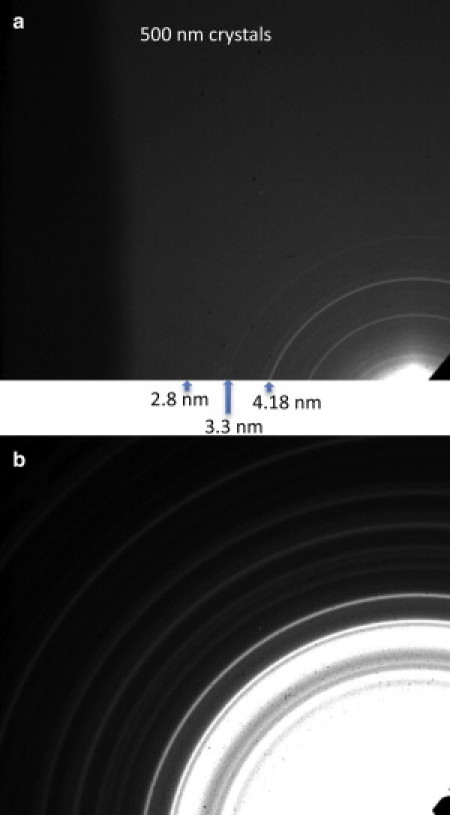
Diffraction patterns from 500-nm PSI crystals using an off-axis detector to increase the measurable scattering angle. (a) The crystals were irradiated with 1560-eV x-rays (λ = 0.8 nm) and had a resolution of 1.3 nm in the upper-left corner. (b) The crystals were irradiated with 520-eV (λ = 2.4 nm) x-rays and had a resolution of 4.0 nm in the upper left corner. Arrows and associated numbers indicate the d-spacing of the given powder peak.
The x-ray powder diffraction patterns shown in Figs. 2 and 3 are from crystals that are maximally 500 nm/side. However, the patterns could have contributions from crystallites of any size smaller than 500 nm/side. To elucidate the amount of scattering contributed from crystals of various sizes, x-ray diffraction data from crystals with a maximum linear dimension of 220 nm and 100 nm, limited by respective filter size, were collected with the off-axis detector and 520-eV x rays. It should be noted that when the filtrate of the 100-nm filter was placed under an optical microscope, the solution was light green, but had no turbidity. However, three powder rings were observed, and the data are shown in Fig. 4. Although a hexagon with a diagonal of 3a (where a = 28.8 nm) would fit through a 100-nm filter, its edges would have to be 1.5a in length, which is 1.5 unit cells. If only integer numbers of unit cells are allowed along the edges of the hexagon, the total number of unit cells contained within the (100-nm)3 crystals of Fig. 4 is 1 × 1 × 6 (×3), equaling 18 unit cells and 36 total PSI trimers. However, as a unit cell of PSI contains two PSI trimer molecules, multiples of one half of the unit cell are possible. Therefore, if noninteger values of unit cells are permitted along the crystallite edges, the number of unit cells in a PSI crystal capable of passing through a 100-nm filter is 1.5 × 1.5 × 6 (×3), which is 40.5 unit cells containing 91 PSI trimers. The ratio of the number of scattering unit cells in a 0.5 mm × 0.5 mm × 2 mm single crystal to the number of unit cells in a single (100-nm)3 crystal used for this powder diffraction experiment is minimally 2.3 × 10¹¹, and yet diffraction was still observed with a maximum resolution of 5.1 nm. One limitation of the 100-nm crystal experiment was that only a small volume of sample remained, and this had to be diluted fivefold to be passed through the void volume of the filter. The dilution would have caused the intensity of the powder rings to be diminished, making the higher-resolution rings more difficult to observe above the background and noise.
Figure 4.

Diffraction pattern from 100-nm PSI crystals with an off-axis detector and an x-ray energy of 520 eV (λ = 2.4 nm). The resolution at the corner of the detector is 4.0 nm. There are a total of 36 PSI trimers in each crystal.
Table 1 provides a summary of the maximum crystal size, number of unit cells, and number of PSI trimers used as samples in this experiment, as well as a typical sample used for single-crystal diffraction. The corresponding diffraction patterns were reduced to one dimension and are plotted simultaneously in Fig. 5.
Table 1.
Comparison of structural information for crystals used in this experiment with typical data used for single-crystal X-ray crystallography of PSI
| PSI sample type | Maximum single-crystal dimensions(μm × μm × μm) | Total number of unit cells∗ | Total number of PSI trimers | Highest attained resolution (nm) |
|---|---|---|---|---|
| Typical single crystal | 500 × 500 × 2000 | 4 × 10¹³ | 8 × 10¹⁴ | 0.24 |
| Crystal in this experiment with 500-nm filter | 0.500 × 0.500 × 0.500 | 5800 | 11600 | 2.8 |
| Crystal in this experiment with 100-nm filter | 0.100 × 0.100 × 0.100 | 18 | 36 | 5.1 |
Numbers are calculated allowing for integer numbers of unit cells along the edges of the crystal.
Figure 5.
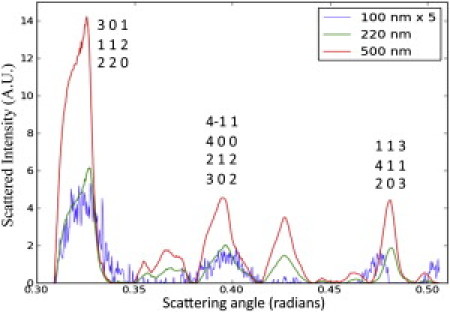
A comparison of the scattering power of the 100-nm, 220-nm, and 500-nm crystals at specific Bragg reflections using the scattered intensity as a function of scattering angle.
An examination of Fig. 5 shows that the half-maximum peak widths for the powder rings are approximately the same for the different filter sizes, with a full width at half-maximum (FWHM) of 0.020 ± 0.0025 rad. The peak widths will depend on the crystallite sizes and distribution, and they could vary significantly among crystal batch preparations. The Scherrer equation is used to determine the average particle size by relating the FWHM of a peak in a powder diffraction pattern, h, to the crystal size as follows (40):
| (1) |
where λ is the wavelength of the x-rays, Λ is the length of the side of the crystallite, assuming it is a cube, and θ/2 is the Bragg angle. The Scherrer equation considers broadening caused by crystallite size, but the measured peak width is also a function of the beam divergence and bandwidth, as well as characteristics of the sample, including the internal disorder of the molecules within the crystal, as expressed by the term mosaicity. Therefore, the FWHM of the peak is determined by the convolution of Gaussian peak profiles from the crystal size, instrument broadening, and the mosaicity of the crystal. The following formula can be used to calculate the expected FWHM of the diffraction peaks for the crystallites used in the experiment, δθtot, for comparison with the given line widths in Fig. 5:
| (2) |
where δθsize = h is the broadening of the peak due to the crystal size, δθinst is the instrumental broadening, and δθmos is the broadening caused by mosaic spread in the crystal. Using Eqs. 1 and 2, the predicted diffraction peak broadening for the various crystallite sizes used in the experiment were calculated (Table 2) using the known instrument broadening of beamline 9.0.1 of 2.5 mrad (31) and putative values of mosaicity that are typical of large PSI crystals. As can be seen in Table 2, the calculations show that the experimental line width of 0.02 ± 0.0025 is in good agreement with crystallite sizes of 100 to ∼250 nm, but could also be explained by larger crystals with higher mosaicity.
Table 2.
Calculations of the expected peak FWHM for the powder diffraction patterns of PSI nano- and microcrystals with various values of mosaicity
| Mosaicity (°) | Calculated peak width for 100-nm crystallites (rad) | Calculated peak width for 220-nm crystallites (rad) | Calculated peak width for 500-nm crystallites (rad) |
|---|---|---|---|
| 0.0 | 0.024 | 0.011 | 0.0052 |
| 0.1 | 0.024 | 0.011 | 0.0055 |
| 0.5 | 0.025 | 0.014 | 0.010 |
| 1.0 | 0.029 | 0.021 | 0.018 |
Calculations were made using Eqs. 1 and 2. Note that the experimental determined line width is 0.02 ± 0.0025 rad.
After seeing the possible effects of the mosaicity on the diffraction peak widths, a discussion of mosaicity is warranted. Practically, mosaicity is misalignment of the repeating units of a crystal that is manifest in the intensity of a Bragg reflection being subtended over a larger solid angle. Mosaicity is often presented through the mosaic block domain, in which a crystal is composed of domains that are extremely well ordered in the short range but become less ordered with respect to long-range considerations. This is an incomplete picture in the case of membrane proteins, and if PSI crystals are considered, it is seen that only four salt bridges make up the crystal contacts, which would be a primary cause of misalignment. However, misalignment of the unit cells could also occur due to excess surface area with respect to volume, because the molecules at the interface will have a reduced number of crystal contacts. In the case of a (500-nm)3 PSI crystal, 30% of the unit cells and 15% of the PSI molecules will be exposed to the interface. Therefore, two effects can be seen as influencing the mosaicity of the crystal: for large crystals, it is the propagation of slight misalignments in different domains, whereas for small crystals, the increased surface area with respect to volume causes misalignment of a larger percentage of molecules. As such, there may be a minimum in the mosaicity versus size of crystals, but currently, the mosaicity of the nanocrystals is unknown. Future experiments may make use of snapshot x-ray diffraction patterns from XFELs to help determine the relationship between mosaicity and crystallite size.
The total scattered intensity as a function of crystallite size for the three crystallite sizes measured in this experiment is shown in Fig. S3. The data cannot be normalized for concentration effects and a quantitative description is not possible, because the 500-nm data contains the 220-nm data and 100-nm data as only the largest size of crystal was constrained using filters.
Although the crystals were filtered to limit the maximum size, the protein crystals in the solution after filtration would be in equilibrium with any protein in solution. This would, in principle, allow for regrowth of larger crystals after filtration over a long time period. However, this will not occur in the timeframe of our experiment for several reasons. The buffer used to transport the PSI crystals to the interaction region contained no salt, and the PSI crystals are formed through electrostatic interactions between the proteins as the ionic strength of the solution is reduced. The solubility of PSI under these conditions is <0.1 μg/mL, and therefore the number of free PSI-detergent micelles would be very low. Therefore, at the saturation condition, dissolving and regrowth of the crystals is extremely slow. Crystal growth occurs through diffusion of the large protein-detergent complexes (molecular mass 1,300,000 Da) through the solution to the surface of the crystal, but the diffusion constant for such a large complex is small. Furthermore, the solution is not static, but flowing toward the nozzle. Therefore, the convection term should dominate the motion of the particles. The crystals were filtered 1 m before the interaction region of the x-rays and were flowing within a fiber optic of inner diameter 50 μm at 10 μL/min corresponding to a 12-s transit time. It is highly unlikely that significant dissolution and recrystallization could occur in such a small timeframe.
The serial nanocrystallography method has shown the ability to collect powder diffraction patterns from membrane protein crystals that contain only 18 unit cells. For a given crystal size, crystals of PSI should contain fewer repeating units than most proteins and consequently produce weaker diffraction. The powder diffraction that was recorded from (100-nm)3 crystals indicates the general applicability of serial nanocrystallography to most protein crystal systems. However, as stated above, the number of unique reflections expected for crystals of large membrane proteins makes the collapse of the three-dimensional reciprocal space information onto one dimension difficult to analyze, and becomes more of a challenge with increasing protein (complex) size. As a result, the serial nanocrystallography method is suggested as a method for precharacterization of protein crystal samples before use at a femtosecond XFEL source such as the LCLS, where single-crystal diffraction patterns could be collected from crystals in the jet.
The LCLS, as well as other hard x-ray free-electron lasers, offers an important opportunity for the extension of the serial diffraction method to higher resolution. The LCLS produces x-ray pulses with brilliance 12 orders of magnitude higher than that of beamline 9.0.1 at the ALS, producing a total incident flux of 1012–1013 photons/shot, where each shot may last 5–100 fs. This intense incident radiation should contain enough photons to provide detectable scattering at large angles, and due to the short duration of the pulse, single-crystal patterns could be measured without the radiation damage issues associated with conventional crystallography in the diffract-before-destroy mode (32). Initially, the wavelength of the LCLS will be 0.7 nm, but the wavelength will ultimately be reduced to 0.15 nm, potentially allowing the measurement of high-resolution diffraction patterns (41). Therefore, for large proteins, protein complexes, and membrane proteins, the LCLS will be used to collect diffraction patterns from single nanocrystals in the jet using the serial nanocrystallography method after characterization using the described powder diffraction method. The use of the injector will allow the recording of diffraction patterns without the radiation damage issues associated with conventional crystallography.
Using nanometer-sized protein crystals for structural studies at an XFEL offers the opportunity to increase the overall efficiency of the structural determination process. In addition, the use of smaller crystals may have intrinsic advantages in structural studies. Smaller crystals appear more frequently than larger crystals in crystallization screens and may exhibit lower disorder. Using an XFEL, diffraction patterns from individual crystallites could be measured, and the small size would allow for a higher escape probability of photoelectrons (42) for isolated nanocrystals. The protein-beam injector supplies the nanocrystals in a continuous column of liquid, in which a shower of photoelectrons will be generated by the ionization cascade upon exposure to strong x-ray pulses. The water column may, in fact, be an advantage, as recent detailed simulations show that this liquid column also acts as a tamper, slowing the explosion of the crystallites in femtosecond diffraction (43). The small size of the crystals will also lead to observable crystal shape-transform effects, allowing additional peaks to be seen around Bragg reflections if the area in reciprocal space containing the shape transform intersects the Ewald sphere. For powder diffraction experiments, the shape transformations of all crystals would cause a broadening of the lines; for the densely packed powder lines from a protein crystal, this would cause more peak overlap, increasing the difficulty of analysis. However, if diffraction patterns are obtained from individual crystallites with femtosecond x-ray pulses at the XFEL, the shape transform could potentially be used for classification of diffraction patterns into groups of patterns originating from crystals of different sizes (thereby allowing for proper scaling of an integrated data set), or for whole-particle phasing as a method for overcoming the phase problem (44).
The pulse rate for the fully operational LCLS will be 120 Hz (41). Previous experiments have indicated that the injector used for the serial nanocrystallography experiments could be synched to the pulse rate of the XFELs if the injector is driven by a piezo-oscillator (45). Therefore, within 1 min, 7200 diffractions patterns would be recorded. Orienting the diffraction patterns with respect to one another will be much simpler in this case than in the case of single-molecule diffraction patterns, due to the strong Bragg reflections (44). Consequently, within only a few minutes, a single-crystal data set could be collected at medium to high resolution. Multiple diffraction patterns could be collected for symmetrically identical crystal orientations, helping to improve the statistics at higher angles. However, the use of the jet will create a background that must be subtracted to observe the lower-intensity reflections.
The serial nanocrystallography method, when used at the LCLS, will provide tens of thousands of individual snapshot diffraction patterns from the same nanocrystals as used in this experiment. However, because they will be single-crystal patterns, these diffraction patterns can be individually indexed and then merged to obtain a complete set of structure factors, equivalent to those that may be determined through single-crystal work. Although it is a daunting challenge, the task could be handled by first using automated indexing software to determine the orientation of each crystallite relative to the laboratory frame, followed by the integration of all intensities that fall within small volumes centered at equivalent reciprocal lattice points. This performs a sort of Monte Carlo integration over the shape transforms from crystallites of varying size and shape. It has been shown through simulations that with accurate crystal orientations and choice of an appropriate integration volume, highly accurate structure factors can be determined through this method (44).
Conclusions
Serial nanocrystallography has shown that three-dimensional membrane-protein crystals, containing a few tens of unit cells, exist. In addition to giving proof that tiny clusters of membrane proteins can form a crystalline phase, the experiments showed that these crystals can produce measurable diffraction using a test protein (PSI) that diffracts very poorly under normal conditions due to its high solvent content and large unit-cell volume. Serial nanocrystallography, when used at a conventional x-ray source as a powder diffraction method, has been shown to be a powerful method for characterizing crystal sizes and scattering power. The method has been successfully implemented using membrane-protein crystals, and will be a useful method for precharacterizing samples for pulsed x-ray experiments. The use of the injector for sample introduction allows this method to be generalized to any type of incident beam including x-rays and electrons. As a result of these experiments, the small membrane-protein crystals will be used as a sample at the LCLS to test a single-crystal-based nanocrystallography experiment. This could allow for a new avenue to the structure determination of membrane proteins. Once the 1.5-Å x-rays are available at the LCLS, nanocrystals and microcrystals will be used to obtain high-resolution diffraction patterns.
Acknowledgments
We gratefully acknowledge Dr. Ingo Grotjohann of the Department of Chemistry and Biochemistry of Arizona State University for his thoughtful discussions regarding the manuscript.
This work was supported by a National Science Foundation award IDBR 0555845, the Center for Biophotonics Science and Technology (University of California at Davis), the Lawrence Berkeley National Laboratory Seaborg Fellowship award, the National Science Foundation award 0417142, and the National Institutes of Health award 1R01GM095583-01. P.F. (part of summer salary) was supported as part of the Center for Bio-Inspired Solar Fuel Production, an Energy Frontier Research Center funded by the US Department of Energy, Office of Science, Office of Basic Energy Sciences under award mumber DE-SC0001016. The Advanced Light Source is supported by the Director, Office of Science, Office of Basic Energy Sciences, of the US Department of Energy under contract No. DE-AC02-05CH11231. The authors have no competing financial interests.
Footnotes
Dan P. DePonte's present address is CFEL/University of Hamburg, Notkestraße 85, D-22607 Hamburg, Germany.
David Shapiro's present address is Brookhaven National Laboratory, Building 817, P.O. Box 5000, Upton, NY 11973-5000.
Dmitri Starodub's present address is PULSE Institute and SLAC National Accelerator Laboratory, 2575 Sand Hill Road. Menlo Park, CA 94025.
Supporting Material
References
- 1.Cherezov V., Rosenbaum D.M., Stevens R.C. High-resolution crystal structure of an engineered human β2-adrenergic G protein-coupled receptor. Science. 2007;318:1258–1265. doi: 10.1126/science.1150577. [DOI] [PMC free article] [PubMed] [Google Scholar]
- 2.Rasmussen S.G.F., Choi H.J., Kobilka B.K. Crystal structure of the human β2 adrenergic G-protein-coupled receptor. Nature. 2007;450:383–387. doi: 10.1038/nature06325. [DOI] [PubMed] [Google Scholar]
- 3.Rosenbaum D.M., Cherezov V., Kobilka B.K. GPCR engineering yields high-resolution structural insights into β2-adrenergic receptor function. Science. 2007;318:1266–1273. doi: 10.1126/science.1150609. [DOI] [PubMed] [Google Scholar]
- 4.Horsefield R., Nordén K., Neutze R. High-resolution x-ray structure of human aquaporin 5. Proc. Natl. Acad. Sci. USA. 2008;105:13327–13332. doi: 10.1073/pnas.0801466105. [DOI] [PMC free article] [PubMed] [Google Scholar]
- 5.Ago H., Kanaoka Y., Miyano M. Crystal structure of a human membrane protein involved in cysteinyl leukotriene biosynthesis. Nature. 2007;448:609–612. doi: 10.1038/nature05936. [DOI] [PubMed] [Google Scholar]
- 6.Mueller M., Jenni S., Ban N. Strategies for crystallization and structure determination of very large macromolecular assemblies. Curr. Opin. Struct. Biol. 2007;17:572–579. doi: 10.1016/j.sbi.2007.09.004. [DOI] [PubMed] [Google Scholar]
- 7.Drenth J. Springer Science; New York: 2007. Principles of Protein X-ray Crystallography. [Google Scholar]
- 8.DeLucas L.J. Academic Press; Burlington, MA: 2009. Membrane Protein Crystallization. [Google Scholar]
- 9.Witt I., Witt H.T., Dauter Z. X-ray characterization of single-crystals of the reaction center-I of water splitting photosynthesis. Ber. Bunsen-Ges. Phys. Chem. Chem. Phys. 1988;92:1503–1506. [Google Scholar]
- 10.Krauss N., Hinrichs W., Saenger W. 3-dimensional structure of system-I of photosynthesis at 6 Å resolution. Nature. 1993;361:326–331. [Google Scholar]
- 11.Witt H.T., Witt I., Saenger W. Crystals and structure of photosystem-1. Biophys. J. 1994;66:A2. (Abstr.) [Google Scholar]
- 12.Krauss N., Schubert W.D., Saenger W. Photosystem I at 4 Å resolution represents the first structural model of a joint photosynthetic reaction centre and core antenna system. Nat. Struct. Biol. 1996;3:965–973. doi: 10.1038/nsb1196-965. [DOI] [PubMed] [Google Scholar]
- 13.Klukas O., Schubert W.D., Saenger W. Photosystem I, an improved model of the stromal subunits PsaC, PsaD, and PsaE. J. Biol. Chem. 1999;274:7351–7360. doi: 10.1074/jbc.274.11.7351. [DOI] [PubMed] [Google Scholar]
- 14.Klukas O., Schubert W.D., Saenger W. Localization of two phylloquinones, QK and QK′, in an improved electron density map of photosystem I at 4-Å resolution. J. Biol. Chem. 1999;274:7361–7367. doi: 10.1074/jbc.274.11.7361. [DOI] [PubMed] [Google Scholar]
- 15.Jordan P., Fromme P., Krauss N. Three-dimensional structure of cyanobacterial photosystem I at 2.5 Å resolution. Nature. 2001;411:909–917. doi: 10.1038/35082000. [DOI] [PubMed] [Google Scholar]
- 16.Fromme P., Mathis P. Unraveling the photosystem I reaction center: a history, or the sum of many efforts. Photosynth. Res. 2004;80:109–124. doi: 10.1023/B:PRES.0000030657.88242.e1. [DOI] [PubMed] [Google Scholar]
- 17.Kurisu G., Zhang H.M., Cramer W.A. Structure of the cytochrome b6f complex of oxygenic photosynthesis: tuning the cavity. Science. 2003;302:1009–1014. doi: 10.1126/science.1090165. [DOI] [PubMed] [Google Scholar]
- 18.Stroebel D., Choquet Y., Picot D. An atypical haem in the cytochrome b(6)f complex. Nature. 2003;426:413–418. doi: 10.1038/nature02155. [DOI] [PubMed] [Google Scholar]
- 19.Royant A., Nollert P., Navarro J. X-ray structure of sensory rhodopsin II at 2.1-Å resolution. Proc. Natl. Acad. Sci. USA. 2001;98:10131–10136. doi: 10.1073/pnas.181203898. [DOI] [PMC free article] [PubMed] [Google Scholar]
- 20.Day P.W., Rasmussen S.G., Kobilka B.K. A monoclonal antibody for G protein-coupled receptor crystallography. Nat. Methods. 2007;4:927–929. doi: 10.1038/nmeth1112. [DOI] [PubMed] [Google Scholar]
- 21.Cherezov V., Caffrey M. Membrane protein crystallization in lipidic mesophases. A mechanism study using x-ray microdiffraction. Faraday Discuss. 2007;136:195–212. doi: 10.1039/b618173b. discussion 213–229. [DOI] [PubMed] [Google Scholar]
- 22.Reference deleted in proof.
- 23.Cusack S., Belrhali H., Riekel C. Small is beautiful: protein micro-crystallography. Nat. Struct. Biol. 1998;5(Suppl):634–637. doi: 10.1038/1325. [DOI] [PubMed] [Google Scholar]
- 24.Roth S.V., Muller-Buschbaum P., Riekel C. Microbeam grazing incidence small angle x-ray scattering—a new method to investigate heterogeneous thin films and multilayers. Spectrochim. Acta, B At. Spectrosc. 2004;59:1765–1773. [Google Scholar]
- 25.Riekel C., Burghammer M., Schertler G. Protein crystallography microdiffraction. Curr. Opin. Struct. Biol. 2005;15:556–562. doi: 10.1016/j.sbi.2005.08.013. [DOI] [PubMed] [Google Scholar]
- 26.Henderson R. The potential and limitations of neutrons, electrons and x-rays for atomic resolution microscopy of unstained biological molecules. Q. Rev. Biophys. 1995;28:171–193. doi: 10.1017/s003358350000305x. [DOI] [PubMed] [Google Scholar]
- 27.Meents A., Gutmann S., Schulze-Briese C. Origin and temperature dependence of radiation damage in biological samples at cryogenic temperatures. Proc. Natl. Acad. Sci. USA. 2010;107:1094–1099. doi: 10.1073/pnas.0905481107. [DOI] [PMC free article] [PubMed] [Google Scholar]
- 28.Von Dreele R.B. Multipattern Rietveld refinement of protein powder data: an approach to higher resolution. J. Appl. Cryst. 2007;40:133–143. [Google Scholar]
- 29.Margiolaki I., Wright J.P. Powder crystallography on macromolecules. Acta Crystallogr. A. 2008;64:169–180. doi: 10.1107/S0108767307043735. [DOI] [PubMed] [Google Scholar]
- 30.Spence J.C.H., Doak R.B. Single molecule diffraction. Phys. Rev. Lett. 2004;92:198102. doi: 10.1103/PhysRevLett.92.198102. [DOI] [PubMed] [Google Scholar]
- 31.Shapiro D.A., Chapman H.N., Weierstall U. Powder diffraction from a continuous microjet of submicrometer protein crystals. J. Synchrotron Radiat. 2008;15:593–599. doi: 10.1107/S0909049508024151. [DOI] [PubMed] [Google Scholar]
- 32.Neutze R., Wouts R., Hajdu J. Potential for biomolecular imaging with femtosecond x-ray pulses. Nature. 2000;406:752–757. doi: 10.1038/35021099. [DOI] [PubMed] [Google Scholar]
- 33.Chapman H.N., Barty A., Hajdu J. Femtosecond diffractive imaging with a soft-x-ray free-electron laser. Nat. Phys. 2006;2:839–843. [Google Scholar]
- 34.Bogan M.J., Benner W.H., Chapman H.N. Single particle x-ray diffractive imaging. Nano Lett. 2008;8:310–316. doi: 10.1021/nl072728k. [DOI] [PubMed] [Google Scholar]
- 35.Fung R., Shneerson V., Ourmazd A. Structure from fleeting illumination of faint spinning objects in flight. Nat. Phys. 2009;5:64–67. [Google Scholar]
- 36.Gunton J.D., Shiryayev A., Pagan D.L. Cambridge University Press; New York: 2007. Protein Condensation: Kinetic Pathways to Crystallization. [Google Scholar]
- 37.Malkin A.J., McPherson A. Crystallization of pumpkin seed globulin - growth and dissolution kinetics. J. Cryst. Growth. 1993;133:29–37. [Google Scholar]
- 38.Fromme P., Witt H.T. Improved isolation and crystallization of Photosystem I for structural analysis. Biochim. Biophys. Acta. 1998;1365:175–184. [Google Scholar]
- 39.DePonte D.P., Weierstall U., Doak R.B. Gas dynamic virtual nozzle for generation of microscopic droplet streams. J. Phys. D Appl. Phys. 2008;41:195505. [Google Scholar]
- 40.Scherrer P. Determination of the size and inner structure of colloid particles by X-rays. [Bestimmung der Größe und der inneren Struktur von Kolloidteilchen mittels Röntgenstrahlen.] Nach. Ges. Wiss. Göttingen. 1918;26:98–100. [Google Scholar]
- 41.Bozek J.D. AMO instrumentation for the LCLS x-ray FEL. Eur. Phys. J. Spec. Top. 2009;169:129–132. [Google Scholar]
- 42.Nave C., Hill M.A. Will reduced radiation damage occur with very small crystals? J. Synchrotron Radiat. 2005;12:299–303. doi: 10.1107/S0909049505003274. [DOI] [PubMed] [Google Scholar]
- 43.Hau-Riege S.P., Boutet S., Chapman H.N. Sacrificial tamper slows down sample explosion in FLASH diffraction experiments. Phys. Rev. Lett. 2010;104:064801. doi: 10.1103/PhysRevLett.104.064801. [DOI] [PubMed] [Google Scholar]
- 44.Kirian R.A., Wang X.Y., Holton J. Femtosecond protein nanocrystallography-data analysis methods. Opt. Express. 2010;18:5713–5723. doi: 10.1364/OE.18.005713. [DOI] [PMC free article] [PubMed] [Google Scholar]
- 45.Weierstall U., Doak R.B., Chapman H.N. Droplet streams for serial crystallography of proteins. Exp. Fluids. 2008;44:675–689. [Google Scholar]
Associated Data
This section collects any data citations, data availability statements, or supplementary materials included in this article.