

Abstract
The Na+/glucose cotransporter (SGLT1) is a membrane protein that couples the transport of two Na+ ions and one glucose molecule using the so-called alternating access mechanism. According to this principle, each cotransporter molecule can adopt either of two main conformations: one with the binding sites accessible to the extracellular solution and one with the binding sites facing the intracellular solution. The turnover rate (TOR) is the number of complete cycles that each protein performs per second. Determination of the TOR has important consequences for investigation of the cotransport mechanism, as none of the rate constants involved in mediating transport in a given direction (conformational changes and binding and unbinding reactions) can be slower than the TOR measured under the same conditions. In addition, the TOR can be used to estimate the number of cotransporter molecules involved in generating a given ensemble activity. In this study, we obtain an independent estimation of the TOR for human SGLT1 expressed in Xenopus laevis oocytes applying the ion-trap technique. This approach detects the quantity of ions released in or taken up from the restricted space existing between the oocyte plasma membrane and the tip of a large ion-selective electrode. Taking advantage of the fact that hSGLT1 in the absence of Na+ can cotransport glucose with protons, we used a pH electrode to determine a TOR of 8.00 ± 1.3 s−1 in the presence of 35 mM α-methyl-glucose at −150 mV (pH 5.5). For the same group of oocytes, a TOR of 13.3 ± 2.4 s−1 was estimated under near-Vmax conditions, i.e., in the presence of 90 mM Na+ and 5 mM α-methyl-glucose. Under these circumstances, the average cotransport current was −1.08 ± 0.61 μA (n = 14), and this activity was generated by an average of 3.6 ± 0.7 × 10¹¹ cotransporter molecules/oocyte.
Introduction
Cotransporters constitute a class of membrane proteins that couple the transmembrane transport of several solutes. For example, cotransporters can generate secondary active transport by linking the (thermodynamically) downhill movement of an ion to the uphill movement of a cotransported solute. The archetype of these proteins is the Na+/glucose cotransporter (SGLT1), which was first postulated in 1965 (1) and uses the electrochemical gradient of Na+ to drive the absorption of glucose into epithelial cells of the small intestine and the renal proximal tubule. SGLT1 cDNA was cloned in 1987 (2) which allowed its expression in Xenopus laevis oocytes and its precise characterization using two-electrode voltage-clamp electrophysiology and voltage-clamp fluorometry (3–7). Unlike ion channels, which fluctuate between states of different conductance, cotransporters must engage in a cycle of conformational changes, going through occluded states to translocate Na+ and substrate across the lipid bilayer by exposing their binding sites to one side of the membrane at a time. First introduced by Jardetzky (8), the existence of such an alternating access mechanism during cotransport is now supported by evidence drawn from structural studies (9,10) including the recent crystallization of vSGLT (11), a bacterial homolog of human SGLT1. The rate at which this cycle of conformational changes occurs is called the turnover rate (TOR) and is expressed as the average number of complete cycles/s performed by a single cotransporter molecule. If a cell expresses N electrogenic cotransporter molecules, the cotransport current (ICotr) is given by
| (1) |
where s is the net number of elementary charges (e) transported during a complete transport cycle (s = 2 for SGLT1).
Over the last decades, different estimates have been made for the SGLT1 TOR, but they do not agree on a consensus value. The first estimate of TOR was made by Peerce et al. (12) using binding experiments (3H phlorizin and fluorescein isothiocyanate) and glucose uptake data on brush-border membranes prepared from rabbit small intestine. They suggested that the TOR of the Na+/glucose cotransporter was in the range 3–6 s−1. In the first extended kinetic study of rabbit SGLT1 expressed in oocytes (13), a six-state model was described with a series of rate constants that could reproduce the basic steady-state and pre-steady-state electrophysiological observations. At negative membrane potentials, the intracellular Na+ dissociation was suggested to be the rate-limiting step at 10 s−1, which implies that TOR cannot be faster than 10 s−1. It is also possible to deduce the TOR of a cotransporter from measurement of the phlorizin-sensitive charge displacement in the absence of substrate (14). Given a few assumptions (see Discussion), the ratio of ICotr to the maximal charge displaced (Qmax) is an estimation of TOR and yields a value of 57 s−1 (14) for very negative membrane potentials. More recently, a study from the same laboratory presented a revised estimation of Qmax with prolonged voltage pulses, which led to a TOR of 28 s−1 (4). This last estimation of TOR would suggest that a typical ICotr of 1 μA/oocyte would imply the presence of 1.1 × 10¹¹ carriers/oocyte. This is much larger than the estimated density of particles associated with SGLT1 protein using freeze-fracture electron microscopy (15).
In an effort to better delimit the TOR of SGLT1 and to contrast it with the rate-limiting steps of different kinetic models, we sought to use a method that is independent of both the ratio and of the detection of particles putatively representing the presence of SGLT1 in the plasma membrane. The ion-trap technique (ITT), an experimental approach recently presented by our laboratory (16), offers the possibility of shedding new light on the problem of correctly estimating the value of TOR for hSGLT1.
Materials and Methods
Oocyte preparation and injection
Oocytes were surgically removed from Xenopus laevis frogs and were individually separated before defolliculation, as described previously (17). One to two days after the procedure, healthy oocytes were injected with 4.6 ng of mRNA coding for human myc-hSGLT1 at a concentration of 0.1 μg/μl in water. This N-terminus myc-tagged version of human SGLT1 was previously shown to be functionally indistinguishable from the untagged form (17). Oocytes were kept in Barth's solution (in mM, 90 NaCl, 3 KCl, 0.82 MgSO4, 0.41 CaCl2, 0.33 Ca(NO3)2, and 5 Hepes, pH 7.6) supplemented with 5% horse serum, 2.5 mM Na+ pyruvate, 100 units/ml penicillin, and 0.1 mg/ml streptomycin for 4–5 days before performing electrophysiological experiments.
Solutions
When needed, 5 mM α-methyl-D-glucose (αMG, a nonmetabolized glucose analog) was added to the normal saline solution used for electrophysiology (in mM, 90 NaCl, 3 KCl, 0.82 MgCl2, 0.74 CaCl2, and 10 HEPES, pH 7.5 with Tris). The pH 5.5 Na+-free solution used for measurements of H+/αMG cotransport was identical to the normal saline solution with the exception that it was weakly buffered with 1.5 mM MES and 90 mM NaCl was replaced with 65 mM N-methyl-D-glucamine and 50 mM D-mannitol. To inhibit the cotransporter, 0.2 mM phlorizin (Pz) was added. Given the low affinity of SGLT1 for αMG at acidic pH (18), where the Km is 4 mM at −150 mV, measurement of H+/glucose cotransport activity was done by adding 5 or 35 mM αMG to the acidic solution. When 35 mM αMG was used, an equivalent amount of D-mannitol was removed. Unless otherwise mentioned, all chemicals were obtained from Sigma-Aldrich (St. Louis, MO).
Electrophysiology and the ion-trap technique
Two-microelectrode voltage-clamp measurements and current filtering (1 kHz) were performed using an OC-725C oocyte clamp (Warner Instrument, Hamden, CT). Data recording was achieved using a Digidata 1322A acquisition system and pClamp 8.2 software (Axon Instruments, Union City, CA). Voltage and current microelectrodes were filled with 1 M KCl and showed a resistance of 1–3 MΩ. The bath current electrode was an Ag-AgCl pellet and the reference voltage electrode was a 1 M KCl agar bridge.
The ion trap technique (ITT) has been described in detail in a recent publication from this laboratory (16). Briefly, the technique consists in measuring ionic concentrations at the surface of a voltage-clamped oocyte using a large (tip diameter 50–100 μm) ion-selective electrode (ISE). To improve the accuracy of the measurement when significant currents are circulating in the bath, the signal of the ISE was corrected for any changes in bath potential by using an additional reference microelectrode (filled with 1 M KCl) positioned within 100 μm of the ISE (Fig. 1 A). When the large-tip ISE is gently pushed against the oocyte plasma membrane, it creates a small volume of extracellular solution called the trap (height ∼5 μm) (16), which roughly corresponds to the thickness of the observed plasma-membrane invaginations. ITT can be used to measure the steady-state transport of an ion across the membrane lining the trap. For example, a constant inward transport of a given ion will lead to a stable decrease in the trap concentration of this ion within 20–30 s. ITT can also be used to detect the initial rate of change in the trap ionic concentration when the transmembrane transport of a given ion is suddenly changed. This can be done by applying a fast voltage pulse to the oocyte while using the excellent time resolution of the ISE (∼20 ms). The initial binding of an ion to a newly exposed binding site of a transporter will result in an abrupt change in local ionic concentration that we call the step. In the following hundreds of milliseconds, the steady-state transmembrane ionic flux is reached, producing a constant change in the voltage of the ISE that we call the slope (Fig. 1 B).
Figure 1.
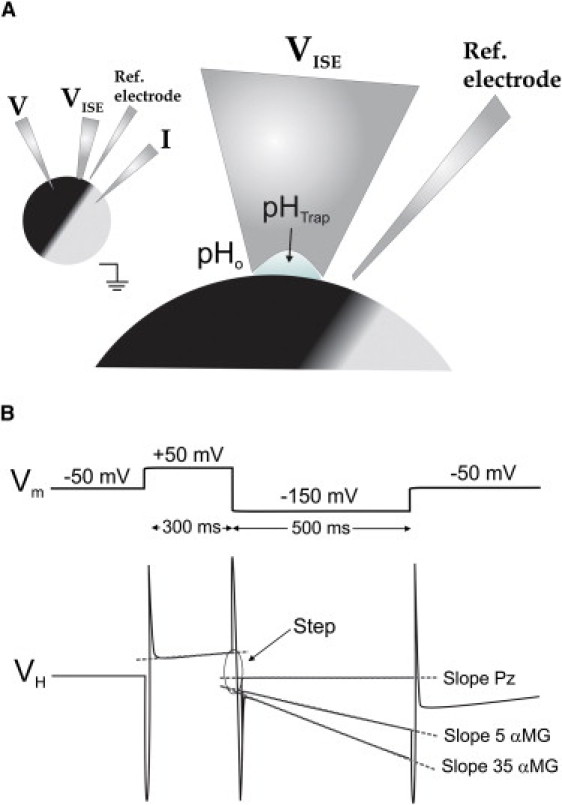
Experimental arrangement and pulse protocol used for the ITT. (A) An oocyte is placed in a bath, observed with a low-power microscope, and impaled with voltage and current electrodes to perform voltage-clamp measurements. An ISE with a large tip diameter (50–100 μm) is gently pushed against the plasma membrane to create a confined space called a trap between the plasma membrane infolding and the H+-selective resin of the ISE. A reference electrode is placed in the bath near the ISE tip to monitor local potential changes and correct the ISE signal (VH) accordingly. (B) Voltage (Vm) pulse protocol and expected ISE signals. Straight lines are fitted to the ISE signal at −150 mV and at +50 mV to obtain the two parameters used in the ITT: the slope and the step. The slope is simply the rate at which VH changes at −150 mV. The step is the sudden change in VH observed at the time that Vm is changed from +50 to −150 mV.
As explained below in greater detail, we chose to use pH-sensitive electrodes instead of Na+-sensitive electrodes to improve the accuracy in the determination of the TOR. Electrophysiological and ITT measurements were performed using five sequential repetitions of a voltage pulse protocol with a holding potential of −50 mV and a 300-ms voltage step at +50 mV followed by a 500 ms hyperpolarization at −150 mV (Fig. 1 B). To obtain an accurate value of the H+-selective electrode voltage (VH), the drift in VH was corrected by subtracting the slope measured at −50 mV before changing the membrane potential using a time window of 700 ms. After this drift correction, a straight line was fitted to the VH measured in the last 200 ms spent at +50 mV and in the last 400 ms spent at −150 mV. The instantaneous step in VH upon the sudden voltage change was evaluated by measuring the difference between the two straight lines at the time where the voltage was stepped from +50 to −150 mV (see Fig. 1 B). All signals were sampled at a frequency of 1 point/0.15 ms, and the noise level on the VH signal was further reduced by averaging 10 consecutive points (the final signal displaying 1 data point/1.5 ms). The final VH signal was low-pass-filtered using a cut-off frequency of 200 Hz.
Estimating the cotransporter TOR using ITT
It is well established that the transport stoichiometry of SGLT1 is 2 Na+ ions/glucose molecule (6,19,20) (i.e., s = 2 in Eq. 1), but in the absence of external Na+, it also functions as a H+/glucose cotransporter (18,21). The transport stoichiometry appears to be conserved (2 H+ for 1 glucose molecule), as suggested by the sigmoidal activation curve as a function of external proton concentration. SGLT1 was studied in the absence of Na+ using a weakly buffered acidic external solution (pH 5.5). In the absence of substrate, oocytes expressing SGLT1 displayed Pz-sensitive transient currents of large amplitude (22) that could be integrated to yield a displaced charge Q for a given voltage pulse V. An example of such a Q-V curve is presented in Fig. 2 A. The data could be fitted with a Boltzman equation:
| (2) |
where Qmax = (Q– − Q+). Q– and Q+ represent the charge transferred when the oocyte membrane potential moves from the resting potential to a very negative or a very positive potential, respectively. Once fitted, the data of Fig. 2 A are characterized by a V1/2 of −94 mV, a z of 0.45, and a Qmax of 24 nC (n = 14). As a negative membrane potential (Vm) is known to facilitate extracellular Na+ or H+ binding, the cotransporter is assumed to carry a displaceable negative charge that will move with the cation binding site. This is depicted in the kinetic model shown in Fig. 2 B, which is generally used to describe the activity of SGLT1 and other related cotransporters (13,19,23,24). When Vm is positive, the cotransporter experiences a conformational change that brings it into the C1 configuration (inward-facing configuration). When Vm is changed to a negative value, the cotransporter moves into configuration C2, where it can bind external protons and reach the C3 configuration (the outward-facing cation-bound configuration). The Q-V curve reflects these conformational changes and shows that, at +50 mV, the mobile charge has almost reached a limiting value, indicating that most of the cotransporters are in the C1 configuration. When Vm goes from +50 to −150 mV in the absence of glucose, a fraction, f, of the cotransporters moves into the C3 configuration. As seen from Fig. 2 A, such a voltage pulse would result in the displacement of 65% of the mobile charges (i.e., from 10% outward-facing at +50 mV to 75% outward-facing at −150 mV).
Figure 2.
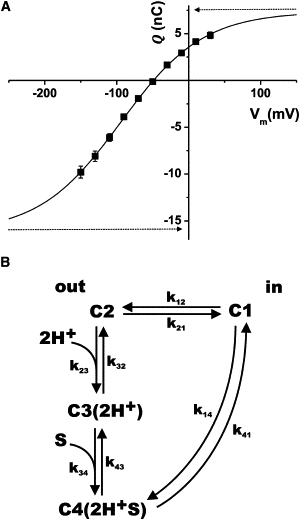
Charge displacement in hSGLT1. (A) Integration of the transient currents associated with hSGLT1 in the absence of glucose yields a Q-V curve that can be fitted with a Boltzmann equation (see Eq. 2). In this example, the Q-V curve shown is an average from 14 oocytes. It was obtained in 0 mM Na+ and 0 mM αMG buffer (pH 5.5) and the fitted Boltzmann equation is characterized by a V1/2 of −94 mV, a z value of 0.45, and a Qmax of 24 nC. (B) A simplified four-state kinetic model used to account for pre-steady-state and cotransport currents. As previously proposed (13,18,19), the cotransporter binding sites can be exposed to the intracellular (C1) or to the extracellular side of the membrane (C2), where it can bind two cations (here, two protons) to reach state C3. After binding a sugar molecule, state C4 is reached and all the subsequent steps are combined into a single step representing the reorientation of the binding sites toward the intracellular side where sugar and ions are released. The reorientation of the free binding sites and the cation binding step are assumed to be electrogenic. In the external absence of sugar, but with cations present, a very negative membrane potential would drive the cotransporter into state C3, whereas a very positive potential would drive it into state C1.
In this ITT experiment, we are measuring the local proton concentration at the external surface of an oocyte in the trap. As Vm is switched from +50 mV to −150 mV, a fraction f of the cotransporters suddenly switches to conformation C3, and a number of protons consequently attach to the cotransporter external site. This will produce a sudden increase in the trap pH, which is referred to as the step:
| (3) |
where A is the Avogadro number, Vtrap is the volume of the trap, Ntrap is the number of cotransporters lining the trap, and β is the buffering power of the external solution given in M/pH unit.
When αMG is added to the external solution, it will equilibrate with the trap within 20 s (16), and upon applying a voltage step from +50 to −150 mV, the step will be followed by a progressive alkalinization that will occur at the actual TOR of the cotransporter. This alkalinization rate is called the slope and is given by
| (4) |
Clearly, if the step and the slope are obtained from the same experiment (same Vtrap and same Ntrap), the slope/step ratio yields TOR/f. The TOR can be calculated if f is estimated from the charge displacement (Q-V curve) between +50 and −150 mV. If the cotransport current caused by adding αMG is measured simultaneously, the number of cotransporters/oocyte can be obtained using Eq. 1.
Statistics
Data are presented as the average ± SE, where n is the number of oocytes used (one experiment/oocyte and not more than four oocytes from the same donor frog), and are compared using Student's t-test. In the figures, error bars are not shown when smaller than symbols.
Results
Although it is technically possible to measure the cotransporter TOR using Na+-selective electrodes, we chose to use pH electrodes in Na+-free solutions because this allowed improved accuracy of the TOR determination. This advantage comes from the possibility of using a low buffering power in the external solution, which greatly increases the amplitude of the signal read by the ISE for any given change in transmembrane proton transport. With Na+-selective electrodes, the only way to improve our detection limit would be to reduce the background Na+ concentration, which would also decrease the amplitude of the transmembrane Na+ transport. For each oocyte studied, the cotransport current was measured in the presence of Na+ and 5 mM αMG and at pH 5.5 (Na+-free solution) with 5 and 35 mM αMG. The TOR in the presence of Na+ was calculated from the TOR in the presence of H+ using the ratio between the two cotransport rates.
Fig. 3 shows a typical pulse protocol with simultaneous current and VH measurements for an hSGLT1-expressing oocyte in the presence of Na+-free solutions (pH 5.5) containing 0, 5, and 35 mM αMG (Fig. 3 A) or 0.2 mM Pz (Fig. 3 B), as well as measurements for a noninjected oocyte (Fig. 3 C). When hSGLT1 is active, the step amplitude is on the order of 0.4–1 mV, which is comparable to the noise amplitude on a VH trace low-pass-filtered at 200 Hz. Such a small change in the voltage of a pH-selective electrode upon changing Vm from +50 to −150 mV could represent a true change in the local pH and/or a change in the electrical potential of the trap. The most serious possibility for a change in the trap voltage would be that the current going through the membrane area covered by the ISE would generate a voltage drop as it passes through the loose seal created between the ISE and the oocyte membrane. This hypothesis can be ruled out, because in experiments employing 14 oocytes, the step amplitude did not change as a function of the external αMG concentration used (the step averaged −0.52 ± 0.06, −0.52 ± 0.05, and −0.55 ± 0.06 mV in the presence of 0, 5, and 35 mM αMG, respectively; see Fig. 4). In contrast, the observed current step when the membrane potential was rapidly changed from +50 to −150 mV averaged −857 ± 52 nA, −1220 ± 86 nA, and −1640 ± 110 nA in the presence of 0, 5, and 35 mM αMG, respectively. In other words, the step amplitude varied by less than 4%, whereas the current amplitude varied by up to twofold. The second observation that supports the hypothesis that the voltage-dependent reorientation of the proton binding sites is responsible for the step is that more than half of the step amplitude disappeared in the presence of Pz. During the experiment shown in Fig. 3, A and B, which was repeated for 14 oocytes expressing SGLT1, we measured the step in the presence of a weakly buffered solution at pH 5.5. The step averaged −0.52 ± 0.06 mV in 0 αMG solution but was only −0.21 ± 0.03 mV after the addition of 0.2 mM Pz (14 paired measurements). The fact that a statistically significant step remains in the presence of Pz indicates that a large negative voltage step can trigger some nonspecific proton binding to the lipids or to the proteins embedded in the plasma membrane. This is confirmed by the observation that noninjected oocytes generate an average step of −0.13 ± 0.03 mV (n = 4), not statistically different from the step observed in the presence of Pz (p = 0.20 in an unpaired t-test). To further characterize the step, we verified that the signal was reversible by estimating its value from the OFF pulse transition. Upon returning to −50 mV, a Pz-sensitive step averaging −0.15 ± 0.05 mV could be detected when 0, 5, or 35 mM αMG was present, indicating that half of all H+ bound to the cotransporters are released upon this depolarization.
Figure 3.

Experimental current and pH signals (VH) measured in 0 mM Na+ solution, pH 5.5. The zero current level is represented by the horizontal dashed line in each current recording. Vertical dashed lines on the VH pulses indicate the intervals within which the linear fits were done at +50 mV and −150 mV. (A) Superposed results corresponding to 0 (gray), 5 (black), or 35 (gray) mM αMG. (B) Current and VH recordings in the presence of 200 μM Pz for the same oocyte. (C) Control experiment done on a noninjected oocyte in 0 mM αMG.
Figure 4.

Average (±SE) of the rapid pH change (the step) measured as the membrane potential is stepped from +50 to −150 mV. The measurements performed in the presence of 0, 5, and 35 mM αMG and 0.2 mM Pz are from the same 14 oocytes (paired measurements). Control experiments in 0 mM αMG were performed on noninjected oocytes (n = 4) and their average is not significantly different from the average step measured in 0.2 mM Pz (p = 0.20, unpaired Student's t-test).
Another interesting attribute of the measurements was the presence of a steady-state alkalinization of the trap when the membrane potential was held at −150 mV (Fig. 3 A). The results of this analysis are presented in Fig. 5 and demonstrate that the slope is tightly related to the H+/glucose cotransport activity. Using 14 oocytes, the average slope in the presence of Pz was −0.33 ± 0.06 mV s−1, and it increased progressively to −1.14 ± 0.18 mV s−1, −2.30 ± 0.27 mV s−1, and −4.65 ± 0.49 mV s−1 when it was measured in the presence of 0, 5, and 35 mM αMG, respectively (Fig. 5 A). It is interesting to note that noninjected oocytes did not generate any significant pH slope, averaging +0.03 ± 0.07 mV s−1 (n = 4) when they were maintained at −150 mV. In Fig. 5 B, the currents recorded at −150 mV are shown for noninjected oocytes and for hSGLT1-expressing oocytes in the presence of Pz or 0, 5, or 35 mM αMG. Finally, Fig. 5 C shows that a linear correlation exists between the Pz-sensitive slope and the Pz-sensitive current measured at −150 mV. This confirms the presence of proton-glucose cotransport in the presence of glucose and the presence of a leak current in the absence of glucose, which, as we have recently shown (25), is largely mediated by protons at low external pH levels. At pH 7.5, we have also shown that several monovalent cations, including cations that do not interact with the cotransporter cation-binding sites, can mediate as much leak current as Na+ does. This suggests that the leak pathway is distinct from the Na+-selective cotransport pathway and present for both Na+-bound and Na+-free conformations of the cotransporter.
Figure 5.

Mean values (±SE) of the slope of the VH signal and the corresponding oocyte cotransport current at −150 mV. Measurements done in 0, 5, and 35 mM αMG and 0.2 mM Pz were paired (n = 14). Noninjected oocytes (n = 4) were used as a control. (A) Slope of the linear fit of the VH signal indicating a steady-state ionic uptake by the membrane patch under the trap. (B) Current recorded simultaneously with slope. (C) Linear correlation between the Pz-sensitive slope and the Pz-sensitive current. Pz-sensitive signals are calculated by subtracting the signal in 0.2 mM Pz from the signal obtained in the presence of either 0, 5, or 35 mM αMG.
Based on the results presented above, we can proceed to the calculation of TOR. Since there is a Pz-sensitive proton flux through SGLT1 in the absence of substrate (see the Pz-sensitive slope in the absence of αMG in Fig. 5 A), the cotransporter TOR was estimated using the increase in slope due to the addition of αMG. The TOR was then obtained at −150 mV by dividing the αMG-sensitive slope by the Pz-sensitive step and multiplying the result by the correcting factor 0.65, which represents the fraction, f, of the cotransporters that experienced a conformational change after the voltage step from +50 mV to −150 mV (see Fig. 2 A). This was done for each of the 14 oocytes exposed to 35 mM αMG, and the average TOR was found to be 8.00 ± 1.3 s−1 (see Table 1, where the average step and slope are also given). Applying Eq. 1, we can use the TOR and the current caused by the addition of 35 mM αMG to estimate the number of carriers (N) in the plasma membrane of each oocyte, assuming that two protons per transport cycle are translocated. This calculation yielded an average of 3.6 ± 0.7 × 10¹¹ transporters/oocyte. Using the same analysis, the TOR corresponding to the addition of 5 mM αMG at pH 5.5 could also be calculated and averaged at 2.71 ± 0.38 s−1. Using the current measured in the presence of 5 mM αMG, the number of transporters in each oocyte was calculated and found to be very close to the number obtained using the measurements with 35 mM αMG. According to Eq. 1, if we assume that the number of cotransporters in a given oocyte is constant as a function of different experimental conditions, the TOR can be evaluated in each case, as it is simply proportional to the measured cotransport current. Using this strategy, we obtained a TOR of 13.3 ± 2.4 s−1 when 90 mM Na+ and 5 mM αMG (pH 7.5) were present. The results are summarized in Table 1.
Table 1.
Calculated TOR values associated with different extracellular conditions
| 0 mM Na pH 5.5 |
90 mM Na pH 7.5 |
||||||||
|---|---|---|---|---|---|---|---|---|---|
| 5 αMG | 35 αMG | 5 αMG | |||||||
| Step (mV) | Slope (mV s−1) | I (μA) | TOR (s−1) | Step(mV) | Slope (mV s−1) | I (μA) | TOR (s−1) | I (μA) | TOR (s−1) |
| −0.31 ± 0.03 | −1.18 ± 0.12 | −0.32 ±0.04 | 2.71 ± 0.38 | −0.34 ± 0.05 | −3.53 ± 0.33 | −0.70 ± 0.06 | 8.00 ± 1.3 | −1.08±0.61 | 13.3±2.4 |
TOR5αMG and TOR35αMG at pH 5.5 are obtained directly from the slope/step ratios multiplied by the correction factor, f = 0.65, corresponding to the fraction of cotransporters moving in the electrical field of the membrane during a voltage pulse from +50 to −150 mV. This was done for each oocyte, and the mean values are shown (n = 14). The steps used for the calculation were obtained by subtracting the step measured in the presence of 0.2 mM Pz from the step in 5 or 35 mM αMG. The slopes were obtained by subtracting the slope in 0 mM αMG (pH 5.5) buffer from the slopes measured in the presence of 5 mM αMG or 35 mM αMG. Equation 1 was used to calculate TOR5αMG when 90 mM Na+ (pH 7.5) was in the bath.
Discussion
Several estimates of SGLT1 TOR have been made over the last decades. The method of calculation using the ratio obtained by electrophysiology has been used frequently in the cotransporter literature (4,14,26). In principle, the Boltzmann equation (Eq. 2) represents a charge movement across the membrane electrical field as a protein is oscillating between two conformational states related by voltage-dependent rate constants. In our case (Fig. 2 B), there are at least three conformational states in the absence of substrate, but the Boltzmann equation can still be used for a rough description of the charge movement. If z is the number of elementary charges (e) per transporter that move across the entire electrical field of the membrane, Qmax is given by
| (5) |
Considering Eqs. 1 and 5, the ratio yields the TOR as long as the number of charges cotransported, s, is equal to the number of mobile charges in the absence of substrate, z. This has been widely accepted because Na+/glucose kinetic modeling has put forward the idea that the empty carrier possesses a charge of −2 e that is neutralized when two Na+ ions bind to their sites, yielding a situation where all subsequent kinetic steps are considered electroneutral (13,27). However, estimates of the apparent valency of the carrier deduced from Boltzmann fits usually lead to z values of ∼1 in the presence of ∼100 mM Na+ (14) (at pH 5.5 in Na+-free solution, z = 0.45 in this study). In contrast, measurements of Qmax and N in freeze-fracture experiments (15) yield an average of 3.5 charges/transporter. This means that to calculate the TOR using the ratio requires several corrections where the estimation of the number of charges/transporter (z) is crucial. If one uses z = 1, a stoichiometry s of 2, and the revised estimate of Qmax presented in Loo et al. (4), the TOR of hSGLT1 in the presence of Na+ and a large negative membrane potential would be 14 s−1, which agrees with the value of 13.3 s−1 obtained in the study presented here.
Although it is well established that two Na+ ions bind to SGLT1 to drive glucose across the membrane, we have made the assumption that the stoichiometry of H+/glucose cotransport is 2:1. This assumption is indeed supported by experiments with H+ activation of glucose transport that yielded a Hill coefficient of 1.5 at −50 mV (21). Consequently, an error in the estimation of the Na+/glucose TOR at pH 7.5 from the TOR evaluated at pH 5.5 could be introduced if the stoichiometry of H+/glucose and Na+/glucose cotransport happened to be different. The advantage of a known ion/glucose stoichiometry if we had used Na+-sensitive electrodes is negated by the better signal/noise ratio for ITT when using H+-sensitive electrodes.
In Table 1, an estimate of TOR at pH 5.5 is shown. At pH 5.5, a TOR of 8.00 ± 1.3 s−1 at 35 mM αMG is directly derived from the slope/step ratio. Fig. 4 shows that the step used in this estimation is related to the presence of SGLT1, because its value is reduced to comparable levels when 0.2 mM Pz is present or when the experiment is done on noninjected oocytes. The step in 0, 5, or 35 mM αMG is a measurement that represents the number of protons that rapidly leave the trap to bind to the newly available sites on carriers that have just experienced a voltage-dependent conformational change. It is interesting to note that the step remains constant in the presence of 0, 5, or 35 mM αMG, whereas the pre-steady-state charge movement becomes impossible to measure in the presence of increasing concentrations of αMG, as it becomes largely hidden by an important steady-state cotransport current (22). Measuring the step amplitude with some accuracy is a crucial part of the determination of TOR. It is difficult to establish a limit to the minimal cotransporter density required to estimate TOR with the ITT approach, but we can state that the step could be measured for oocytes expressing only 50% of their maximal activity level. The slope used in the calculation of TOR is also directly related to the presence of SGLT1 at the plasma membrane. The linear relationship between the Pz-sensitive current and the Pz-sensitive slope at pH 5.5 (Fig. 5 C) clearly shows that an increase in carrier-mediated current is reflected in an increase in the alkalinization rate of the trap due to the protons that are translocated with glucose. The TOR has also allowed us to estimate, using Eq. 1, that 3.6 ± 0.7 × 10¹¹ transporters are expressed at the plasma membrane of an oocyte. It is interesting to note that this calculation is independent of the membrane area covered by the trap. The numbers of transporters obtained in freeze-fracture electron microscopy were reported to be 0.07, 0.20, and 0.32 × 10¹¹ carriers for three SGLT1-expressing oocytes characterized by Qmax values of 4, 11.5, and 16 nC, respectively (15). In this study, 14 oocytes with an average Qmax of 25.8 ± 1.6 nC (ranging from 15 to 32 nC) were used. After correction for the respective Qmax values, the number of transporters deduced from freeze-fracture appears to be underevaluated by fourfold. Note that the freeze-fracture study yields an average of 3.5 charges/particle, which is also 3.5 times larger than the z value of 1 obtained from a Boltzmann fit of the Q-V curve. It is possible that the freeze-fracture approach does not succeed in detecting all SGLT1 particles or that the section studied, corresponding to 1 μm2, is not representative of a complete oocyte area of 0.4 cm2.
Table 1 also shows the calculated TOR of 13.3 ± 2.4 s−1 at −150 mV, pH 7.5, when 90 mM Na+ and 5 mM αMG are present. It should be stressed that no first-order rate constant in the forward direction (Na+/glucose uptake direction) can be slower than the TOR. In a simple case where a protein can adopt two conformations through a forward and a backward rate constant (kf and kb, respectively), the time constant τ associated with the transition is
| (6) |
In the more complex kinetic model shown in Fig. 2 B, four time constants are expected, but the value of the longest time constant cannot be >1/TOR, i.e., 75 ms (1/13.3 s) in the case of hSGLT1, since all forward rate constants obey kf ≥ TOR. Over the past few years, electrophysiological and fluorometric experiments with extended voltage pulse durations (up to 500 ms) have revealed the presence of slow time constants of 80, 110, and even 139 ms associated with the movements of hSGLT1 at hyperpolarizing potentials in the absence of substrate (4,27). In view of the speed at which the cotransporter is capable of mediating a full cycle, it is doubtful that these slow time constants can be associated with any of the steps required to mediate the cotransport process. Our estimation of the TOR using ITT provides a boundary useful for setting a lower timescale for conformational changes directly related to a cotransport mechanism. The presence of these slow charge movements or slow fluorescence relaxations may be real, but they may be related to processes that occur in parallel with the cotransport mechanism as, for example, a slowly stabilizing leak current or a local molecular rearrangement in the immediate vicinity of an attached fluorophore. The important constraint set by the determination of TOR must be respected in any kinetic model that aims to describe the cotransport behavior of hSGLT1.
Conclusion
This study shows that ITT can be used to obtain a reliable and independent estimate of a cotransporter TOR. The results indicate that the number of hSGLT1 cotransporters expressed in an oocyte is fourfold larger than previously estimated using freeze-fracture experiments. In the presence of Na+ and of a saturating substrate concentration, the maximal TOR of hSGLT1 is 13.3 ± 2.4 s−1. This number has significant consequences in the analysis of electrogenic and fluorescence kinetics of cotransporters.
Acknowledgments
This work was supported by the Canadian Institutes for Health Research (MOP-10580).
References
- 1.Crane R.K. Na+-dependent transport in the intestine and other animal tissues. Fed. Proc. 1965;24:1000–1006. [PubMed] [Google Scholar]
- 2.Hediger M.A., Coady M.J., Wright E.M. Expression cloning and cDNA sequencing of the Na+/glucose co-transporter. Nature. 1987;330:379–381. doi: 10.1038/330379a0. [DOI] [PubMed] [Google Scholar]
- 3.Meinild A.K., Hirayama B.A., Loo D.D. Fluorescence studies of ligand-induced conformational changes of the Na+/glucose cotransporter. Biochemistry. 2002;41:1250–1258. doi: 10.1021/bi011661r. [DOI] [PubMed] [Google Scholar]
- 4.Loo D.D., Hirayama B.A., Wright E.M. Perturbation analysis of the voltage-sensitive conformational changes of the Na+/glucose cotransporter. J. Gen. Physiol. 2005;125:13–36. doi: 10.1085/jgp.200409150. [DOI] [PMC free article] [PubMed] [Google Scholar]
- 5.Coady M.J., Pajor A.M., Wright E.M. Expression of mammalian renal transporters in Xenopus laevis oocytes. Arch. Biochem. Biophys. 1990;283:130–134. doi: 10.1016/0003-9861(90)90622-6. [DOI] [PubMed] [Google Scholar]
- 6.Parent L., Supplisson S., Wright E.M. Electrogenic properties of the cloned Na+/glucose cotransporter: I. Voltage-clamp studies. J. Membr. Biol. 1992;125:49–62. doi: 10.1007/BF00235797. [DOI] [PubMed] [Google Scholar]
- 7.Loo D.D., Hirayama B.A., Wright E.M. Conformational changes couple Na+ and glucose transport. Proc. Natl. Acad. Sci. USA. 1998;95:7789–7794. doi: 10.1073/pnas.95.13.7789. [DOI] [PMC free article] [PubMed] [Google Scholar]
- 8.Jardetzky O. Simple allosteric model for membrane pumps. Nature. 1966;211:969–970. doi: 10.1038/211969a0. [DOI] [PubMed] [Google Scholar]
- 9.Abramson J., Wright E.M. Structure and function of Na+-symporters with inverted repeats. Curr. Opin. Struct. Biol. 2009;19:425–432. doi: 10.1016/j.sbi.2009.06.002. [DOI] [PMC free article] [PubMed] [Google Scholar]
- 10.Forrest L.R., Rudnick G. The rocking bundle: a mechanism for ion-coupled solute flux by symmetrical transporters. Physiology (Bethesda) 2009;24:377–386. doi: 10.1152/physiol.00030.2009. [DOI] [PMC free article] [PubMed] [Google Scholar]
- 11.Faham S., Watanabe A., Abramson J. The crystal structure of a sodium galactose transporter reveals mechanistic insights into Na+/sugar symport. Science. 2008;321:810–814. doi: 10.1126/science.1160406. [DOI] [PMC free article] [PubMed] [Google Scholar]
- 12.Peerce B.E., Wright E.M. Sodium-induced conformational changes in the glucose transporter of intestinal brush borders. J. Biol. Chem. 1984;259:14105–14112. [PubMed] [Google Scholar]
- 13.Parent L., Supplisson S., Wright E.M. Electrogenic properties of the cloned Na+/glucose cotransporter: II. A transport model under nonrapid equilibrium conditions. J. Membr. Biol. 1992;125:63–79. doi: 10.1007/BF00235798. [DOI] [PubMed] [Google Scholar]
- 14.Loo D.D., Hazama A., Wright E.M. Relaxation kinetics of the Na+/glucose cotransporter. Proc. Natl. Acad. Sci. USA. 1993;90:5767–5771. doi: 10.1073/pnas.90.12.5767. [DOI] [PMC free article] [PubMed] [Google Scholar]
- 15.Zampighi G.A., Kreman M., Wright E.M. A method for determining the unitary functional capacity of cloned channels and transporters expressed in Xenopus laevis oocytes. J. Membr. Biol. 1995;148:65–78. doi: 10.1007/BF00234157. [DOI] [PubMed] [Google Scholar]
- 16.Blanchard M.G., Longpré J.P., Lapointe J.Y. Measuring ion transport activities in Xenopus oocytes using the ion-trap technique. Am. J. Physiol. Cell Physiol. 2008;295:C1464–C1472. doi: 10.1152/ajpcell.00560.2007. [DOI] [PubMed] [Google Scholar]
- 17.Bissonnette P., Noël J., Lapointe J.Y. Functional expression of tagged human Na+-glucose cotransporter in Xenopus laevis oocytes. J. Physiol. 1999;520:359–371. doi: 10.1111/j.1469-7793.1999.00359.x. [DOI] [PMC free article] [PubMed] [Google Scholar]
- 18.Hirayama B.A., Loo D.D., Wright E.M. Cation effects on protein conformation and transport in the Na+/glucose cotransporter. J. Biol. Chem. 1997;272:2110–2115. doi: 10.1074/jbc.272.4.2110. [DOI] [PubMed] [Google Scholar]
- 19.Chen X.Z., Coady M.J., Lapointe J.Y. Thermodynamic determination of the Na+/glucose coupling ratio for the human SGLT1 cotransporter. Biophys. J. 1995;69:2405–2414. doi: 10.1016/S0006-3495(95)80110-4. [DOI] [PMC free article] [PubMed] [Google Scholar]
- 20.Bourgeois F., Coady M.J., Lapointe J.Y. Determination of transport stoichiometry for two cation-coupled myo-inositol cotransporters: SMIT2 and HMIT. J. Physiol. 2005;563:333–343. doi: 10.1113/jphysiol.2004.076679. [DOI] [PMC free article] [PubMed] [Google Scholar]
- 21.Hirayama B.A., Loo D.D., Wright E.M. Protons drive sugar transport through the Na+/glucose cotransporter (SGLT1) J. Biol. Chem. 1994;269:21407–21410. [PubMed] [Google Scholar]
- 22.Gagnon D.G., Frindel C., Lapointe J.Y. Effect of substrate on the pre-steady-state kinetics of the Na+/glucose cotransporter. Biophys. J. 2007;92:461–472. doi: 10.1529/biophysj.106.092296. [DOI] [PMC free article] [PubMed] [Google Scholar]
- 23.Andrini O., Ghezzi C., Forster I.C. The leak mode of type II Na+-Pi cotransporters. Channels (Austin) 2008;2:346–357. doi: 10.4161/chan.2.5.6900. [DOI] [PubMed] [Google Scholar]
- 24.Guan L., Kaback H.R. Lessons from lactose permease. Annu. Rev. Biophys. Biomol. Struct. 2006;35:67–91. doi: 10.1146/annurev.biophys.35.040405.102005. [DOI] [PMC free article] [PubMed] [Google Scholar]
- 25.Longpré J.P., Gagnon D.G., Lapointe J.Y. The actual ionic nature of the leak current through the Na+/glucose cotransporter SGLT1. Biophys. J. 2010;98:231–239. doi: 10.1016/j.bpj.2009.10.015. [DOI] [PMC free article] [PubMed] [Google Scholar]
- 26.Forster I.C., Köhler K., Murer H. Forging the link between structure and function of electrogenic cotransporters: the renal type IIa Na+/Pi cotransporter as a case study. Prog. Biophys. Mol. Biol. 2002;80:69–108. doi: 10.1016/s0079-6107(02)00015-9. [DOI] [PubMed] [Google Scholar]
- 27.Loo D.D., Hirayama B.A., Wright E.M. Conformational dynamics of hSGLT1 during Na+/glucose cotransport. J. Gen. Physiol. 2006;128:701–720. doi: 10.1085/jgp.200609643. [DOI] [PMC free article] [PubMed] [Google Scholar]