

Abstract
The physical and mechanical properties of the cell envelope of Escherichia coli are poorly understood. We use fluorescence recovery after photobleaching to measure diffusion of periplasmic green fluorescent protein and probe the fluidity of the periplasm as a function of external osmotic conditions. For cells adapted to growth in complete medium at 0.14–1.02 Osm, the mean diffusion coefficient <Dperi> increases from 3.4 μm2 s−1 to 6.6 μm2 s−1 and the distribution of Dperi broadens as growth osmolality increases. This is consistent with a net gain of water by the periplasm, decreasing its biopolymer volume fraction. This supports a model in which the turgor pressure drops primarily across the thin peptidoglycan layer while the cell actively maintains osmotic balance between periplasm and cytoplasm, thus avoiding a substantial pressure differential across the cytoplasmic membrane. After sudden hyperosmotic shock (plasmolysis), the cytoplasm loses water as the periplasm gains water. Accordingly, <Dperi> increases threefold. The fluorescence recovery after photobleaching is complete and homogeneous in all cases, but in minimal medium, the periplasm is evidently thicker at the cell tips. For the relevant geometries, Brownian dynamics simulations in model cytoplasmic and periplasmic volumes provide analytical formulae for extraction of accurate diffusion coefficients from readily measurable quantities.
Introduction
The physical and mechanical properties of the cytoplasm and the periplasm of Gram-negative bacteria such as Escherichia coli have long been debated (1–3). The cytoplasm is surrounded by a cell envelope comprising the cytoplasmic membrane; the periplasm, including the peptidoglycan layer; and the outer membrane. The peptidoglycan layer, which is covalently bound to the outer membrane by lipoproteins, is an elastic mesh made up of glycan chains cross-linked by peptide strands (4). In E. coli, osmoregulated protein channels in the outer membrane and pores in the peptidoglycan meshwork render the cell wall permeable to water and to small ions and solutes up to ∼600 Da in mass (5). Estimates of the E. coli periplasmic thickness vary from 10 to 50 nm (6,7). Diffusion of green fluorescent protein (GFP) in the periplasm has been studied in ideal growth conditions (8), but changes in diffusion as a function of osmolality of growth or of sudden osmotic upshift (plasmolysis) have not been addressed.
The amount of periplasmic water and the fluidity of the periplasm versus growth osmolality are closely related to the mechanism by which a bacterial cell responds to the stress of low or high external osmolality. In normal growth conditions, the cytoplasm contains a high concentration of nucleic acid polyanions, primarily the ribosomal RNA. The free K+ counterions required to compensate the high negative phosphate charge provide the largest contribution to the cytoplasmic osmolality. As a result, the cytoplasmic osmotic pressure (Πcyto) exceeds that of the surrounding medium (Πout) (9). The resulting differential turgor pressure, ΔΠ = Πcyto – Πout, can be as large as 3–5 atm (3). The cytoplasmic membrane itself cannot support such a large pressure drop. Instead, the internal pressure is presumably contained by the elastic peptidoglycan layer, which stretches beyond its unstressed surface area until the mechanical restoring force balances the osmotic pressure difference.
There are two different osmotic-mechanical models detailing how the pressure drop across the cell envelope occurs. In the first model (1), the cytoplasmic membrane is either pressed against the peptidoglycan layer or separated from the peptidoglycan but mechanically supported by a rigid, inelastic gel. Alternatively, the cytoplasmic membrane might be mechanically coupled to the peptidoglycan layer by a large number of protein complexes that span the space between. In either event, the pressure drop would occur across a single mechanical unit comprising the cytoplasmic membrane, the periplasm and peptidoglycan, and the outer membrane. In the second model (3), the periplasmic space is a dynamic, osmotically active fluid that can change its osmotic pressure (Πperi) by adjusting water content and volume in response to different osmotic conditions. Here, the pressure drop must occur primarily across the thin peptidoglycan layer itself. A corollary is that there can be little or no pressure differential across the cytoplasmic membrane, which would lie unsupported between the cytoplasm and the periplasm, both of which are fluid (Πperi ≈ Πcyto > Πout). This second model thus requires a biochemical feedback mechanism by which the periplasm and cytoplasm are maintained in close osmotic balance. Earlier content measurements within the periplasm and cytoplasm of K-12 E. coli (3) were consistent with the second model.
Here, we use GFP diffusion as a probe of periplasmic fluidity for E. coli in different growth media and in different conditions of osmotic stress. The method is fluorescence recovery after photobleaching (FRAP) (10–12), using GFP exported to the periplasm via the Tat (twin-arginine translocase) system (13). As the growth osmolality increases from 0.14 to 1.02 Osm, the mean periplasmic GFP diffusion coefficient <Dperi> increases by a factor of 2. This is comparable to the increase in periplasmic water content relative to biopolymer content measured earlier for the same range of growth osmolalities (3). This result supports the second osmotic-mechanical model, under the reasonable assumption that greater water content enhances protein diffusion. In all conditions studied, the fluidity of the periplasm is comparable to that of the cytoplasm, which further argues against the notion that the periplasm is solidlike or like a stiff gel.
Extraction of accurate diffusion coefficients from FRAP experiments on a variety of periplasmic spatial distributions required us to carry out Brownian dynamics (BD) simulations using model geometries. We studied cytoplasmic models with one or two endcaps, normal periplasmic models, and periplasmic models including the end-cap plasmolysis spaces observed after rapid osmotic upshift. Based on the BD results, we provide formulae relating Dcyto and Dperi to readily measurable experimental fluorescence intensities. These should prove useful in future studies of diffusion in rod-shaped bacterial cells.
Materials and Methods
Bacterial strain and sample preparation
We studied the E. coli K-12 strain MG1655. Cytoplasmic GFPmut2 was expressed using the lac promoter on the plasmid pMGS053. Repression of the lac promoter was maintained by expressing LacI from a second plasmid pREP4 (Qiagen, Valencia, CA). GFP diffusion with this system was described in our previous work (11).
The plasmid expressing periplasmic GFP was created by amplifying the torA::gfpmut3∗ gene from the pJDT1 plasmid (13) using the forward polymerase chain reaction primer (TACAAGctagaAGCAGGAGGAATTCACCATG) and the reverse polymerase chain reaction primer (TGCGACctcgagAGCTTATTTGTATAGTTCATC) and cleaving the gene with the restriction enzymes, XbaI and XhoI. The gene was ligated into the pASK-IBA3plus plasmid (IBA, Göttingen, Germany), which has a tetracycline-inducible promoter, ampicillin resistance, and a multiple cloning site that was cleaved by the same restriction enzymes. The gene-containing region (1100 bp) of the resulting plasmid, pJW1, was sequenced by the University of Wisconsin Biotechnology Center. The TorA (trimethylamine N-oxide reductase) signal sequence for the twin-arginine translocase (TAT) pathway is 39 amino acids long; four additional amino acids from the mature TorA protein are used to link the signal sequence to the N-terminus of GFP-Mut3∗. The signal peptide is cleaved before being released into the periplasm, as shown by Robinson and co-workers (14).
All cells were grown at 30°C in EZ-rich defined medium (EZRDM, here referred to as complete medium) (MOPS-buffered medium (M2130, Teknova, Hollister, CA), nucleotide supplements (M2103, Teknova), amino acid supplements (M2104, Teknova), with 0.2% glucose and 1.32 mM K2HPO4) described by Neidhardt (15) or MBM (MOPS-buffered medium with 0.2% glucose and 1.32 mM K2HPO4, here called minimal medium). The doubling times in complete medium and minimal medium, respectively, are 50 min and 109 min at 0.28 Osm. Osmolality was adjusted by altering the concentration of sodium chloride. Osmolality of the first batches of media were measured using a vapor pressure osmometer (Wescor, Logan, Utah). Subsequent batches of media were made in the same way but not measured. Cells that were hyperosmotically shocked were resuspended into MBM-RB (MBM that lacked K+ and glucose) containing sodium chloride to a final osmolality of 0.65 Osm.
Cytoplasmic GFP expression was induced with 0.2 mM isopropyl-β-D-thiogalactopyranoside for 45 min, then resuspended in fresh medium without isopropyl-β-D-thiogalactopyranoside immediately before plating and imaging. These cells were grown in 0.1 mg/mL ampicillin and 0.1 mg/mL kanamycin. Periplasmic GFP expression was induced with anyhydrotetracycline for a period depending on the osmolality of growth, after which expression was stopped and the cells were allowed to grow and export for a postinduction period that also depended on the osmolality of growth (Table S1 in the Supporting Material). These cells were grown in 0.2 mg/mL ampicillin.
Significant effort was made to ensure that the periplasmic GFP was indeed in the periplasm and freely mobile. Computer modeling and membrane permeabilization microscopy studies were used to gain an understanding of how much fluorescence signal came from the periplasm versus the cytoplasm. These tests (see Fig. S1, Fig. S2, and Fig. S3) lead us to estimate that in the worst case, 10% of the GFP remains in the cytoplasm for cells grown in 0.28 or 0.14 Osm complete medium, and 20% of the GFP remains in the cytoplasm for cells grown in 1.02 Osm complete medium or 0.28 Osm minimal medium. In most cases, we expect <5% cytoplasmic GFP.
Fluorescence microscopy
E. coli cells were initially grown from a glycerol freezer stock inoculation overnight to stationary phase. They were then subcultured a few hours before the experiment, induced as necessary, and observed at midlog phase. The samples were transferred directly from a 30°C shaker to a temperature-controlled 30°C preheated imaging flow chamber (RC-20H, Warner Instruments, Hamden, CT) attached to the microscope stage. The closed chamber holds the sample between two 15-mm round coverslips spaced by 1 mm. The bottom coverslip is cleaned by sonication in acetone (30 min) and 1 M KOH (30 min) and coated with poly-L-lysine (0.01% solution for 20 min) to enhance cell adhesion. The flow chamber enables replenishment of fresh, aerated medium over the sample with exchange of the complete volume every 15 min during imaging, with constant temperature control at 30°C. Imaging was always carried out within 1 h of plating, during which time the cells show visible signs of growth with an approximated doubling time of 85 min.
All experiments were carried out on an Eclipse TE-300 inverted microscope (Nikon, Melville, NY) equipped with a Nikon PlanFluor 100×, 1.3 NA, oil immersion objective. The emission filter used to observe GFP was a HQ510/20M (Chroma, Bellows Falls, VT). After exiting the microscope, fluorescence enters a box containing a beam-magnifying telescope before focusing on the camera chip. Each 16 μm × 16 μm camera pixel corresponds to 60 nm × 60 nm at the sample. The camera is an iXon 897 back-illuminated emccd (Andor, Belfast, Northern Ireland). The effective axial diffusion coefficient Dperi of periplasmic GFP was measured by FRAP, as described in detail previously for cytoplasmic GFP (10). The bleach laser at 488 nm is focused on one end of the cell for 45 ms (Ar+ laser, beam size 0.9 μm full width at half-maximum (FWHM), peak intensity 40 kW/cm2). The subsequent recovery of the spatial distribution of periplasmic GFP across the entire cell was monitored with a less intense probe beam at 488 nm (25 μm FWHM, peak intensity 30 W/cm2). The frame duration was 26.7 ms, and recovery was monitored for 100–150 frames (2.7–4.0 s) after the bleach pulse. FRAP was not performed on cells exhibiting visible septation.
We estimate the amount of active GFP in the cell using calculations that take into account the photophysical characteristics of GFP, laser intensity, and the optical characteristics of our microscope and camera. Images of cells without any prior photobleaching indicate that we have between 103 and 104 active GFP molecules in the brightest periplasmic GFP expressing cells. Using the water content results from Cayley and co-workers (3), the corresponding periplasmic GFP concentration is 10–100 μmol/L water accessible volume.
Brownian dynamics simulations
We model the E. coli cytoplasm as a spherocylinder with a cylinder of length L and radius R, capped by a hemisphere of the same radius on each end. The model of the periplasm has a second spherocylindrical boundary inset from the first by the periplasmic thickness, d. We follow the BD algorithm described by Northrup et al. (16). Many particles move inside the simulation region independently. To simulate photobleaching, the initial distribution of particles within the cytoplasm or periplasm is not uniform along the long axis of the cell. In most cases, particles are distributed randomly in one half of the cell, whereas the other half begins with no particles. However, several different initial distributions (e.g., linear gradients, partitioning the bleach to less or more than one-half of the cell, or placing some fraction of particles within the bleached region) were tested and found not to have a large impact on the final results. The particles were then allowed to move according to the BD equation. No-flux (reflecting) boundary conditions on all boundaries are simulated by rejecting those steps that move a particle outside the simulation volume and taking another step until the particle remains inside. At each time interval, particles are binned along the axial coordinate, z, to obtain an axial spatial distribution that corresponds to the one-dimensional fluorescence intensity distribution I(z). The distribution is numerically analyzed as a sum of Fourier cosine modes. As in experiment, a plot of the first cosine mode amplitude versus time exhibits single-exponential recovery with rate constant k (Fig. S4 b). For the simulations, k is compared to the known D to find the best effective length, Leff:
| (1) |
Equation 1 is analogous to the exact solution of the problem of diffusion within a truncated cylinder, but with the effective length, Leff, chosen to obtain the correct value of D for the cylinder plus endcaps. The formulae for the best Leff are given in the Results section.
For diffusion within the periplasm of cells that have been plasmolyzed, the simulation boundaries are quite different. After plasmolysis, the one or two endcap plasmolysis spaces often form more than half the total periplasmic volume (see Fig. 4 a). The model geometric volume is the union of a thin, cylindrical shell of constant radius, R, length, L, and thickness, d, with one or two endcap plasmolysis spaces. The model geometry for a plasmolysis space is a half spheroid Vspd added to (convex plasmolysis space) or subtracted from (concave plasmolysis space) the hemispherical volume of the endcap Vhms (Fig. S5 a). Other plasmolysis space model shapes, such as a flat boundary or a hemispherical boundary, were tested and found not to change the results for the same total volume of the plasmolysis space. PS1 always designates the bleached plasmolysis space, and PS2 only exists in the case of two endcap plasmolysis spaces. In the simulations, the range of plasmolysis space volumes, (Vspd + Vhms) for a convex plasmolysis space or (Vhms − Vspd) for a concave plasmolysis space, corresponds in real space to 0.125 to 0.66 μm3, assuming that the cell has a 0.5-μm radius. The range of total, tip-to-tip cell lengths (Ltot) corresponds to 2.7–5.5 μm.
Figure 4.
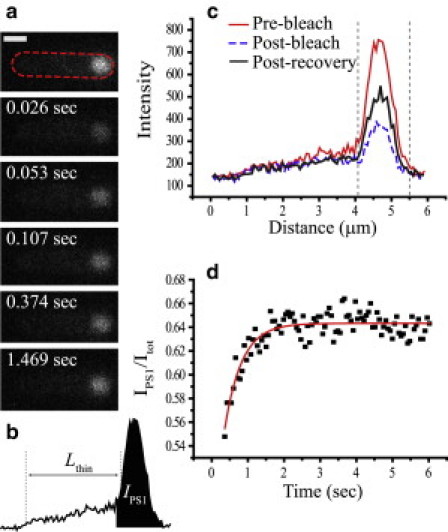
FRAP experiment on a cell hyperosmotically shocked from 280 mOsm to 650 mOsm and exhibiting one end-cap plasmolysis space. (a) Time series of images during FRAP. The dashed line outlines the periphery of the cell. (b) Lthin, and IPS1 are shown. Lthin extends from the inner half-maximum height of the unplasmolyzed end of the cell to the half-maximum height of the peak due to the plasmolysis space. Itot is not shown but is the integrated intensity under the profile. (c) Axial profile of the cell before bleach, immediately after bleach, and after total recovery. The region within the dashed gray vertical lines corresponds to IPS1. (d) IPS1(t)/Itot(t) and least-squares fit to a single exponential recovery. Scale bar, 1 μm.
In these cases, periplasmic protein diffusion can no longer be treated in terms of small endcap perturbations on the closed-form solutions of the simple cylindrical problem. The initial bleaching distribution was tested as it was for the unplasmolyzed simulations and was shown not to change the results. Therefore, the simplest initial distribution (all particles start uniformly in one-half of the axial length of the cell) was used for most simulations. Finally, by carrying out BD simulations with varying model geometries (variable d, L, and plasmolysis space volumes), we discovered, by trial and error, phenomenological equations (Eqs. 4 and 5 below) that make it possible to convert readily measured quantities to a diffusion coefficient with reasonable accuracy.
All other details regarding BD simulations can be found in the Supporting Material (Fig. S4, Fig. S5, Fig. S6, and Fig. S7, and Table S2).
Results
Periplasmic GFP spatial distributions versus osmotic conditions
Fluorescence images of periplasmic GFP for cells grown in minimal medium versus complete medium, and at different osmotic conditions, exhibit striking differences (Fig. 1). Cells grown in complete medium are longer and wider than cells grown in minimal medium. At high growth osmolality in complete medium and at all growth osmolalities in minimal medium, we consistently observed small regions of higher intensity at the end-cap tips. We attribute this to increased periplasmic volume at the end-caps rather than localized binding (17). FRAP experiments indicate that the high-intensity tips recover their intensity after photobleaching on the same timescale as the rest of the periplasm. Such bright tips were consistently absent for cells grown in complete medium at low to normal growth osmolality. A corresponding slight flattening of the cytoplasmic membrane at the cell poles would not be detected in cytoplasmic GFP images or any white light microscopy. The increased periplasmic end-cap volume may be a general property of cells with a slower growth rate or lower turgor pressure. In addition, under all growth conditions, the periplasmic GFP intensity varies significantly by some 30% around the perimeter, as if the thickness of the entire periplasm varies somewhat or GFP concentrates in some locations.
Figure 1.
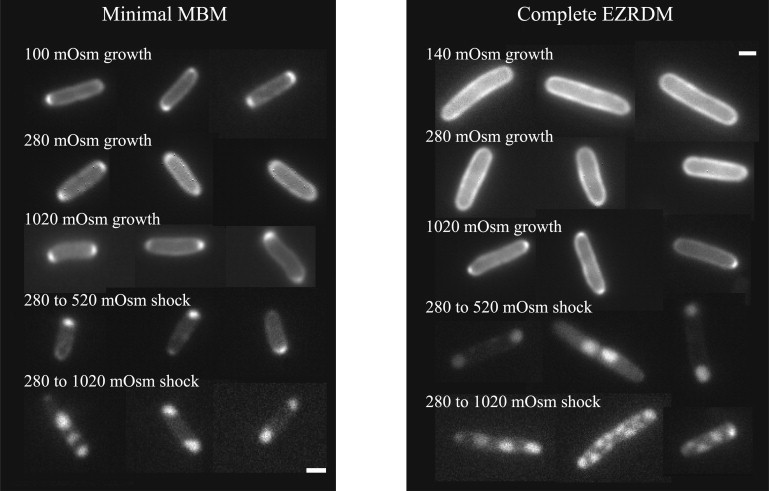
Representative fluorescence images of periplasmic GFP under the various growth and upshift conditions shown. Scale bars, 1 μm.
After sudden osmotic upshift, the cytoplasm loses water to balance the osmotic pressure inside and outside the cell. Periplasmic GFP imaging is a more sensitive probe of the size and shape of the resulting visible plasmolysis spaces than is cytoplasmic GFP imaging or any white-light technique. We observed significant differences between cells grown in minimal or complete medium and subjected to equivalent osmotic upshifts (Fig. 1). For upshift from 280 to 520 mOsm after growth in either medium, plasmolysis spaces occurred most often at the end-caps. The plasmolysis spaces were much smaller for cells grown in minimal medium, but these cells are also shorter on average. It is apparent that cells grown in the different media are giving up a similar fractional cytoplasmic volume for the same osmotic upshift. After osmotic upshift from 280 to 1020 mOsm, the cells grown in complete medium, which are longer, often developed multiple plasmolysis spaces along the flank of the cell, whereas the cells grown in minimal medium almost always developed end-cap plasmolysis spaces only.
Cytoplasmic and periplasmic GFP diffusion for cells grown in complete medium
The best values of Leff in spherocylindrical geometries are given by simple formulae based on approximate analytical solutions to the diffusion equation with appropriate boundary conditions (I. Shkel, unpublished). For a cytoplasmic GFP spatial distribution with one or two end-caps, the best effective lengths are Leff = L + 2R/3 and Leff = L + 4R/3, respectively. For a periplasmic GFP spatial distribution with two end-caps, we find Leff = L + 2R. These same formulae are in quantitative agreement with the results of the BD simulations (Table S2). For either the periplasmic or cytoplasmic case with two end-caps, Leff is well approximated from experimental data as the distance between the positions of half-maximum height (FWHM) at the ends of the axial fluorescence profile.
FRAP experiments were performed on cells containing cytoplasmic GFP and cells containing periplasmic GFP, grown in both cases in complete medium at 140 mOsm, 280 mOsm, and 1020 mOsm. We chose to use complete medium for these experiments rather than minimal medium, due to the difficulty of obtaining complete export of GFP to the periplasm in minimal medium at high osmolality. The periplasmic GFP diffusion data were measured and analyzed in the same fashion as described earlier for diffusion in the cytoplasm (10). An example is shown in Fig. 2. The fluorescence intensity is collapsed into a one-dimensional axial intensity profile that is Fourier-analyzed for each camera frame. The decay of the first cosine mode, defined over the interval x = 0–L (the length of the cylindrical, nontapering part of the intensity profile), is exponential (Fig. 2 c, Fig. S8 b, and Fig. S9 b). The effective axial diffusion coefficient Dcyto is obtained from the decay rate k as in Eq. 1, which can be rewritten as
| (2) |
Leff is well approximated as the FWHM of the axial intensity profile before photobleaching.
Figure 2.
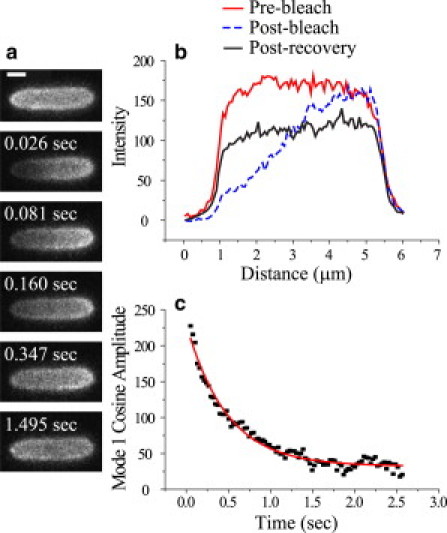
FRAP experiment on a cell grown at 280 mOsm. (a) Time series of images during FRAP. (b) Axial profile of cell before bleach, immediately after bleach, and after recovery. (c) Fourier cosine mode 1 amplitude versus time after bleach and the least-squares fit to a single-exponential decay. Scale bar, 1 μm.
The results for periplasmic and cytoplasmic diffusion coefficients for cells grown in complete medium at varying osmolality are shown as histograms in Fig. 3, a–c, and summarized in Table 1. In matched growth conditions, <Dperi> is smaller than <Dcyto> by a factor that decreases from 3.5 at 0.14 Osm to 1.4 at 1.02 Osm. At all growth osmolalities, diffusion of GFP in the periplasm is greatly hindered compared to that in buffer solution (D0 = 87 μm2 s−1). In all cases, complete FRAP was observed. There is no evidence of physical compartmentalization within the periplasm.
Figure 3.
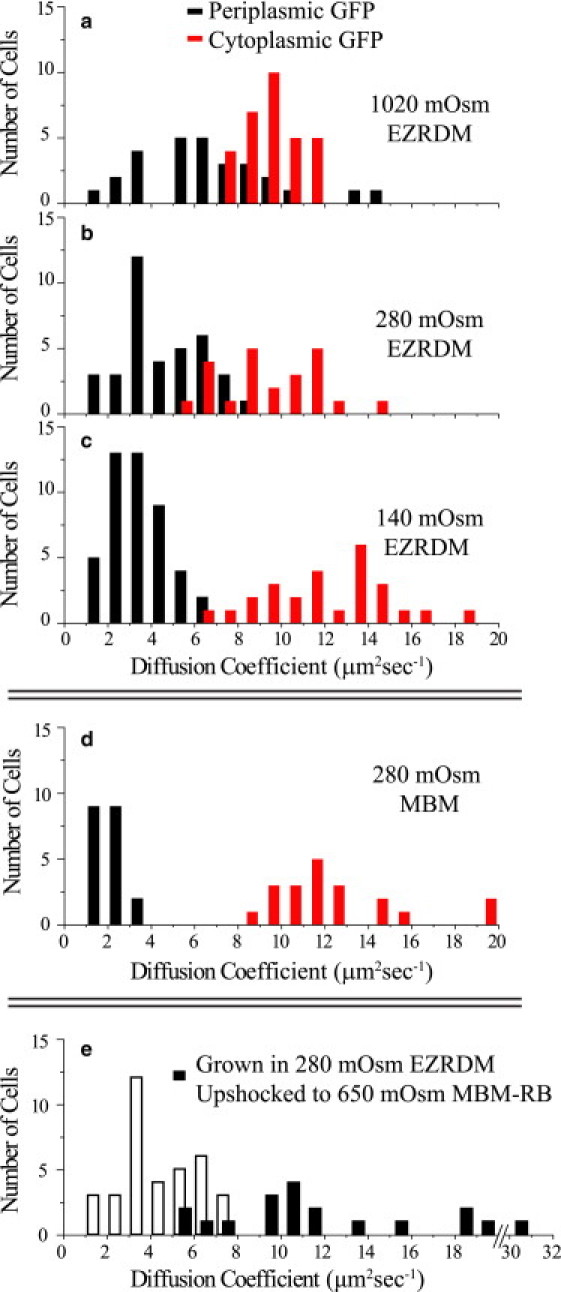
Histograms of cytoplasmic and periplasmic GFP diffusion coefficients measured for cells grown in (a) 1020 mOsm EZRDM, (b) 280 mOsm EZRDM, (c) 140 mOsm EZRDM, (d) 280 mOsm MBM, and (e) 280 mOsm EZRDM and hyperosmotically shocked to 650 mOsm in MBM resuspension buffer. In e, black bars represent periplasmic GFP diffusion coefficients, white bars are a repeat of the 280-mOsm EZRDM data in b, for comparison.
Table 1.
Diffusion of periplasmic and cytoplasmic GFP in E. coli under different growth and osmotic conditions
| Medium (mOsm) | <Dperi>∗ (μm2 s−1) | n | <Dcyto>∗ (μm2 s−1) | n |
|---|---|---|---|---|
| EZRDM (140) | 3.4 ± 1.2 | 46 | 12.1 ± 2.9 | 26 |
| EZRDM (280) | 4.7 ± 1.8 | 37 | 9.5 ± 2.3 | 23 |
| EZRDM (1020) | 6.6 ± 3.1 | 28 | 9.5 ± 1.2 | 31 |
| LB (240) | — | — | 6.1 ± 2.4† | 39† |
| EZRDM (280→650) | 12.3 ± 6.0 | 19 | — | |
| MBM (280) | 2.2 ± 0.6 | 20 | 12.3 ± 3.013.8 ± 3.8† | 20106† |
Periplasmic or cytoplasmic GFP effective axial diffusion coefficient expressed as the mean ± 1 SD of n individual measurements at 30°C, except in the cases noted below.
Data from Konopka et al. (10,11), measured at 25°C.
The uncertainty in Dperi for each cell comes from a variety of sources. The decay rate k of the first cosine mode amplitude is fit with ±15% uncertainty. The measured effective length of the cell, Leff, is accurate to ±5%, which contributes ±10% uncertainty in Dperi due to its Leff 2 dependence. There is also error associated with how well the real cell shape matches the model spherocylindrical shape. The images themselves suggest that this error is small for cells exhibiting fairly constant brightness around the cell periphery, i.e., cells grown in 280 or 140 mOsm (Fig. 1). However, cells grown at 1.02 Osm exhibit bright end-cap tips as well as an increased probability of slight curvature of the cell body. According to BD simulations (described in the Supporting Material), the bright tips due to increased periplasm thickness would cause us to systematically underestimate Dperi . Overall, we estimate that values of Dperi for unplasmolyzed cells are accurate to ±30%. Values of Dperi for cells exhibiting bright tips (grown at 1.02 Osm) are likely systematically too small by 20–30%. Even so, there is a large degree of cell-to-cell heterogeneity in Dperi and Dcyto.
Comparison of GFP diffusion for cells grown in different media
Diffusion of both cytoplasmic and periplasmic GFP depends on the growth medium, as well as on osmotic conditions. MBM is a minimal, defined medium in which the optimal doubling time is 109 min at 30°C. When nucleotides and amino acids are added to MBM to make complete medium, the doubling time decreases to 50 min at 30°C, which is similar to the doubling time in the commonly used LB medium (Lennox L). Cells grown in complete medium and minimal medium exhibit significantly different GFP diffusion coefficients (see Table 1 and Fig. 3, c and d). <Dperi> is two times larger for cells grown in complete medium (4.7 μm2 s−1) than for those grown in minimal medium (2.2 μm2 s−1). In contrast, <Dcyto> is somewhat smaller for cells grown in complete medium (9.5 μm2 s−1) than for those grown in minimal medium (12.3 μm2 s−1). The ratio of average cytoplasmic to periplasmic diffusion in minimal medium, <Dcyto>/<Dperi> = 5.6, is much larger than that in complete medium (<Dcyto>/<Dperi> = 2.0). We previously published the value <Dcyto> = 13.8 μm2 s−1 for cells grown in minimal medium (11), which is 12% larger than the value presented here. New data were obtained here to ensure the best possible comparisons among different conditions.
Periplasmic GFP diffusion in plasmolyzed cells
For cells grown in complete medium and osmotically upshifted from 0.28 Osm to 0.65 Osm, plasmolysis spaces arise due to transfer of water from the cytoplasm to the periplasm and the surrounding medium. At this level of osmotic shock, plasmolysis spaces usually occur at one end-cap only (∼70%) and occasionally occur at both end-caps (∼5%). The remaining cells have one midcell (lateral) plasmolysis space or a combination of end-cap and midcell plasmolysis spaces. We carried out FRAP measurements only on cells having one or two visible end-cap plasmolysis spaces. Cells with midcell plasmolysis spaces are not amenable to our analysis and were not analyzed quantitatively. Based on BD simulations, we developed a different phenomenological analysis procedure for cells with one versus those with two end-cap plasmolysis spaces. Complete recovery of the prebleach intensity distribution occurred in both cases.
Cells with one end-cap plasmolysis space
For cells with one plasmolysis space, only a fraction of the intensity within the plasmolysis space (PS1) was photobleached, whereas the other half of the cell was left unbleached. The simulations show that the fraction of the total fluorescence intensity in PS1 then recovers exponentially versus time:
| (3) |
Here, Itot is the total fluorescence intensity associated with the cell, IPS1 is the intensity within the plasmolysis space (Fig. 4 b), and A < 0. Accordingly, we fit the data to Eq. 3 in the least-squares sense, with A, k, and C as adjustable parameters. An example of a recovery and its fit is shown in Fig. 4 d. To relate the experimental value of k and Lthin (the distance from the inner half-maximum height of the plasmolysis space peak to the half-maximum of the unplasmolyzed end of the cell in the one-dimensional cell profile (Fig. 4 b)) to the periplasmic diffusion coefficient, we use the phenomenological correlation obtained from the BD simulations (Fig. S7 a):
| (4) |
Dperi denotes the effective axial diffusion coefficient through the thin, cylindrical periplasmic volume. VPS1/Vtot is a volume ratio that we equate to the intensity ratio of the two volumes under the assumption of constant GFP concentration throughout the periplasm. It is much more accurate to measure the integrated fluorescence intensity of each volume than to estimate volumes directly from the diffraction-limited images.
Cells with two end-cap plasmolysis spaces
For cells with two end-cap plasmolysis spaces (called PS1 and PS2), we photobleached PS1 almost entirely, leaving PS2 intact. The BD simulations find single-exponential recovery of the quantity IPS1(t)/Itot(t), as in Eq. 3. Accordingly, we again fit the data to Eq. 3 in the least-squares sense, with A, k, and C as adjustable parameters. An example of a recovery and its fit is shown in Fig. S10 d. For the two-plasmolysis-space case, the BD simulations (Fig. S7 b) fit the phenomenological equation
| (5) |
Here, Dperi again denotes the effective axial diffusion coefficient through the thin, cylindrical periplasmic volume (not the larger plasmolysis space volume). VPS1/Vthin and VPS2/Vthin are volume ratios that are assumed equivalent to their respective intensity ratios. IPS1 and IPS2 are the integrated intensities under their respective peaks in the intensity profile before photobleaching. Lthin is measured from the one-dimensional intensity profile as the distance between the inner half-maximum height of the PS1 peak to the inner half-maximum height of the PS2 peak. Ithin is measured over the area of the intensity profile created by extending the average height of the middle region along Lthin (Fig. S10 b).
Distribution of Dperi among plasmolyzed cells
Fig. 3 e compares the distribution of Dperi for cells grown in 0.28 Osm complete medium and plasmolyzed to 0.65 Osm with that of unshocked cells grown in 0.28 Osm complete medium. Plasmolysis increases <Dperi> by a factor of 2.6, from 4.7 ± 1.8 μm2 s−1 to 12.3 ± 6.0 μm2 s−1 (±1 SD). The latter value is comparable to the cytoplasmic value <Dcyto> in unshocked cells (Table 1). <Dperi> for 10 of the 11 cells measured that had one plasmolysis space (12.2 ± 5.2 μm2 s−1) was not significantly different from that of the eight cells measured that had two plasmolysis spaces (10.1 ± 2.3 μm2 s−1), but Dperi for cells with one plasmolysis space exhibited a much larger spread. One cell with a single plasmolysis space had a much higher diffusion constant (30.7 μm2 s−1). We found no obvious correlation of Dperi with the absolute volume within plasmolysis spaces, the length of the cell, the fraction of periplasmic volume in a plasmolysis space, or the total periplasmic GFP intensity. We estimate that the combination of the fitting error in the exponential recovery rate k and the uncertainty in the correlation from the BD simulations allows us to determine the effective Dperi for plasmolyzed cells to an accuracy of ±30% at worst. This error includes propagated uncertainty of the model correlation (<10%), the measured decay time constant (<10% for two plasmolysis spaces and <20% for one plasmolysis space), the measured length (<5%), and the measured intensity ratios (<5%).
Plasmolysis increases the volume of water in the periplasm and would be expected to enhance GFP diffusion there. It is reasonable to expect <Dperi> to scale inversely with the volume of free periplasmic water before and after plasmolysis (3). In rough accord, the plasmolysis space(s) account for 60–70% of the total periplasmic volume at this level of upshock (from 0.28 to 0.65 Osm), as judged by the fraction of total fluorescence intensity within the plasmolysis spaces versus the thin periplasmic space. We simulated the image of one upshocked cell by iteratively changing the volume of the plasmolysis spaces and the width, d, of the thin periplasmic region until the final PS-fluorescence-convolved image matched the experimental image. The simulated image corresponded to d = 35 nm. If we assume that the thickness was the same before upshock, plasmolysis caused a 2.9-fold increase in volume, i.e., the plasmolysis spaces occupy 75% of the periplasmic volume.
It is important to note that we find that in all osmotic conditions measured, including upshocked cells that have not been allowed to adapt to the hyperosmotic conditions, the spatial distribution of periplasmic GFP in each single cell exhibits complete, homogeneous recovery in FRAP experiments. The value of Dperi varies significantly from cell to cell in a manner reminiscent of the cell-to-cell heterogeneity observed for Dcyto. There is no evidence of physical compartmentalization of the periplasm or of periseptal annuli (18,19). The periplasm is at all times fluid from the perspective of GFP. If the periplasm is a gel, that gel is permeable to GFP in all conditions (1).
Discussion
Overview of osmotic effects
In many natural environments, cells must adapt to gradual or sudden changes in external osmotic pressure (20). Osmoregulation is vital to the ability of bacteria to maintain turgor pressure and growth without lysing or collapsing as external conditions change. For E. coli, a rapid osmotic upshift with a small solute like NaCl that enters the periplasm but not the cytoplasm (plasmolysis) removes water from the cytoplasm. This concentrates all cytoplasmic solutes and increases the biopolymer volume fraction, simultaneously adding water to the periplasm and hence diluting the volume fraction of periplasmic proteins (3). Plasmolysis causes the cytoplasmic membrane to wrinkle or cave in on itself. In the presence of nutrients and K+, E. coli adapt readily to an osmotic upshift. To restore cytoplasmic water and turgor, the initial response is the import of K+ and synthesis and/or transport of an equivalent molar amount of anionic solutes (synthesis of glutamate and transport of MOPS in MOPS-buffered medium) (21,22). In MBM, a significant cytoplasmic concentration of the disaccharide trehalose is synthesized. An increase in the cytoplasmic amount of these solutes allows the cytoplasm to take up water and to restore turgor and the normal spherocylindrical shape as the cell restores growth. However, cells growing at high osmolality in MBM have a smaller amount of cytoplasmic water and a larger amount of periplasmic water per unit of cell dry weight than do cells at the optimal growth osmolality of 0.28 Osm (3).
Comparison with previous periplasmic protein diffusion results
There are two previous studies of diffusion in the periplasm of bacterial cells. In the earliest work that we know of, Brass et al. (23) studied diffusion of proteins of varying size in the periplasm of E. coli. These cells (strain MM106) were grown in LB (Lennox L) at 37°C, treated with cephalexin, subjected to Ca+2 treatment at 0°C to allow fluorescently labeled proteins to enter the periplasm, and stored at 0°C before imaging. All proteins exhibited a similar, very small diffusion coefficient of ∼0.009 μm2 s−1, some 400-fold smaller than our value of <Dperi> = 4.7 μm2 s−1 in complete medium at 0.28 Osm under roughly matching growth conditions. The conclusion was that the periplasm was a viscous gel impeding facile diffusion of all proteins.
The advent of genetically encoded fluorescent labels and the discovery of the twin-arginine translocase pathway enabled Mullineaux et al. (8) to measure diffusion of GFP exported to the periplasm of E. coli (MC4100AR) grown in Luria-Bertani medium at 37°C. The measurements were carried out at room temperature. The mean diffusion coefficient was <Dperi> = 2.6 ± 1.2 μm2 s−1 (mean ± 1 SD), much higher than that of Brass (23) and similar to our value of 4.7 ± 1.8 μm2 s−1 for cells grown in complete medium at 30°C and measured at 30°C. One possibly significant difference from this work is that Mullineaux treated the cells with cephalexin to yield long cells that facilitate analysis of the diffusion coefficient. Our analysis method enables us to obtain diffusion coefficients accurate to ±30% from untreated, normal-length cells. The large difference between the results of Brass (23) on the one hand, and those of Mullineaux (8) and this work on the other, is likely due to effects of the Ca+2 treatment necessary to permeabilize cells in the early work. This procedure evidently altered the physical nature of the periplasm, as suggested previously (8).
Microviscosity, binding, crowding, and confinement effects on diffusion
The ratio D0/<Dperi> of the GFP diffusion coefficient in buffer (D0 = 87 μm2 s−1) to the mean effective GFP diffusion coefficient in the periplasm is the factor by which the periplasmic medium reduces the mobility of GFP. This reduction in diffusion could be caused by macromolecular crowding, transient confinement, binding, an increase in microviscosity, enhanced hydrodynamic effects, or a combination of these (24). In the E. coli periplasm, D0/<Dperi> varies from 13 to 40, depending on growth conditions (Table 1). For cytoplasmic GFP, D0/<Dcyto> varies from 6 to 14. For periplasmic GFP, the relative dispersion in diffusion coefficient from cell to cell is some 25–45% as measured by σDperi/<Dperi>, which is even larger than that of cytoplasmic GFP. In addition, GFP diffusion in both E. coli subvolumes is significantly slower than in the cytoplasm of eukaryotic cells (D0/<Deuk> = 3.2) (25), presumably in part because the biopolymer content in E. coli is not concentrated into organelles.
Crowding effects due to globular proteins may be more severe in the periplasm than in the cytoplasm, largely because the biopolymer mass of the periplasm is primarily composed of small, globular proteins that are efficient crowders of GFP diffusion. In contrast, in the cytoplasm, roughly half the biopolymer volume is due to ribosomes, which are so large that they do not greatly diminish the diffusion of small globular proteins (11). To illustrate how crowding might influence periplasmic diffusion, we cautiously borrow measurements of protein and water content from earlier work using different growth media (26) to calculate the mean biopolymer volume fraction of the periplasm <ϕperi>. These estimates (Supporting Material) yield <ϕperi> ∼ 0.21 for cells grown at 0.14 Osm and <ϕperi> ∼ 0.11 at 1.02 Osm. The estimated <ϕperi> decreases linearly with increasing growth osmolality.
Scaled particle theory (SPT) is a parameterized model of the diffusion of hard spheres among other hard-sphere crowders (27). In using SPT to model GFP diffusion in the cytoplasm (11), we found that for spheres of a single radius, R0, the choice of the step-size parameter Δr = 1.3R0 gave a dependence of the calculated ratio DGFP/D0 on biopolymer volume fraction, ϕ, that mimics diffusion data for self-crowded proteins in buffer quite well. Such a large value of Δr is evidently necessary to capture hydrodynamic effects, which are not explicitly included in the model. If we assume that all the protein mass of the periplasm comprises globular proteins of the same size as GFP, the same parameterization of SPT would predict D0/Dperi ∼ 5 at <ϕperi> = 0.21 (0.14 Osm growth in minimal medium) and D0/Dperi ∼ 2 at <ϕperi> = 0.11 (1.02 Osm growth in minimal medium). This suggests that crowding might account for the twofold relative increase in <Dperi> over the corresponding range of growth osmolality. Here, we emphasize relative trends, because protein and water content measurements were taken from other conditions.
However, the same crowding model cannot account for the large absolute decrease in GFP diffusion coefficient from solution to the periplasm. The experimental value of D0/Dperi is 40 for cells grown in minimal medium at 0.28 Osm (the same medium used for protein and water measurements (3)). There remains an order-of-magnitude discrepancy between the SPT estimate and experiment. A similar discrepancy between pure crowding theory and the diffusion of GFP in the cytoplasm of E. coli was observed in an earlier work (11). Therefore, we assume that crowding must be complemented by other effects that impede diffusion, such as increased microviscosity, transient binding, hydrodynamic effects, and confinement. At least for GFP, these effects appear to be stronger in the periplasm than in the cytoplasm.
We lack specific information about the microviscosity of the periplasmic fluid, transient binding of GFP to other proteins or to nondiffusing periplasmic elements, and possible confinement effects (24). Nonspecific, transient binding of GFP to less mobile periplasmic elements might well diminish mobility in the periplasm compared with buffer, as suggested for cytoplasmic diffusion in the simulations of Elcock and co-workers (28). Another possible effect is a type of transient confinement. Although the periplasm presumably lacks long biopolymers, it is a remarkably thin space. Diffusion could be impeded by the multitude of membrane proteins and protein complexes that protrude into the periplasmic space or by the semipermeable layer of peptidoglycan. In addition, much of the water in the periplasm is surface-bound water.
Connection to mechanical-osmotic models of the cell envelope
In complete medium, the trends in <Dcyto> and in <Dperi> versus increasing growth osmolality (Table 1 and Fig. 3, a–c) are opposite: <Dcyto> decreases, whereas <Dperi> increases. This is consistent with a picture in which the cytoplasm is losing water volume (relative to protein content) while the periplasm is gaining water volume (and therefore increasing in average thickness) as the osmolality of growth increases. Measurements of cytoplasmic and periplasmic water content performed by Cayley et al. (3), which were carried out for K-12 E. coli in minimal MBM suggested the same conclusion. In addition, our data indicate that the periplasm remains fluid under all osmotic conditions studied. A fluid periplasm whose thickness varies with growth osmolality is consistent with the second model described in the Introduction. In that model, the osmolality of a fluid periplasm is regulated to closely match that of the cytoplasm, and the bulk of the turgor pressure drops across the thin peptidoglycan layer (3). Recent structural information from cryoelectron tomography ((29) and S. Subramaniam, National Cancer Institute, personal communication, 2009) is also consistent with this picture. For cells grown in rich medium, the total periplasmic thickness varies from 30 ± 2 nm on the flank of the cell to 50–70 nm at the tips of the cell. The distance between the peptidoglycan layer and the outer membrane is ∼7 nm and appears quite uniform. This gap is consistent with the known structure of Braun lipoprotein (30), which forms helical bundles ∼8.3 nm long that connect the peptidoglycan layer to the outer membrane. The thickness data are also consistent with our interpretation of bright tips in the GFP fluorescence images as arising from increased thickness of the periplasm at the cell tips rather than enhanced binding to some membrane component.
In contrast, the gap from peptidoglycan layer to cytoplasmic membrane varies from ∼20 nm on the cell flank to as much as 40–60 nm at the tips. If protein complexes bind the cytoplasmic membrane to the peptidoglycan layer to form a single mechanical unit that supports this fragile membrane against 3–5 atm of turgor pressure (the first model described in the Introduction), they must be very large, vary in height from the flank of the cell to its tip, and occur very frequently in space. Although complexes that span the entire periplasmic thickness are known (31,32), the requirements of variable height and strong mechanical support are unlikely to be fulfilled.
Acknowledgments
The authors thank Dr. Robert Bucki of the Janmey lab at the University of Pennsylvania for their generous gift of the human antimicrobial peptide LL-37, Prof. Laszlo Csonka at Purdue University for the pJDT1 plasmid, Mr. Matthew Copeland in the Weibel lab at the University of Wisconsin for aiding with plasmid construction for pJW1, Dr. Sriram Subramaniam for sharing images, Manuel Ortega, an undergraduate summer researcher, and Dr. Michael Konopka for experimental guidance in the earliest stages of this work.
This work was supported by the National Science Foundation (grant CHE-0452375) and the National Institute of General Medical Science (grant R01GM086468).
Supporting Material
References
- 1.Koch A.L. The biophysics of the gram-negative periplasmic space. Crit. Rev. Microbiol. 1998;24:23–59. doi: 10.1080/10408419891294172. [DOI] [PubMed] [Google Scholar]
- 2.Kellenberger E. The “Bayer bridges” confronted with results from improved electron microscopy methods. Mol. Microbiol. 1990;4:697–705. doi: 10.1111/j.1365-2958.1990.tb00640.x. [DOI] [PubMed] [Google Scholar]
- 3.Cayley D.S., Guttman H.J., Record M.T., Jr. Biophysical characterization of changes in amounts and activity of Escherichia coli cell and compartment water and turgor pressure in response to osmotic stress. Biophys. J. 2000;78:1748–1764. doi: 10.1016/s0006-3495(00)76726-9. [DOI] [PMC free article] [PubMed] [Google Scholar]
- 4.Koch A.L., Woeste S. Elasticity of the sacculus of Escherichia coli. J. Bacteriol. 1992;174:4811–4819. doi: 10.1128/jb.174.14.4811-4819.1992. [DOI] [PMC free article] [PubMed] [Google Scholar]
- 5.Decad G.M., Nikaido H. Outer membrane of gram-negative bacteria. XII. Molecular-sieving function of cell wall. J. Bacteriol. 1976;128:325–336. doi: 10.1128/jb.128.1.325-336.1976. [DOI] [PMC free article] [PubMed] [Google Scholar]
- 6.Graham L.L., Harris R., Beveridge T.J. Freeze-substitution of gram-negative eubacteria: general cell morphology and envelope profiles. J. Bacteriol. 1991;173:1623–1633. doi: 10.1128/jb.173.5.1623-1633.1991. [DOI] [PMC free article] [PubMed] [Google Scholar]
- 7.Stock J.B., Rauch B., Roseman S. Periplasmic space in Salmonella typhimurium and Escherichia coli. J. Biol. Chem. 1977;252:7850–7861. [PubMed] [Google Scholar]
- 8.Mullineaux C.W., Nenninger A., Robinson C. Diffusion of green fluorescent protein in three cell environments in Escherichia coli. J. Bacteriol. 2006;188:3442–3448. doi: 10.1128/JB.188.10.3442-3448.2006. [DOI] [PMC free article] [PubMed] [Google Scholar]
- 9.Cayley S., Lewis B.A., Record M.T., Jr. Characterization of the cytoplasm of Escherichia coli K-12 as a function of external osmolarity. Implications for protein-DNA interactions in vivo. J. Mol. Biol. 1991;222:281–300. doi: 10.1016/0022-2836(91)90212-o. [DOI] [PubMed] [Google Scholar]
- 10.Konopka M.C., Shkel I.A., Weisshaar J.C. Crowding and confinement effects on protein diffusion in vivo. J. Bacteriol. 2006;188:6115–6123. doi: 10.1128/JB.01982-05. [DOI] [PMC free article] [PubMed] [Google Scholar]
- 11.Konopka M.C., Sochacki K.A., Bratton B.P., Shkel I.A., Record M.T., Weisshaar J.C. Cytoplasmic protein mobility in osmotically stressed Escherichia coli. J. Bacteriol. 2008;191:231–237. doi: 10.1128/JB.00536-08. [DOI] [PMC free article] [PubMed] [Google Scholar]
- 12.Elowitz M.B., Surette M.G., Leibler S. Protein mobility in the cytoplasm of Escherichia coli. J. Bacteriol. 1999;181:197–203. doi: 10.1128/jb.181.1.197-203.1999. [DOI] [PMC free article] [PubMed] [Google Scholar]
- 13.Thomas J.D., Daniel R.A., Robinson C. Export of active green fluorescent protein to the periplasm by the twin-arginine translocase (Tat) pathway in Escherichia coli. Mol. Microbiol. 2001;39:47–53. doi: 10.1046/j.1365-2958.2001.02253.x. [DOI] [PubMed] [Google Scholar]
- 14.Barrett C.M., Ray N., Bolhuis A. Quantitative export of a reporter protein, GFP, by the twin-arginine translocation pathway in Escherichia coli. Biochem. Biophys. Res. Commun. 2003;304:279–284. doi: 10.1016/s0006-291x(03)00583-7. [DOI] [PubMed] [Google Scholar]
- 15.Neidhardt F.C., Bloch P.L., Smith D.F. Culture medium for enterobacteria. J. Bacteriol. 1974;119:736–747. doi: 10.1128/jb.119.3.736-747.1974. [DOI] [PMC free article] [PubMed] [Google Scholar]
- 16.Northrup S., Allison S., McCammon J. Brownian dynamics simulation of diffusion influenced bimolecular reactions. J. Chem. Phys. 1984;80:1517–1524. [Google Scholar]
- 17.Santini C.L., Bernadac A., Wu L.F. Translocation of jellyfish green fluorescent protein via the Tat system of Escherichia coli and change of its periplasmic localization in response to osmotic up-shock. J. Biol. Chem. 2001;276:8159–8164. doi: 10.1074/jbc.C000833200. [DOI] [PubMed] [Google Scholar]
- 18.Foley M., Brass J.M., Rothfield L.I. Compartmentalization of the periplasm at cell division sites in Escherichia coli as shown by fluorescence photobleaching experiments. Mol. Microbiol. 1989;3:1329–1336. doi: 10.1111/j.1365-2958.1989.tb00114.x. [DOI] [PubMed] [Google Scholar]
- 19.Rothfield L.I., Cook W.R. Periseptal annuli: organelles involved in the bacterial cell division process. Microbiol. Sci. 1988;5:182–185. [PubMed] [Google Scholar]
- 20.Le Rudulier D., Strom A.R., Valentine R.C. Molecular biology of osmoregulation. Science. 1984;224:1064–1068. doi: 10.1126/science.224.4653.1064. [DOI] [PubMed] [Google Scholar]
- 21.Cayley S., Lewis B.A., Record M.T., Jr. Origins of the osmoprotective properties of betaine and proline in Escherichia coli K-12. J. Bacteriol. 1992;174:1586–1595. doi: 10.1128/jb.174.5.1586-1595.1992. [DOI] [PMC free article] [PubMed] [Google Scholar]
- 22.McLaggan D., Naprstek J., Epstein W. Interdependence of K+ and glutamate accumulation during osmotic adaptation of Escherichia coli. J. Biol. Chem. 1994;269:1911–1917. [PubMed] [Google Scholar]
- 23.Brass J.M., Higgins C.F., Garland P.B. Lateral diffusion of proteins in the periplasm of Escherichia coli. J. Bacteriol. 1986;165:787–795. doi: 10.1128/jb.165.3.787-795.1986. [DOI] [PMC free article] [PubMed] [Google Scholar]
- 24.Verkman A.S. Solute and macromolecule diffusion in cellular aqueous compartments. Trends Biochem. Sci. 2002;27:27–33. doi: 10.1016/s0968-0004(01)02003-5. [DOI] [PubMed] [Google Scholar]
- 25.Verkman A.S. Green fluorescent protein as a probe to study intracellular solute diffusion. Methods Enzymol. 1999;302:250–264. doi: 10.1016/s0076-6879(99)02024-8. [DOI] [PubMed] [Google Scholar]
- 26.Ames G.F., Prody C., Kustu S. Simple, rapid, and quantitative release of periplasmic proteins by chloroform. J. Bacteriol. 1984;160:1181–1183. doi: 10.1128/jb.160.3.1181-1183.1984. [DOI] [PMC free article] [PubMed] [Google Scholar]
- 27.Han J., Herzfeld J. Macromolecular diffusion in crowded solutions. Biophys. J. 1993;65:1155–1161. doi: 10.1016/S0006-3495(93)81145-7. [DOI] [PMC free article] [PubMed] [Google Scholar]
- 28.McGuffee S., Elcock A. Diffusion, crowding and protein stability in a dynamic molecular model of the bacterial cytoplasm. PloS Comput. Biol. 2010;6:e1000694. doi: 10.1371/journal.pcbi.1000694. [DOI] [PMC free article] [PubMed] [Google Scholar]
- 29.Zhang P., Khursigara C.M., Subramaniam S. Direct visualization of Escherichia coli chemotaxis receptor arrays using cryo-electron microscopy. Proc. Natl. Acad. Sci. USA. 2007;104:3777–3781. doi: 10.1073/pnas.0610106104. [DOI] [PMC free article] [PubMed] [Google Scholar]
- 30.Shu W., Liu J., Lu M. Core structure of the outer membrane lipoprotein from Escherichia coli at 1.9 Å resolution. J. Mol. Biol. 2000;299:1101–1112. doi: 10.1006/jmbi.2000.3776. [DOI] [PubMed] [Google Scholar]
- 31.Berg H.C. The rotary motor of bacterial flagella. Annu. Rev. Biochem. 2003;72:19–54. doi: 10.1146/annurev.biochem.72.121801.161737. [DOI] [PubMed] [Google Scholar]
- 32.Nikaido H. Molecular basis of bacterial outer membrane permeability revisited. Microbiol. Mol. Biol. Rev. 2003;67:593–656. doi: 10.1128/MMBR.67.4.593-656.2003. [DOI] [PMC free article] [PubMed] [Google Scholar]
Associated Data
This section collects any data citations, data availability statements, or supplementary materials included in this article.