

Abstract
Gene transcription requires a sequence of promoter state transitions, including chromatin remodeling, assembly of the transcription machinery, and clearance of the promoter by RNA polymerase. The rate-limiting steps in this sequence are regulated by transcriptional activators that bind at specific promoter elements. As the transition kinetics of individual promoters cannot be observed, the identity of the activator-controlled steps has remained a matter of speculation. In this study, we investigated promoter chromatin structure, and the intrinsic noise of expression over a wide range of expression values for the PHO5 gene of yeast. Interpretation of our results with regard to a stochastic model of promoter chromatin remodeling and gene expression suggests that the regulatory architecture of the gene expression process is measurably reflected in its intrinsic noise profile. Our chromatin structure and noise analyses indicate that the activator of PHO5 transcription stimulates the rates of promoter nucleosome disassembly, and assembly of the transcription machinery after nucleosome removal, but no other rates of the expression process.
Keywords: chromatin dynamics, expression noise, gene regulation, stochastic model
Introduction
Eukaryotic genes are regulated by transcriptional activators that bind at specific promoter sequences to activate transcription. To this end, activators contain two distinct domains that mediate DNA binding and activation, respectively (Green, 2005). While DNA binding domains are structurally defined, activation domains are random coils that stimulate transcription by recruitment of other factors to the promoter. Analysis of the activation mechanism has therefore largely been focused on the identity of the factors that interact with activation domains.
However, this approach suffers from serious limitations. First, activator interactions lack specificity (Ma and Ptashne, 1987). Consequently, the physiological significance of activator interactions is difficult to prove (Fan et al, 2006), and many factors have been identified as recruitment targets (Green, 2005). Potential targets include histone-modifying enzymes, chromatin remodelers, the TATA box binding protein (TBP) and its associated factors (TAFs), Mediator, and many more (Green, 2005). Second, for some recruitment targets, Mediator for instance, the mode of action remains unclear (Kornberg, 2005). For others, the mechanistic link between biochemical activity and transcription is not understood, for example, enzymes that posttranslationally modify histones (Berger, 2007). Third, the absence of kinetic information with regard to promoter state transitions has complicated the task of distinguishing between cause and effect, as shown by the following observations.
The binding of TBP at the core promoter, considered critical for assembly of the transcription machinery, was found to coincide with transcriptional activation of many inducible genes in yeast (Kuras and Struhl, 1999; Li et al, 1999), and activators were seen to interact with TBP and TAFs (Chen et al, 1994). Mediator interacts with RNA polymerase and activators, and stimulates activator-dependent transcription in vitro (Kornberg, 2005). DNA binding domains when fused to Mediator components can bypass the need for natural activators in vivo at some promoters (Barberis et al, 1995; Gaudreau et al, 1997). These findings have generally been interpreted as evidence in support of the hypothesis that activators function by recruitment of the transcription machinery to promoters. However, they are equally consistent with alternative interpretations. Mediator stimulates transcription in the absence of activators, and may therefore have a role in conformational isomerization of the transcription machinery, rather than its recruitment (Kim et al, 1994; Takagi and Kornberg, 2006). Mediator subunits when fused to DNA binding domains may substitute for natural activation domains by recruitment of factors other than the transcription machinery. TBP binding at promoters may result from activator-controlled remodeling of nucleosomes occluding core promoter sequences, rather than recruitment (Workman and Roeder, 1987). Thus, it appeared conceivable that the function of activators is limited to the control of promoter chromatin remodeling alone (Adkins and Tyler, 2006).
Experimental evidence supports two possible explanations of how the inhibition of transcription by nucleosomes is overcome. The first suggests that promoter nucleosomes may be removed and reassembled at high frequencies, irrespective of the transcription state of the promoter (Linger and Tyler, 2006; Dion et al, 2007). In this case, recruitment would provide a kinetic advantage for transcription machinery assembly over nucleosome reformation. The net loss of promoter nucleosomes, observed in vivo (Almer et al, 1986; Boeger et al, 2003), would occur due to steric inhibition of nucleosome reassembly as a consequence of transcription machinery assembly (Workman and Roeder, 1987). The second hypothesis suggests that the frequency of spontaneous nucleosome disassembly is too low for efficient promoter activation. In this instance, activators must stimulate the frequency of nucleosome disassembly, presumably due to recruitment of chromatin remodeling activities (Hassan et al, 2001). The net loss of promoter nucleosomes would precede the recruitment of the transcriptional machinery, rather than occurring as a consequence. Cause and effect remain unclear, in this instance, because the rates of nucleosome removal and reformation reactions are unknown (Figure 1).
Figure 1.

The activation of transcription is a multistep process. The role of activators in transcriptional activation is unclear. Activators may control at least three steps of the activation process, either alone or in various combinations: nucleosome disassembly, assembly of the transcription machinery (PIC), and promoter clearance by RNA polymerase (Pol).
Several recent advances have opened the way for the analysis of promoter state dynamics in vivo: The description of promoter chromatin remodeling as a random process of nucleosome removal and reformation, established at the example of the PHO5 gene of yeast (Boeger et al, 2003, 2008; Jessen et al, 2006), the introduction of stochastic models of gene expression (Peccoud and Ycart, 1995), the conceptual and operational distinction between extrinsic and intrinsic noise of gene expression (Elowitz et al, 2002; Swain et al, 2002), and the realization that the regulatory architecture of the gene expression process is reflected in the intrinsic noise behavior of expression (Cox et al, 2008).
Intrinsic noise refers to the variability in gene expression between two copies of the same gene under identical intracellular conditions (Swain et al, 2002). It results from the randomness of dwell times between the chemical transitions of the expression process (Kepler and Elston, 2001), and is therefore dependent on the magnitude of the kinetic parameters of the process. In contrast, extrinsic noise is caused by kinetic parameter variation, which is due to fluctuations in the number of ribosomes, activators, and so on, and thus affects two copies of the same gene equally (Swain et al, 2002).
The PHO5 gene, a classic paradigm for investigating the role of chromatin structure in transcription (Almer et al, 1986), encodes an inducible phosphatase that is activated during phosphate starvation by the transcriptional activator Pho4 (Oshima, 1997). Upon phosphate starvation, Pho4 shuttles from the cytoplasm into the nucleus and binds to two upstream activator sequences, UASp1 and UASp2, in the PHO5 promoter, activating transcription (O'Neill et al, 1996; Barbaric et al, 1998; Munsterkotter et al, 2000). Under repressing conditions, the PHO5 promoter is characterized by nucleosomes in well-defined positions. Nucleosomes N-1 and N-2 occlude the TATA box and UASp2, respectively, whereas UASp1 is located in the linker region between nucleosomes N-2 and N-3 (Almer et al, 1986). Structural analysis of PHO5 chromatin revealed both disassembly and retention of nucleosomes at the activated promoter (Boeger et al, 2003, 2004). Retained nucleosomes were structurally indistinguishable from their counterparts at the repressed promoter (Boeger et al, 2003). The retention of nucleosomes was explained by the assumption of nucleosome reassembly under inducing conditions, and the apparent inability of the remodeling mechanism to remove the last promoter nucleosome (stable retention hypothesis) (Boeger et al, 2003, 2008). Removal and reformation of promoter nucleosomes are believed to occur randomly, establishing a statistical ensemble of distinct nucleosome configurations that coexist within a population of cells (Boeger et al, 2008). As promoter nucleosomes repress the initiation of transcription in vitro and in vivo (Lorch et al, 1987; Han and Grunstein, 1988; Kaplan et al, 2003), this statistical view of activated promoter chromatin implies that the promoter randomly switches between transcriptionally active and inactive nucleosome configurations. Consistently, single-cell expression analysis suggested the existence of a stochastic on-off switch upstream of PHO5 transcription, however the question of whether such a model could quantitatively account for the observed expression noise was not addressed (Raser and O'Shea, 2004).
We have investigated the relationships between the average level of PHO5 expression, the intrinsic noise of expression, and the density of PHO5 promoter nucleosomes at steady state for a series of Pho4 activation domain mutants. Comparison of experimental measurements with quantitative predictions derived from a stochastic model of PHO5 expression and chromatin remodeling allowed us to distinguish between competing regulatory schemes, and to derive estimates for the kinetic parameters of promoter state transitions under repressing and activating conditions.
Results
To approximate steady-state expression conditions as closely as possible, we performed all experiments in pho80Δ strains, which constitutively activate PHO5 due to uncoupling of the PHO5 promoter from the phosphate signaling pathway (Kaffman et al, 1994). We analyzed 20 Pho4 activation domain mutants in addition to the PHO4 wild type strain, and strains that bear mutations in the Pho4 binding sites at UASp1 and UASp2 of the PHO5 promoter. Cell doubling times during exponential growth were closely similar for all mutants (Supplementary Figure S1). Analysis of PHO5-promoter-controlled YFP (yellow fluorescent protein) expression revealed a wide spectrum of expression levels from ∼1% of wild-type expression in the UASp1 mutant to 140% in the D78A point mutant (Supplementary Table S1). Messenger RNA levels and YFP abundance showed a linear relationship (Supplementary Figure S2A–B), indicating that activator mutations did not affect the efficiency of translation.
Evidence for a statistical ensemble of nucleosome configurations
Gel filtration analysis of PHO5 promoter circles showed that a population of circles became structurally heterogeneous in the course of PHO5 induction, but the steady-state population, at the end of the induction process, appeared homogenous with respect to nucleosome number (Boeger et al, 2008). Although consistent with a stochastic process of nucleosome disassembly and reassembly, these results left open the possibility that chromatin remodeling at PHO5 is a deterministic but randomly initiated process.
To test for the coexistence of distinct nucleosome configurations within a cell population at steady state, we analyzed the accessibility of PHO5 promoter chromatin to ClaI digestion for most mutants. We used strains with two ClaI sites at the PHO5 promoter, one naturally occurring site upstream of UASp2, which is protected from enzymatic cleavage by nucleosome N-2 (Figure 2A) (Almer et al, 1986), and a second, artificial, site in place of the TATA box, protected by nucleosome N-1 (Boeger et al, 2003). This allowed us to simultaneously probe the nucleosome occupancies at positions N-1 and N-2 by indirect end labeling, using two probes for sequences downstream and upstream of the promoter (Figure 2A). The results revealed the coexistence of distinct accessibility patterns, with promoters cut at one ClaI site but not the other (middle bands, Figure 2A), and not cut at either one of them (upper bands, Figure 2A). The lower bands in the autoradiographies of Figure 2A resulted from cutting of promoters at both sites or the probe-proximal site alone, from which the fraction of promoters that were cut at both sites could be calculated. The restriction analysis is consistent with the notion of four classes of promoter nucleosome configurations, with loss of N-1 but not N-2, loss of N-2 but not N-1, loss of both N-1 and N-2, or retention of both N-1 and N-2. In PHO4 wild-type cells and most mutants, all four configuration classes were populated by a substantial fraction of the cell population (Figure 2B). In contrast, the PHO5 promoter chromatin of pho4Δ cells appeared mostly homogeneous, as expected, demonstrating that the observed heterogeneity was not an artifact of sample preparation.
Figure 2.

Activated promoter chromatin is structurally heterogeneous. (A) Nuclei isolated from wild type, Δ79–90, Δ85–99, and Δ79–99 Pho4 mutants were digested with 50 (L) or 100 (H) units of ClaI. Purified DNA was subsequently digested with either BamHI/PstI (upper row of autoradiographies) or ApaI/DraI (lower row) for downstream or upstream probing, respectively. The DNA was fractionated by gel electrophoresis, blotted, and hybridized with a 32P-labeled ORF probe (downstream) or upstream probe. A diagram of the PHO5 promoter illustrates the locations of the two ClaI restriction enzyme sites, the sequences probed (black vertical bars), nucleosome positions (gray ovals), TATA box (black dot), UASp2 (white dot), UASp1 (gray dot), and the DNA fragments produced by restriction enzyme digestion for upstream probing (gray lines on the left of promoter illustration) and downstream probing (gray lines on the right). Values at the bottom of autoradiographies indicate the percent of promoters cleaved at N-1 (N-1, upper row) and N-2 (N-2, lower row), respectively. Bands correspond to uncut promoter DNA (no cut), promoters cut at N-1 (N-1), N-2 but not N-1 (N-2 only), N-2 (N-2), and N-1 but not N-2 (N-1 only). (B) ClaI accessibilities of PHO5 promoter DNA and expression levels for 22 strains. Expression levels are indicated as percent of wild-type expression. Error bars indicate standard deviations of measurements. The relative frequency of uncut promoters and promoters cut at N-1 and N-2 (cut at both) is the average from hybridizations with upstream and downstream probes.
Loss of nucleosomes N-2 and N-1 were strongly correlated (correlation coefficient of 0.97), indicating that activator mutations affected nucleosome loss at different promoter positions equally (Supplementary Figure S4A).
Promoter nucleosome occupancy increases with decreasing activator strength
To accurately determine the extent of nucleosome loss at the PHO5 promoter, we used strains that allow for the excision, in circular form, of the PHO5 gene from its chromosomal locus, including promoter nucleosomes N-1 to N-3 (Boeger et al, 2003). All circles bore a mutated TATA box to exclude effects of transcription on circle topology. The absence of a functional TATA box had no measurable effect on promoter chromatin remodeling, but completely abolished PHO5 transcription (Boeger et al, 2003). Loss of promoter nucleosomes was indicated by a change in the mean linking number of the chromatin circle topoisomer distribution relative to the distribution of the chromatin circle of the repressed gene (measured in pho4Δ cells), as previously shown (Boeger et al, 2003) (Figure 3B). Consistently, the linking change showed a linear relationship with the increase in ClaI accessibility at position N-1 (Figure 3C).
Figure 3.

Chromatin structure and expression. (A) Frequencies of promoters with positions N-1, N-1 only, and both, N-1 and N-2, accessible to ClaI cleavage plotted against expression, normalized to wild-type expression, for activator mutant strains. (B) Topoisomer distributions of PHO5 gene circles excised from strains bearing Pho4 activation domain mutations. Numbers indicate the shift, ΔLk°, of the distribution mean (arrow head) relative to the distribution mean in pho4Δ cells (R). Position of nicked circles are indicated by (*). Measurements and standard deviations for all measurements are provided in Supplementary Table S1. (C) Plot of ΔLk° versus ClaI accessibility at position N-1. (D) Quantitative relationship between expression level, normalized to wild type, and nucleosome loss (ΔLk°). Error bars indicate the standard deviation of expression and ΔLk° measurements. Wild-type PHO4, UASp2Δ, and UASp1Δ data points are represented by a white circle, square, and triangle, respectively. The curve represents the best-fit exponential function to our data.
In agreement with earlier measurements (Boeger et al, 2003), we observed that 1.85±0.09 nucleosomes were lost from the fully induced PHO5 promoter in pho80Δ PHO4 cells (Figure 3B; Supplementary Table S1). Mutation D78A, which markedly increased the level of expression relative to wild type, did not lead to the loss of more than two promoter nucleosomes, in accordance with the stable retention hypothesis (Figure 3D; Supplementary Table S1).
Progressively fewer nucleosomes were lost in cells expressing activator mutants of decreasing strength (Figure 3D; Supplementary Table S1), indicating that, at steady state, nucleosome disassembly is balanced by reassembly; in the absence of balancing, promoter positions are either fully occupied or maximally depleted of nucleosomes, in contradiction to our observations (Figure 3D; Supplementary Table S1).
Intrinsic noise of PHO5 expression in Pho4 activator mutant strains
Stochastic removal and reformation of nucleosomes, as suggested by the structural analysis of activated PHO5 promoter chromatin, imply that the induced promoter randomly switches between transcriptionally active and inactive states. The lower the frequencies of promoter state transitions, the higher the intrinsic noise of expression (Kepler and Elston, 2001). We measured the intrinsic noise for all mutants by fluorescent microscopy in diploid pho80Δ cells expressing CFP and YFP under transcriptional control of the endogenous PHO5 promoters (Elowitz et al, 2002; Raser and O’Shea, 2004). Geometrically, the intrinsic noise equals the mean squared distance of points from the diagonal of a scatter plot, where individual points indicate the YFP and CFP signals of individual cells after normalization of the signals to a mean value of 1 (Figure 4A). YFP and CFP signals were strongly correlated in PHO4 wild-type cells, indicative of fast promoter transitions (Figure 4A). Conversely, the lack of a strong correlation in cells with weak activator alleles indicated the slowing down of one or more activator-controlled transitions in the gene expression process (Figure 4A). The measured values for the intrinsic noise spanned nearly three orders of magnitude across mutants (Figure 4B).
Figure 4.

Intrinsic noise of expression. (A) Scatter plots for normalized CFP and YFP expression in individual pho80Δ cells are shown for wild-type PHO4 and activator mutants Δ79–90, Δ85–99, and Δ79–99. CFP and YFP signals were normalized to the cell area and mean. Results and standard deviations for all measurements are provided in Supplementary Table S1. (B) The quantitative relationship between intrinsic noise and the mean expression of activator mutants. Wild-type PHO4, UASp2Δ, and UASp1Δ data points are represented by a black circle, white square, and white triangle, respectively. Data points for mutants Δ79–90, Δ85–99, and Δ79–99 are color coded as in A.
Model of promoter chromatin remodeling and gene expression
We based a stochastic model of PHO5 chromatin remodeling and gene expression on the following considerations.
Assuming that the nucleosome-free state is disallowed (stable retention hypothesis), the four distinct chromatin states indicated by ClaI analysis may represent seven alternative promoter nucleosome configurations, generated by the removal and reassembly of nucleosomes (Figure 5A). Because of the abundance of catalyzing enzymes, it is likely that the transitions between nucleosome configurations also occur by sliding of nucleosomes between promoter positions.
Figure 5.

Model of PHO5 promoter chromatin remodeling and expression. (A) Transition topology for promoter states E0, …, E9, representing the four classes of nucleosome configurations suggested by ClaI accessibility analysis. Members of the same class are placed in the same column. Transitions between promoter states occur due to disassembly, reassembly, and sliding of nucleosomes, as well as transitions into and out of transcriptionally active states (shaded promoters). (B) Diagram outlining the two possible schemes that restrict activator control to one kinetic parameter of the expression process. Activator-controlled transitions are indicated by bold arrows and are labeled Pho4. (C) Diagram outlining three possible schemes (I, II, III) that limit activator control to two kinetic parameters. A regulatory scheme formally equivalent to scheme III was recently inferred for transgene expression in a mammalian cell line (Raj et al, 2006). Transitions potentially regulated by the Pho4 activator are indicated by bold arrows. (Arrow widths do not reflect the magnitude of transition rates).
The level of expression strongly correlated with the relative frequency of promoters accessible at N-1, but not the relative frequencies of promoters accessible at only N-1, or promoters accessible at both positions (Figure 3A). Thus, in the absence of nucleosome N-1, neither removal nor retention of nucleosome N-2 appears to be required for the initiation of transcription. We therefore assumed that all nucleosome configurations without a nucleosome in position N-1 permit assembly of the transcription machinery. This defines three additional, transcriptionally active, states (enclosed by shaded boxes in Figure 5A), which may persist following promoter clearance by RNA polymerase, permitting rapid reinitiation of transcription from a persisting scaffold of general transcription factors at the promoter (Yudkovsky et al, 2000). We assumed that these transcriptionally active states do not allow for nucleosome reassembly or sliding, accounting for the steric exclusion of nucleosomes by the transcription machinery.
The ‘cellular state of PHO5 expression’ is defined by three variables, the promoter state (Figure 5), the number of PHO5 mRNAs, and the number of Pho5 protein molecules. The flow of probability mass between cellular states, due to nucleosome disassembly, the synthesis of an mRNA molecule, and so on, is given by the chemical master equation for the model (Gillespie, 2007), in which the transition probabilities per time and molecule for cellular state transitions were assumed to be constant and only dependent on the current and the future cellular state (assumption of a time-homogenous Markov process, see Supplementary information). We refer to the transition probabilities per time and molecule as the ‘kinetic parameters’ of the model. Their values equal the reciprocal average dwell times between transitions (Feller, 1971). We allowed for eight kinetic parameters, determining the rates of disassembly, reassembly (two parameters), and sliding of promoter nucleosomes, transcription machinery assembly and disassembly, promoter clearance, and translation (for details see Supplementary information). As the half-life of green fluorescent protein (GFP) in yeast is long compared with the duration of the cell cycle (Gordon et al, 2007), the kinetic parameter for protein degradation was set equal to ln2/τ, where τ is the doubling time of yeast (∼2 h in synthetic media). The parameter for mRNA degradation, δ, was assumed to be 0.12 min−1, in accordance with half-life measurements of GFP-mRNA in yeast (Hyde et al, 2002). This latter assumption, together with the rate constant for protein degradation, served to introduce an absolute time scale for the other kinetic parameters. The particular choices for these parameters did not affect the fitting properties of different regulatory schemes (see below).
The use of vector-valued generating functions allowed us to derive analytical expression for the first two moments of the steady-state joint probability distribution (see Supplementary information), thus extending previous models, which were either limited to the modeling of promoter state transitions as a two-state on/off switch (Peccoud and Ycart, 1995; Kepler and Elston, 2001; Raser and O’Shea, 2004), or excluded transcription and translation when more than two promoter states were modeled (Kim and O’Shea, 2008).
Quantitative comparison between alternative regulatory schemes
Given the kinetic parameters, the experimental observables of nucleosome loss, expression level, and intrinsic noise can be calculated on the basis of our gene expression model (see Supplementary information). Conversely, the experimental observables can be used, therefore, to derive quantitative estimates for the kinetic parameters by fitting the model to the experimental data.
Regulatory schemes that assume control of one kinetic parameter by the activator, with other parameters being constant across activator mutants, could not explain the observed exponential relationship between nucleosome loss and expression level (Figure 3D, Supplementary Figure S4B, S4C), or the occurrence of mutants with similar nucleosome occupancies but significantly different levels of expression (Figure 3D). Examples for the expected relationship between nucleosome loss and expression when activator control was limited to either the kinetic parameter for nucleosome disassembly or transitions into transcriptionally active states (Figure 5B) are shown below (Figure 7B).
In contrast, the independent tuning of two kinetic parameters allowed us to reproduce the measured values for nucleosome loss and expression level for all mutants (see Supplementary information). We considered three possible scenarios, outlined in Figure 5C (schemes I, II, and III). For each regulatory scheme, we determined the model parameters by minimizing the total error between predicted and measured intrinsic noise, given the measured level of expression and nucleosome loss for each activator mutant (see Equation (32) of Supplementary information).
Scheme I, which assumes that nucleosome removal and transcription machinery assembly are the activator-controlled, rate-limiting, steps of the activation process, allowed for the smallest total error between predicted and measured noise (Figure 6A–C). Plotting the predicted intrinsic noise as a function of nucleosome loss and expression level showed the close fit between theoretical prediction and measurements, with all data points in close proximity to the calculated surface of theoretically allowed noise values (Figure 7A). This was also true for UASp mutants, which were excluded from parameter fitting.
Figure 6.

Predicted and measured noise. Comparison between measured intrinsic noise (black horizontal bar) and predicted (colored circle) intrinsic noise of PHO5 expression for 23 strains. The latter was based on best-fit solutions to regulatory schemes I (A), II (B), and III (C). Strains were listed in the order of increasing intrinsic noise (Supplementary Table S1). The standard deviation of individual measurements is indicated by a gray rectangle. The average difference between predicted and measured intrinsic noise values (model error) for schemes II and III exceeded the model error for scheme I by a factor of 1.7 and 6.7, respectively.
Figure 7.

Intrinsic noise as a function of relative expression and promoter nucleosome loss. (A) Relationship between the logarithm of the intrinsic noise, lg (η2), nucleosome loss, μX, and expression level, μN calculated on basis of the best-fit solution to regulatory scheme I. Spheres indicate the experimental measurements for 21 pho4 mutant strains (blue), including wild type, and UASp1 and UASp2 mutant strains (green), which were not included in the model fitting. (B) Contour plot of the logarithm of the intrinsic noise as a function of expression level (relative to wild type) and promoter nucleosome loss for the best-fit solution to regulatory scheme I. The darker the color, the lower the noise. Dots indicate expression and nucleosome loss values for mutants and wild type, using the same color code as in A. Dashed curves show expected trajectories for either tuning both activator-controlled parameters equally (dark gray), tuning only the parameter for nucleosome disassembly (white curve), or only the parameter for transitions into transcriptionally active states (light gray curve). The dot at the intersection of all three curves indicates data for the PHO4 wild type. Note that the latter two curves do not explain the observed relationship between nucleosome loss and expression. Most of the measurements are close to the dark gray curve, suggesting that most activator mutations impact both activator-controlled parameters equally.
Testing quantitative model predictions
Although independent methods to determine the frequencies of nucleosome transitions in vivo are not available, inferred kinetic parameter values for downstream transitions can be tested by alternative methods. Thus, the average number of mRNA molecules per cell at steady state is given by μM=p × ε/δ, where p is the probability of finding the promoter transcriptionally active, ε is the frequency of transcription initiation, given that the promoter is in a transcriptionally active state, and δ is the rate of mRNA degradation. With the values for p and ε inferred from the best-fit solution to scheme I, and δ given (see above), we predicted an average number of 38 mRNA molecules per cell for PHO4 wild-type cells. To test this prediction, we determined this number independently by fluorescent in situ hybridization (FISH) using CFP-antisense DNA probes (Figure 8A). Fluorescent microscopy images of hybridized cells showed a large number of discrete fluorescent dots in the cytoplasm of PHO4 wild-type cells. Hybridization of pho4Δ cells demonstrated the specificity of the probes (Figure 8B). Where the number of mRNA molecules was too high to resolve individual molecules, we inferred the number of dots by extrapolation of the linear relation between total cell fluorescence and molecule number, measured in weakly expressing cells (Supplementary Figure S7). Our measurements indicated an average number of 61 molecules per cell, in close agreement with the predicted value.
Figure 8.

Counting mRNA molecules by fluorescent in situ hybridization. PHO4 pho80Δ cells (A) and pho4Δ pho80Δ cells (B) that bore the coding sequences for CFP under control of the PHO5 promoter were hybridized with antisense-CFP probes, linked to a fluorescent dye (Alexa 555). Alexa signal is shown in red, the DAPI stained nucleus in blue.
Discussion
By restriction enzyme accessibility and topology analyses, we provided additional support to the notion that activated PHO5 promoter chromatin represents a statistical ensemble of discrete nucleosome configurations, generated by random events of nucleosome disassembly and reassembly (Boeger et al, 2003; Jessen et al, 2006). What are the frequencies of these structural fluctuations, and which promoter state transitions become rate limiting to transcription as the gene approaches the repressed state?
Fluctuations in promoter nucleosome occupancy must contribute to the intrinsic noise of expression, as nucleosomes at core promoter sequences repress the initiation of transcription (Lorch et al, 1987; Han and Grunstein, 1988; Kaplan et al, 2003). Consistently, we observed a strong correlation between nucleosome loss at position N-1 and the level of PHO5 expression (Figure 3A). This provides the mechanistic link between fluctuations in promoter chromatin structure and the intrinsic noise of expression, and thus ties the kinetic parameters of promoter nucleosome reactions to the magnitude of the intrinsic noise. The above questions could thus be addressed by comparing theoretical (intrinsic) noise values, derived for different regulatory schemes and kinetic parameter values, with measured noise values for a large set of activator mutants.
Our analysis suggests that two steps of the expression process slow down as the gene gradually approaches the repressed state: Nucleosome removal and assembly of the transcription machinery (regulatory scheme I of Figure 5C). This assumption is sufficient to describe the quantitative relationship between intrinsic noise, nucleosome loss, and expression level. It is also necessary: Despite the relatively large number of kinetic parameters of our model, plausible alternative schemes fit our experimental data markedly less well, including schemes II and III (Figures 5C, 6B and C), as well as models that limit activator control to a single kinetic parameter (Figure 5B).
Rejection of the latter class of models is based on the observed exponential relationship between nucleosome loss and expression (Figure 3D; Supplementary Figure S4B, S4C). An approximately linear relationship would be expected if the rate of transcription was entirely determined by either the rate of nucleosome removal or the rate of transcription machinery assembly. Our equations bear out this expectation (Figure 7B). They also show that equal tuning of both parameters, for nucleosome disassembly and transitions into transcriptionally active states, perfectly recaptures the exponential approximation to our data (compare Figures 3D and 7B). Unequal tuning of the parameters explains deviations from this approximation.
Regulatory scheme I implies that promoter clearance by RNA polymerase is intrinsically fast. Although RNA polymerase has been found at many transcriptionally inactive genes in metazoans, the available evidence indicates that transcription is blocked at a post-initiation step (Hartzog and Tamkun, 2007), consistent with our conclusion. The exclusion of scheme III by our kinetic analysis is furthermore consistent with the apparent absence of chromatin remodeling defects in PHO5 TATA box mutants (Fascher et al, 1993; Boeger et al, 2003).
Model fitting for regulatory scheme I defined most parameters well within an order of magnitude or less (Supplementary Table S2). Parameter estimates for scheme I suggest that nucleosome removal reactions occur at frequencies >1 min−1 at the activated promoter, but <1 h−1 at the repressed promoter (UASp1 mutant). The chromatin transition between the repressed and activated PHO5 promoter, therefore, is from a mostly static into a dynamic state. The primary cause of nucleosome loss is increased disassembly, rather than steric exclusion by the transcriptional machinery.
The relative stability of repressed promoter nucleosomes permits for the possibility of integrating regulatory information at the level of promoter histones before gene activation, most likely by posttranslational modification of histones. In contrast, constitutive, fast exchange of promoter histones, as suggested by regulatory scheme III and previous reports (Linger and Tyler, 2006; Dion et al, 2007), would preclude this possibility.
It has previously been argued that PHO5 expression is regulated by controlling the rate of chromatin remodeling, because deletion of SWI6, which encodes a subunit of the chromatin remodeler SWI/SNF, was seen to affect the noise of PHO5 expression (Raser and O’Shea, 2004). However, the effect of the SWI6 deletion on the structure of PHO5 chromatin was not analyzed, and Swi2, the catalytic subunit of the SWI/SNF complex, was found to be dispensable for PHO5 expression (Gaudreau et al, 1997). Most importantly, the question of whether SWI/SNF is recruited to the activated promoter was not addressed. The remodeler may catalyze nucleosome disassembly at both the activated and the repressed promoter, as suggested, for example, by regulatory scheme III (Figure 5C).
Our results are consistent with the observation that Pho4, similar to other eukaryotic activators, stimulates transcription of chromatin-free templates in vitro (Terrell et al, 2002). In contrast, it has been proposed that Pho4 function is limited to the stimulation of promoter nucleosome disassembly, based on the finding that PHO5 expression (determined by phosphatase activity and RT–PCR) persisted after inactivation of Spt6 and subsequent removal of Pho4 from the nucleus (Adkins and Tyler, 2006). This finding does not contradict our results when the pleiotropic effects of Spt6 inactivation are considered. Loss of Spt6 function causes loss of nucleosomes over transcribed regions (Kaplan et al, 2003), as well as the activated PHO5 promoter (Adkins and Tyler, 2006). The latter possibly occurs due to sliding of promoter nucleosomes into the nucleosome-depleted open reading frame (ORF). Nucleosome depletion is sufficient to de-repress PHO5 transcription (Han and Grunstein, 1988). Thus, continued depletion of promoter nucleosomes above the physiological level—60% of induced promoters bear a nucleosome at the core promoter in SPT6 wild-type cells (Boeger et al, 2003)—may have permitted continued transcription, despite removal of the activator. Loss of nucleosomes over the ORF may have allowed for transcription from cryptic promoter sites (Kaplan et al, 2003), contributing to the observed RT–PCR signal, and cell cycle arrest on Spt6 inactivation may have prevented a drop in phosphatase activity due to stability of the Pho5 protein. The latter was clearly indicated by the long half-life of Pho5 activity (Adkins and Tyler, 2006). Thus, the results of Adkins and Tyler (2006) do not compel the conclusion that activator function is limited to the control of chromatin remodeling, an interpretation that is furthermore difficult to reconcile with biochemical evidence to the contrary (Kim et al, 1994; Terrell et al, 2002).
The mechanistic connection between transcription and posttranslational histone modifications remains unknown. Two histone acetyltransferases have been implicated in PHO5 regulation (Gregory et al, 1998; Nourani et al, 2004). According to regulatory scheme I, histone acetylation either affects the biochemical stability of promoter nucleosomes, stimulates assembly of the transcription machinery, or both. This conclusion agrees with the demonstration that histone modifications can modulate the catalytic activity of chromatin remodelers (Grant et al, 1997; Corona et al, 2002; Ferreira et al, 2007), and that components of the TFIID complex bear domains for recognition of histone modifications that correlate with transcription (Jacobson et al, 2000).
Our data are consistent with the notion that the last promoter nucleosome may be slid between promoter positions but cannot be removed from the promoter. Retention of the last nucleosome was explained by the assumption of sliding-mediated disassembly, in which unspooling of DNA from the histone octamer occurs by sliding of a neighbor nucleosome (Cairns, 2007; Boeger et al, 2008). Consistently, SWI/SNF has been found to catalyze removal of histone H3 in vitro from dinucleosome substrates but not mononucleosomes (Dechassa et al, 2010). The stable retention may preserve a role of promoter nucleosomes in recruitment of the transcription machinery by posttranslational histone modifications, as discussed above.
The kinetic model of regulated gene expression presented here is based on our current understanding of promoter chromatin remodeling at the PHO5 promoter as a stochastic process of nucleosome disassembly and reassembly. Given regulatory scheme I (Figure 5C), the model accounts with remarkable accuracy for the observed quantitative relationship between the experimental observables. Measurements of the intrinsic noise over a wide range of expression values allowed us to quantitatively distinguish between alternative regulatory schemes of PHO5 expression, suggesting that the regulatory architecture of the expression process is measurably reflected in the intrinsic noise of expression (Cox et al, 2008). Encouragingly, model parameters, fit to the observed noise profile, provided a realistic estimate for the apparent rate of transcription, p × ε, suggesting that the derived parameter values capture the actual temporal dynamics of the expression process. However, our analysis has been limited to the measurement of intrinsic noise magnitude. Recent theoretical work demonstrated the value of both noise magnitude and its temporal dynamics (autocorrelation time) for distinguishing between alternative regulatory schemes (Simpson et al, 2003, 2004; Cox et al, 2008). Analysis of the intrinsic noise dynamics thus offers future avenues to further testing of our conclusions (Rosenfeld et al, 2005; Cox et al, 2008).
Materials and methods
Plasmids and strains
The PHO4 gene, including ORF, 800 base pairs of sequence upstream, and 200 base pairs of sequence downstream of the ORF, was cloned by PCR and inserted between the BamHI and SalI sites of pBluescript (Stratagene, La Jolla, CA) generating plasmid pCM1.9. The PHO4 deletion plasmid pCM4.5 was derived from pCM1.9 by replacing the HindIII/SmaI fragment of PHO4 with a 1.1 kb fragment encompassing the URA3 gene. Plasmids for PHO4 activation domain mutations were derived from pCM1.9 using the Quick Change II Site Directed Mutagenesis Kit (Stratagene). Sequences CACGTTTTC and ACACGTGGG, which include the Pho4 binding sites of UASp1 and UASp2 of the PHO5 promoter, were replaced by PCR with TGTACTAGT and TAGGCCTTC, respectively, to generate plasmids pCM55.1 and pCM54.1.
The PHO80 gene was replaced with LEU2 by homologous recombination in strains EY1655 and EY2343 (kindly provided by Erin O’Shea) using plasmid pCM43.12 digested with BamHI/SalI, which generated strains yE1.1 and yE2.1, respectively. Replacement of PHO4 with URA3 in strains yE1.1, yE2.1, and yM19.2 (Boeger et al, 2003) generated strains yE3.1, yE4.1, and yM63.19, respectively. PHO4 mutant strains (Supplementary Table S3) were derived from strains yE3.1, yE4.1, and yM63.19 by transformation with derivatives of pCM1.9 digested with BamHI/SalI, and subsequent selection on 5-fluoroorotic acid.
By homologous recombination, we replaced the PHO5/YFP cassette of strain yE1.1 with URA3, generating strain yE21.3. Exchange of LEU2 in the pho80 locus of strain yE21.3 with HIS3 gave strain yC56.11. Replacement of URA3 in the PHO5 locus of strain yC56.11 with the gene circle cassette of strain yM19.2 produced strain yC58.8, and replacement of PHO4 with URA3 in yC58.8 finally gave strain yC72.1. Transformations were performed using the lithium acetate method.
Topology analysis
Analysis of topoisomer distributions was performed as previously described, using PHO5 gene circle strains bearing a mutated TATA box (Boeger et al, 2003). Topoisomer distributions for repressed gene circles in strains yM63.19 and yC72.1, and activated circles in strains yM19.2 and yC58.8 were indistinguishable, indicating that differences in genetic strain background, with the exception of mutations in PHO4, did not affect nucleosome occupancy at the PHO5 promoter (see Supplementary Figure S5).
Accessibility assays
ClaI assays were performed as previously described (Boeger et al, 2003). Digestion of equal amounts of nuclei with Micrococcal nuclease indicated that differences in ClaI accessibilities were locus specific and not due to differences in the quality of the nuclei preparations (Supplementary Figure S3).
Fluorescent microscopy and noise measurements
For steady-state noise measurements cells were grown overnight in synthetic complete media (SCD). Measurements were carried out at cell densities of 1–5 × 10⁷ cells ml−1. Cells were concentrated, resuspended, placed on ice, and applied onto glass slides (3″ × 1″ × 1.0 mm, Fisher) in SCD medium for imaging.
RFP, YFP, CFP, and differential interference contrast images were collected in rapid succession in the described order to prevent premature photobleaching. Images of 25–30 fields from a minimum of two slides were collected for each culture. The exposure time was set up empirically for each culture to obtain maximum sensitivity. Exposure times did not exceed 2 s. Reported values for intrinsic noise are mean values calculated from at least nine different sets of cells taken from at least three independent cultures and three different time points each.
We used the Cell-ID 1.0 program to analyze collected images (Gordon et al, 2007), which included background subtraction, determination of cell area, and integrated YFP and CFP intensities. Each set of three corresponding images pertaining to the same photographed area was inspected visually to discard dead cells and morphologically aberrant cells from further analysis. Furthermore, we excluded cells with areas smaller than 300 area units. Budding cells not separated by the masking procedure of Cell-ID were discarded if the daughter cell was larger than a third of the mother cell. The total number of cells finally analyzed ranged from 200 to 600 for individual cell samples; the number of the rejected cells did not exceed 15% of the total number of photographed cells. We thus analyzed a total of ∼34 000 cells for this study.
Total CFP and YFP intensities were normalized to unit cell area and a mean value of 1 using Microsoft Excel. These values were further evaluated according to the following rules: Using a scatter plot of CFP/YFP ratio versus cell number, outliers in each experiment were identified as cells whose ratio was greater or less than twice the mean range of the ratios (⩽1% of all cells). This ensured near symmetry of CFP/YFP scatter plots around the diagonal of the plot. The level of autofluorescence was estimated using the diploid pho4Δ pho80Δ strain yE56.1. Average CFP and YFP fluorescence values determined for yE56.1 were subtracted from individual CFP and YFP values for other strains. For strains expressing the weakest activators, we usually found some cells with YFP and CFP signals close to, but lower than, the average background signal measured for strain yE56.1. In this case, we took the lowest signals within the population as the autofluorescence signal to avoid assigning negative expression values.
Geometrically, the experimental intrinsic noise of expression equals the mean squared distance of points from the diagonal of a scatter plot of YFP expression versus CFP expression, each normalized to a mean of 1 (Elowitz et al, 2002). Let cj and yj be the normalized fluorescent signal per unit area for CFP and YFP, respectively. The squared orthogonal distance of cell j with scatter plot coordinates (cj, yj) from the plot diagonal is ½(cj−yj)2. The intrinsic noise is thus given by
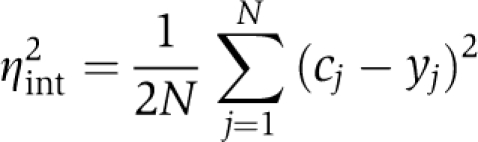 |
where N is the number of cells analyzed. If YFP expression perfectly correlates with CFP expression, all points (cj, yj) will fall onto the diagonal of the plot, and the intrinsic noise is zero. Thus, the intrinsic noise measures the degree to which the expression levels of CFP and YFP are uncorrelated in individual cells.
Computation and modeling
Computer programs for parameter fitting were written in C. The surface representation of intrinsic noise as a function of expression level and nucleosome loss, as shown in Figure 7, was calculated using Mathematica 7 (Wolfram Research). For details and a full derivation of the expression model see Supplementary information.
Fluorescent in situ hybridization
FISH was basically performed as previously described (Zenklusen et al, 2008). For details see Supplementary information.
Supplementary Material
Supplementary material, Supplementary figures S1–7, Supplementary tables SI–III
Acknowledgments
We thank C Kaplan, G Hartzog, R Kamakaka, D Feldheim, A Ehrensberger, J Griesenbeck, and Roger D Kornberg for advice and comments on the paper; E O’Shea for providing strains EY1655 and EY2343; Michael Rexach for sharing his microscope with us; and J Casolari for advice on FISH. CRB was supported by NRSA Grant F32GM087867 from the NIH. HB acknowledges support from NIH Grant GM078111-01 and the Pew Scholars Program.
Footnotes
The authors declare that they have no conflict of interest.
References
- Adkins MW, Tyler JK (2006) Transcriptional activators are dispensable for transcription in the absence of Spt6-mediated chromatin reassembly of promoter regions. Mol Cell 21: 405–416 [DOI] [PubMed] [Google Scholar]
- Almer A, Rudolph H, Hinnen A, Horz W (1986) Removal of positioned nucleosomes from the yeast PHO5 promoter upon PHO5 induction releases additional upstream activating DNA elements. EMBO J 5: 2689–2696 [DOI] [PMC free article] [PubMed] [Google Scholar]
- Barbaric S, Munsterkotter M, Goding C, Horz W (1998) Cooperative Pho2-Pho4 interactions at the PHO5 promoter are critical for binding of Pho4 to UASp1 and for efficient transactivation by Pho4 at UASp2. Mol Cell Biol 18: 2629–2639 [DOI] [PMC free article] [PubMed] [Google Scholar]
- Barberis A, Pearlberg J, Simkovich N, Farrell S, Reinagel P, Bamdad C, Sigal G, Ptashne M (1995) Contact with a component of the polymerase II holoenzyme suffices for gene activation. Cell 81: 359–368 [DOI] [PubMed] [Google Scholar]
- Berger SL (2007) The complex language of chromatin regulation during transcription. Nature 447: 407–412 [DOI] [PubMed] [Google Scholar]
- Boeger H, Griesenbeck J, Kornberg RD (2008) Nucleosome retention and the stochastic nature of promoter chromatin remodeling for transcription. Cell 133: 716–726 [DOI] [PMC free article] [PubMed] [Google Scholar]
- Boeger H, Griesenbeck J, Strattan JS, Kornberg RD (2003) Nucleosomes unfold completely at a transcriptionally active promoter. Mol Cell 11: 1587–1598 [DOI] [PubMed] [Google Scholar]
- Boeger H, Griesenbeck J, Strattan JS, Kornberg RD (2004) Removal of promoter nucleosomes by disassembly rather than sliding in vivo. Mol Cell 14: 667–673 [DOI] [PubMed] [Google Scholar]
- Cairns BR (2007) Chromatin remodeling: insights and intrigue from single-molecule studies. Nat Struct Mol Biol 14: 989–996 [DOI] [PMC free article] [PubMed] [Google Scholar]
- Chen JL, Attardi LD, Verrijzer CP, Yokomori K, Tjian R (1994) Assembly of recombinant TFIID reveals differential coactivator requirements for distinct transcriptional activators. Cell 79: 93–105 [DOI] [PubMed] [Google Scholar]
- Corona DF, Clapier CR, Becker PB, Tamkun JW (2002) Modulation of ISWI function by site-specific histone acetylation. EMBO Rep 3: 242–247 [DOI] [PMC free article] [PubMed] [Google Scholar]
- Cox CD, McCollum JM, Allen MS, Dar RD, Simpson ML (2008) Using noise to probe and characterize gene circuits. Proc Natl Acad Sci USA 105: 10809–10814 [DOI] [PMC free article] [PubMed] [Google Scholar]
- Dechassa ML, Sabri A, Podugula S, Kassabov SR, Chatterjee N, Kladde MP, Bartholemew B (2010) SWI/SNF has intrinsic nucleosome disassembly activity that is dependent on adjacent nucleosomes. Mol Cell 38: 590–602 [DOI] [PMC free article] [PubMed] [Google Scholar]
- Dion MF, Kaplan T, Kim M, Buratowski S, Friedman N, Rando OJ (2007) Dynamics of replication-independent histone turnover in budding yeast. Science 315: 1405–1408 [DOI] [PubMed] [Google Scholar]
- Elowitz MB, Levine AJ, Siggia ED, Swain PS (2002) Stochastic gene expression in a single cell. Science 297: 1183–1186 [DOI] [PubMed] [Google Scholar]
- Fan X, Chou DM, Struhl K (2006) Activator-specific recruitment of Mediator in vivo. Nat Struct Mol Biol 13: 117–120 [DOI] [PubMed] [Google Scholar]
- Fascher KD, Schmitz J, Horz W (1993) Structural and functional requirements for the chromatin transition at the PHO5 promoter in Saccharomyces cerevisiae upon PHO5 activation. J Mol Biol 231: 658–667 [DOI] [PubMed] [Google Scholar]
- Feller W (1971) An Introduction to Probability Theory and its Applications, Volume II New York: John Wiley & Sons, Inc. [Google Scholar]
- Ferreira H, Flaus A, Owen-Hughes T (2007) Histone modifications influence the action of Snf2 family remodelling enzymes by different mechanisms. J Mol Biol 374: 563–579 [DOI] [PMC free article] [PubMed] [Google Scholar]
- Gaudreau L, Schmid A, Blaschke D, Ptashne M, Horz W (1997) RNA polymerase II holoenzyme recruitment is sufficient to remodel chromatin at the yeast PHO5 promoter. Cell 89: 55–62 [DOI] [PubMed] [Google Scholar]
- Gillespie DT (2007) Stochastic simulation of chemical kinetics. Annu Rev Phys Chem 58: 35–55 [DOI] [PubMed] [Google Scholar]
- Gordon A, Colman-Lerner A, Chin TE, Benjamin KR, Yu RC, Brent R (2007) Single-cell quantification of molecules and rates using open-source microscope-based cytometry. Nat Methods 4: 175–181 [DOI] [PubMed] [Google Scholar]
- Grant PA, Duggan L, Cote J, Roberts SM, Brownell JE, Candau R, Ohba R, Owen-Hughes T, Allis CD, Winston F, Berger SL, Workman JL (1997) Yeast Gcn5 functions in two multisubunit complexes to acetylate nucleosomal histones: characterization of an Ada complex and the SAGA (Spt/Ada) complex. Genes Dev 11: 1640–1650 [DOI] [PubMed] [Google Scholar]
- Green MR (2005) Eukaryotic transcription activation: right on target. Mol Cell 18: 399–402 [DOI] [PubMed] [Google Scholar]
- Gregory PD, Schmid A, Zavari M, Lui L, Berger SL, Horz W (1998) Absence of Gcn5 HAT activity defines a novel state in the opening of chromatin at the PHO5 promoter in yeast. Mol Cell 1: 495–505 [DOI] [PubMed] [Google Scholar]
- Han M, Grunstein M (1988) Nucleosome loss activates yeast downstream promoters in vivo. Cell 55: 1137–1145 [DOI] [PubMed] [Google Scholar]
- Hartzog GA, Tamkun JW (2007) A new role for histone tail modifications in transcription elongation. Genes Dev 21: 3209–3213 [DOI] [PubMed] [Google Scholar]
- Hassan AH, Neely KE, Workman JL (2001) Histone acetyltransferase complexes stabilize swi/snf binding to promoter nucleosomes. Cell 104: 817–827 [DOI] [PubMed] [Google Scholar]
- Hyde M, Block-Alper L, Felix J, Webster P, Meyer DI (2002) Induction of secretory pathway components in yeast is associated with increased stability of their mRNA. J Cell Biol 156: 993–1001 [DOI] [PMC free article] [PubMed] [Google Scholar]
- Jacobson RH, Ladurner AG, King DS, Tjian R (2000) Structure and function of a human TAFII250 double bromodomain module. Science 288: 1422–1425 [DOI] [PubMed] [Google Scholar]
- Jessen WJ, Hoose SA, Kilgore JA, Kladde MP (2006) Active PHO5 chromatin encompasses variable numbers of nucleosomes at individual promoters. Nat Struct Mol Biol 13: 256–263 [DOI] [PubMed] [Google Scholar]
- Kaffman A, Herskowitz I, Tjian R, O’Shea EK (1994) Phosphorylation of the transcription factor PHO4 by a cyclin-CDK complex, PHO80-PHO85. Science 263: 1153–1156 [DOI] [PubMed] [Google Scholar]
- Kaplan CD, Laprade L, Winston F (2003) Transcription elongation factors repress transcription initiation from cryptic sites. Science 301: 1096–1099 [DOI] [PubMed] [Google Scholar]
- Kepler TB, Elston TC (2001) Stochasticity in transcriptional regulation: origins, consequences, and mathematical representations. Biophys J 81: 3116–3136 [DOI] [PMC free article] [PubMed] [Google Scholar]
- Kim HD, O’Shea EK (2008) A quantitative model of transcription factor-activated gene expression. Nat Struct Mol Biol 15: 1192–1198 [DOI] [PMC free article] [PubMed] [Google Scholar]
- Kim YJ, Bjorklund S, Li Y, Sayre MH, Kornberg RD (1994) A multiprotein mediator of transcriptional activation and its interaction with the C-terminal repeat domain of RNA polymerase II. Cell 77: 599–608 [DOI] [PubMed] [Google Scholar]
- Kornberg RD (2005) Mediator and the mechanism of transcriptional activation. Trends Biochem Sci 30: 235–239 [DOI] [PubMed] [Google Scholar]
- Kuras L, Struhl K (1999) Binding of TBP to promoters in vivo is stimulated by activators and requires Pol II holoenzyme. Nature 399: 609–613 [DOI] [PubMed] [Google Scholar]
- Li XY, Virbasius A, Zhu X, Green MR (1999) Enhancement of TBP binding by activators and general transcription factors. Nature 399: 605–609 [DOI] [PubMed] [Google Scholar]
- Linger J, Tyler JK (2006) Global replication-independent histone H4 exchange in budding yeast. Eukaryot Cell 5: 1780–1787 [DOI] [PMC free article] [PubMed] [Google Scholar]
- Lorch Y, LaPointe JW, Kornberg RD (1987) Nucleosomes inhibit the initiation of transcription but allow chain elongation with the displacement of histones. Cell 49: 203–210 [DOI] [PubMed] [Google Scholar]
- Ma J, Ptashne M (1987) A new class of yeast transcriptional activators. Cell 51: 113–119 [DOI] [PubMed] [Google Scholar]
- Munsterkotter M, Barbaric S, Horz W (2000) Transcriptional regulation of the yeast PHO8 promoter in comparison to the coregulated PHO5 promoter. J Biol Chem 275: 22678–22685 [DOI] [PubMed] [Google Scholar]
- Nourani A, Utley RT, Allard S, Cote J (2004) Recruitment of the NuA4 complex poises the PHO5 promoter for chromatin remodeling and activation. EMBO J 23: 2597–2607 [DOI] [PMC free article] [PubMed] [Google Scholar]
- O’Neill EM, Kaffman A, Jolly ER, O’Shea EK (1996) Regulation of PHO4 nuclear localization by the PHO80-PHO85 cyclin-CDK complex. Science 271: 209–212 [DOI] [PubMed] [Google Scholar]
- Oshima Y (1997) The phosphatase system in Saccharomyces cerevisiae. Genes Genet Syst 72: 323–334 [DOI] [PubMed] [Google Scholar]
- Peccoud J, Ycart B (1995) Markovian modelling of gene product synthesis. Theor Popul Biol 48: 222–234 [Google Scholar]
- Raj A, Peskin CS, Tranchina D, Vargas DY, Tyagi S (2006) Stochastic mRNA synthesis in mammalian cells. PLoS Biol 4: e309. [DOI] [PMC free article] [PubMed] [Google Scholar]
- Raser JM, O’Shea EK (2004) Control of stochasticity in eukaryotic gene expression. Science 304: 1811–1814 [DOI] [PMC free article] [PubMed] [Google Scholar]
- Rosenfeld N, Young JW, Alon U, Swain PS, Elowitz MB (2005) Gene regulation at the single-cell level. Science 307: 1962–1965 [DOI] [PubMed] [Google Scholar]
- Simpson ML, Cox CD, Sayler GS (2003) Frequency domain analysis of noise in autoregulated gene circuits. Proc Natl Acad Sci USA 100: 4551–4556 [DOI] [PMC free article] [PubMed] [Google Scholar]
- Simpson ML, Cox CD, Sayler GS (2004) Frequency domain chemical Langevin analysis of stochasticity in gene transcriptional regulation. J Theor Biol 229: 383–394 [DOI] [PubMed] [Google Scholar]
- Swain PS, Elowitz MB, Siggia ED (2002) Intrinsic and extrinsic contributions to stochasticity in gene expression. Proc Natl Acad Sci USA 99: 12795–12800 [DOI] [PMC free article] [PubMed] [Google Scholar]
- Takagi Y, Kornberg RD (2006) Mediator as a general transcription factor. J Biol Chem 281: 80–89 [DOI] [PubMed] [Google Scholar]
- Terrell AR, Wongwisansri S, Pilon JL, Laybourn PJ (2002) Reconstitution of nucleosome positioning, remodeling, histone acetylation, and transcriptional activation on the PHO5 promoter. J Biol Chem 277: 31038–31047 [DOI] [PubMed] [Google Scholar]
- Workman JL, Roeder RG (1987) Binding of transcription factor TFIID to the major late promoter during in vitro nucleosome assembly potentiates subsequent initiation by RNA polymerase II. Cell 51: 613–622 [DOI] [PubMed] [Google Scholar]
- Yudkovsky N, Ranish JA, Hahn S (2000) A transcription reinitiation intermediate that is stabilized by activator. Nature 408: 225–229 [DOI] [PubMed] [Google Scholar]
- Zenklusen D, Larson DR, Singer RH (2008) Single-RNA counting reveals alternative modes of gene expression in yeast. Nat Struct Mol Biol 15: 1263–1271 [DOI] [PMC free article] [PubMed] [Google Scholar]
Associated Data
This section collects any data citations, data availability statements, or supplementary materials included in this article.
Supplementary Materials
Supplementary material, Supplementary figures S1–7, Supplementary tables SI–III