

Abstract
Understanding how the immune system decides between tolerance and activation by antigens requires addressing cytokine regulation as a highly dynamic process. We quantified the dynamics of interleukin-2 (IL-2) signaling in a population of T cells during an immune response by combining in silico modeling and single-cell measurements in vitro. We demonstrate that IL-2 receptor expression levels vary widely among T cells creating a large variability in the ability of the individual cells to consume, produce and participate in IL-2 signaling within the population. Our model reveals that at the population level, these heterogeneous cells are engaged in a tug-of-war for IL-2 between regulatory (Treg) and effector (Teff) T cells, whereby access to IL-2 can either increase the survival of Teff cells or the suppressive capacity of Treg cells. This tug-of-war is the mechanism enforcing, at the systems level, a core function of Treg cells, namely the specific suppression of survival signals for weakly activated Teff cells but not for strongly activated cells. Our integrated model yields quantitative, experimentally validated predictions for the manipulation of Treg suppression.
Keywords: cellular heterogeneity, computer modeling, IL-2 signaling, immunology, regulatory T cells
Introduction
In the immune system, T-cell activation critically enforces self-/non-self-discrimination (Davis et al, 1998). On short time scales (second to minutes), individual T cells make discriminatory decisions between foreign antigens (that should trigger an immune response) and self-antigens (that should be tolerated) (Irvine et al, 2002; Altan-Bonnet and Germain, 2005). However, this ligand discrimination is not always accurate (Feinerman et al, 2008). As misguided activation against self-antigens can potentially trigger autoimmune disorders, mechanisms that correct spurious activation of individual cells on longer time scales, such as hours or days, are likely to exist. These longer time scales provide ample opportunity for cell-to-cell communication. Thus, signaling between individual cells might have a critical function in converting unreliable self-/non-self-discriminatory decisions by individual T cells into an accurate cell-population decision to mount or suppress an immune response.
In such balance between immune tolerance versus immune responsiveness to antigens, it has been proposed that regulatory T cells (Treg cells) suppress the onset and development of autoimmune diseases (Sakaguchi et al, 1995; Sakaguchi, 2004) by inhibiting the proliferative clonal expansion of self-antigen-activated effector T cells (Teff cells) (Chen et al, 1996; Stephens et al, 2005). By comparison, during a pathogenic infection, Treg surveillance must be overcome to allow Teff cells to proliferate and mount a full-scale response (Pasare and Medzhitov, 2003). Therefore, rather than indiscriminatingly suppressing all activated T cells (Belkaid et al, 2002), Treg cells display large plasticity in their suppressive capacities (Sakaguchi, 2004; Lund et al, 2008). They recognize and specifically suppress only T cells that could trigger autoimmune disorders (Stephens et al, 2005). Experimentally, when Teff cells are in excess compared with Treg cells (Thornton and Shevach, 1998), or when T-cell antigen receptor (TCR) activation and costimulatory signals are ‘strong’ enough (George et al, 2003; Sojka et al, 2005; Tran et al, 2009), Treg suppression of Teff proliferation can be overcome in vitro.
Proposed mechanisms of suppression by Treg cells remain to this day diverse and controversial. Recent studies focused on the role of interleukin-2 (IL-2) consumption in determining the function of Treg cells and their control of autoimmune disorders (Barthlott et al, 2005; Pandiyan et al, 2007; Busse et al, 2010). IL-2 was originally characterized as a TCR-inducible, T-cell-derived and specific lymphocytotrophic growth hormone that acts as a positive feedback by promoting T-cell proliferation and limiting apoptosis during responses against pathogens (Smith, 1984). Reciprocally, IL-2 consumption by Treg cells was shown to induce cytokine deprivation and apoptosis of Teff cells in vitro and to limit inflammatory bowel disorder in vivo (Pandiyan et al, 2007). A quantitative model for the competition for IL-2 as a critical mechanism to establish the suppression of Teff cells by Treg cells was recently introduced (Busse et al, 2010). This model attempted to account for the complexity of IL-2/IL-2R interactions, physiology and metabolism within a mixed population of Teff and Treg cells. To account for Treg suppression, this model relies on bistablity of IL-2 expression, which arises from a positive feedback of IL-2 on its own production. However, this postulate stands in disagreement with previous experimental observations (Kim et al, 2006; Villarino et al, 2007), which indicate that IL-2 feeds back negatively on its own expression, thereby rigidly curtailing long-term availability of IL-2. Below, we present further experimental measurements that challenge some quantitative and qualitative aspects of Busse et al's study and warrant an alternative model for the IL-2 competition between Teff and Treg cells to be developed.
Critical parameters that dictate in vitro Teff cell cycle progression after antigen activation were characterized early as the IL-2 concentration, the density of IL-2R and the kinetics of the IL-2/IL-2R interaction (Cantrell and Smith, 1984; Smith and Cantrell, 1985). There are in fact two classes of IL-2 receptors on T cells, one with a relative low affinity (Kd=10 nM), and another with 1000-fold higher affinity (Kd=10 pM). These two classes of IL-2-binding sites are created by three non-covalently linked IL-2R chains. The IL-2Rα chains account for low-affinity IL-2 binding, whereas a heterotrimer of IL-2Rα, IL-2Rβ, and IL-2Rγ accounts for high-affinity IL-2 binding (Wang and Smith, 1987). The role of the low-affinity receptor has been analyzed theoretically specifically in the establishment of an autocrine loop (Forsten and Lauffenburger, 1994).
The metabolism of the IL-2/IL-2R complex also has a function in contributing to the complexity of the ligand/receptor system. Upon binding IL-2, the high-affinity heterotrimeric IL-2R undergoes an accelerated internalization, with a half-time of 15 min, whereas IL-2 bound to isolated IL-2Rα chains is not internalized appreciably (Duprez and Dautry-Varsat, 1986). IL-2 also regulates itself in at least two ways: by regulating the expression of its own receptor, by enhancing the expression of IL-2Rα chains, by accelerating IL-2-dependent internalization and degradation of IL-2R, and also by promoting clonal deletion (Lenardo, 1991). However, subsequent studies with IL-2 gene deleted mice (Schorle et al, 1991) and IL-2R gene deleted mice (Suzuki et al, 1995; Willerford et al, 1995) demonstrated that, by maintaining the population of Treg cells, IL-2 also contributes to a negative feedback signal that limits self-responsiveness and abrogates T-cell-mediated tissue-specific autoimmune disorders (Horak et al, 1995).
In this study, we introduce a quantitative model for the regulation of immune responses by IL-2, in particular the competition for IL-2 between Teff and Treg cells. Our goal is to quantify the net effect of IL-2 on a population of T cells at the systems level. Accordingly, we constructed a quantitative model that relies on known factors that determine IL-2 secretion and IL-2 receptor (IL-2R) up/downregulation in both Teff and Treg cells (Figure 1)—quantitative details are in the Supplementary information 1. We use a combination of computational modeling, with in vitro single-cell analysis and quantification of surface and intracellular molecules—originally introduced to quantify the variability of T-cell response to antigens (Feinerman et al, 2008)—in order to dissect the intricacies of IL-2/IL-2R physiology. We demonstrate how Treg cells differentially suppress weakly activated but not strongly activated Teff cells. Our quantitative model highlights a previously unrecognized plasticity in IL-2 regulation between Teff and Treg cells, which assigns a core function for IL-2 at the system's level: enforcing self-/non-self-discrimination in the immune system.
Figure 1.

Qualitative model for the regulation of T-cell proliferation by IL-2. Upon antigenic activation, Teff cells secrete IL-2 and upregulate IL-2Rα. The trimeric IL-2R binds IL-2 to induce phosphorylation of STAT5, promote cell survival, and further upregulate IL-2Rα production while downregulating IL-2 expression. Bound IL-2 is endocytosed and degraded. Treg cells never express IL-2 but respond to it similarly as they express IL-2Rα even when lacking antigenic stimulation. IL-2 depletion by Treg cells constitutes a negative feedback on Teff survival. For details see Supplementary information 1.
Results
Heterogeneity in IL-2Rα levels drives variable responsiveness to IL-2 in Teff and Treg cells
To understand quantitatively how individual T cells respond to IL-2, we experimentally measured and modeled IL-2 binding to the IL-2R and the subsequent phosphorylation response of STAT5 (Lin and Leonard, 2000) in individual cells.
We found that fully activated T cells express a 50–100-fold excess of IL-2Rα chains (CD25) versus (IL-2Rβ and IL-2Rγ) chains (CD122 and CD132), see Supplementary information 2 for the validation of these measurements. Moreover, the variation in expression levels of the IL-2R subunits within a clonal population is substantial; IL-2Rα levels/cell may span over three orders of magnitude, variation in IL-2Rβ also exists but is less marked (Figure 2A). Therefore, we aimed to quantify how the density of IL-2R subunit per cell may tune the sensitivity of a cell's response to IL-2. Extending the methodology we previously introduced (Feinerman et al, 2008), we took advantage of the natural variation in the expression levels of IL-2Rα and IL-2Rβ in pre-activated T cells to experimentally determine their effects on the capacity to bind IL-2 and trigger phosphorylation of STAT5 following 10 min of exposure to different concentrations of IL-2 (for a validation of these pSTAT5 measurements by FACS, see Supplementary information 3).
Figure 2.

Responsiveness to IL-2 depends on the levels of IL-2Rα and IL-2Rβ on individual cells. (A, B) T-cell blasts, 65 h after antigen stimulation, present highly varied levels of IL-2Rα and IL-2Rβ on their surface. The small boxes in (B) represent individual bins within the distribution of IL-2Rα and IL-2Rβ, for each we analyze the pSTAT5 response. (C). This heterogeneous population of T-cell blasts was exposed to varied concentrations of IL-2 for 10 min, fixed, permeabilized, and stained for pSTAT5. Measurements were normalized bin by bin by substracting the baseline pSTAT5 level as measured in the corresponding bin of the ‘no IL-2’ condition. Dose responses are presented for varying levels of IL-2Rα (left panel) or varying levels of IL-2Rβ (right panel), as defined by color code in panel (B). (D) A typical sigmoidal fit for STAT5 phosphorylation that yields Amplitude and EC50 for the IL-2 response. (E) Dose responses for pSTAT5 were analyzed for different expression levels of IL-2 receptor subunits (IL-2Rα and IL-2Rβ) in individual cells by FACS (experiment) or modeled (theory, as described in F). Amplitudes are presented in the left panels (arbitrary units for experiment or number of pSTAT5 for the theory) and EC50 (pM) in the right panels. (F) Costaining for phospho-STAT5 and IL-2-Fc in individual cells reveals a near linear relationship between IL-2 binding and STAT5 phosphorylation. (G). A biochemical model relates known thermodynamic quantities to whole-cell pSTAT5 responses to IL-2. In our model, IL-2Rβ and IL-2Rγ bind to the weakly engaged IL-2Rα all at once: we simulated these chains as a single complex IL-2Rβ/IL-2Rγ (Lenardo, 1991).
We constructed separate dose-response curves for subpopulations with given IL-2R subunit levels (Figure 2C; Supplementary information 4). These curves can be parameterized according to the pSTAT5 amplitude, the pSTAT5 plateau attained upon exposure to saturating doses of IL-2, and the EC50, the IL-2 concentration resulting in 50% of the amplitude in pSTAT5 (Figure 2D). In Figure 2E, we present the amplitudes and EC50s of these dose-response curves plotted as a function of the experimentally determined number of IL-2Rα and IL-2Rβ molecules/cell. Our single-cell resolution demonstrates how the IL-2 EC50 for the phosphorylation of STAT5 is not constant, but varies 1000-fold, between 100 fM and 100 pM, depending on IL-2Rα levels on the cell surface. In particular, when the IL-2α chain density is very high (>105/cell), IL-2 binding is very efficient and even subPicomolar concentrations of IL-2 elicit a pSTAT5 response. By comparison, the amplitude of the pSTAT5 response depends strongly on IL-2Rβ levels, with the amount of activated STAT5 varying 1000-fold. Moreover, these results are valid for both Treg and Teff cells (Supplementary information 5).
The formation of a stable ligand/receptor complex triggers STAT5 phosphorylation (Lin and Leonard, 2000). Using intracellular staining of T cells exposed to the chimeric IL-2-Fc for 60 min, we established experimentally a simple relationship between the amount of bound and internalized IL-2 and the amount of generated pSTAT5 (Figure 2F). Next, we constructed a simple mathematical model (see Materials and methods section) for the signaling response to IL-2 in individual cells. The model (Figure 2G) consists of two reactions for transducing the IL-2 signal from the extracellular to the intracellular side. The first reaction accounts for the rapid, low-affinity binding of IL-2 to IL-2Rα, whereas the second interaction involves the association of the IL-2Rα/IL-2 complex with IL-2Rβ and IL-2Rγ. We found that a more complicated three-step model in which IL-2Rβ and IL-2Rγ bind independently in time-separated steps does not fit the data better than our two-step model (Supplementary information 6). This is also consistent with recently-published FRET measurements (Pillet et al, 2010). Based on the results from Figure 2F, we set the number of pSTAT5 proportional to the number of IL-2/IL-2R complexes formed after 10 min of simulated interaction. Our model correctly reproduces our experimental findings that the pSTAT5 EC50 and amplitude can be independently varied by changing the amount of the different IL-2R chains on the cell surface (Figure 2D, theory). Note that the Hill coefficient for these IL-2 dose response was kept to 1, as sharper dose responses with higher Hill coefficient did not fit our experimental data. The affinity of the IL-2Rα chain for IL-2 is fixed, but by employing two reactions for activating the IL-2 receptor complex, T cells are capable of regulating their sensitivity to this growth factor from 100 fM to 1 nM. Note that this behavior is not reproducible with a classical model for IL-2/IL-2R interaction, which considers only one single IL-2/IL-2R-binding event and uses a single-affinity constant of 10 pM. Hence, our single-cell measurements unraveled an extreme plasticity in the T cells’ responsiveness to IL-2, which directly depends on the IL-2Rα expression levels. In the following section, we show that the expression levels of IL-2Rα in individual cells determine quantitatively their response to IL-2. Taken together with the findings of this section, this will prove to have a pivotal function in shaping the immune response of a population of T cells.
Regulation of IL-2Rα and its functional effects on Teff or Treg cells
In addition to both IL-2Rβ and IL-2Rγ, Treg cells constitutively express IL-2Rα with a geometrical mean of 104 molecules/cell (Supplementary information 2). Hence, they are constitutively responsive to IL-2. Furthermore, the IL-2Rα gene promoter includes pSTAT5 response elements, so that IL-2Rα expression is regulated by IL-2 in addition to antigen stimulation (Kim et al, 2006). Accordingly, we measured experimentally the IL-2Rα regulation on CD4+Foxp3+ Treg cells in response to different doses of IL-2 in vitro. We found that Treg cells upregulate IL-2Rα (Figure 3A), but not IL-2Rβ (Figure 3B) in <24 h of exposure to extremely low doses of IL-2 (<100 fM; Figure 3A–C). This receptor subunit upregulation constitutes a positive feedback mechanism that drives further STAT5 phosphorylation and further IL-2Rα upregulation ultimately resulting in a higher capacity to bind IL-2. Treg cells exposed to high concentrations of IL-2 show a decrease in IL-2Rβ levels (Figure 3C), this is due to increased rates of IL-2R endocytosis and degradation upon IL-2 binding.
Figure 3.

Dynamics of IL-2Rα upregulation and IL-2 depletion for Treg and Teff cells. IL-2Rα (A) and IL-2Rβ (B) levels on isolated Treg cells incubated in the presence of 10 fM to 1 pM IL-2 for 40 h. Results are summarized in (C), revealing that Treg cells upregulate IL-2Rα by six-fold with an EC50 of 60 fM of IL-2. Similar results were obtained for non-isolated Treg cells. (D) Depletion of IL-2 in vitro in four different conditions of Treg number and IL-2Rα levels. IL-2Rα levels on Treg cells that were pre-exposed to IL-2 (CD25hi) are initially centered around 2.7 × 10⁴ molecules/cell, which is 2.7 times higher than the levels of this receptor on cells derived from PBS-treated mice (CD25lo). The four depletion curves were fitted at once by adjusting a single parameter (P<0.05). (E) IL-2Rα expression levels among activated Teff cells increase with peptide stimulation (38 h). Saturating levels of IL-2 does not restore full IL-2Rα upregulation for cells stimulated with low-antigen concentrations. Blocking IL-2 decreases IL-2Rα levels for intermediate peptide stimulation. Error bars for Figure 3C and E are smaller than the graph symbols.
Having identified this positive feedback link between IL-2 and IL-2Rα upregulation, we next quantified how IL-2R levels on Treg cells control their efficiency for binding, metabolizing and thereby scavenging IL-2 from the extracellular environment, as this correlates with their suppressive functionality (Barthlott et al, 2005; Pandiyan et al, 2007). Figure 2D shows how sensitivity to IL-2, as measured by the pSTAT5 amplitude, directly correlates with the capacity to bind IL-2 into a stable IL-2/IL-2R complex. As IL-2 is rapidly internalized and degraded once bound to the full IL-2R complex (Smith and Cantrell, 1985; Hemar et al, 1995), the direct relationship between IL-2 binding, pSTAT5 response, and IL-2 depletion led us to hypothesize that Treg cells’ capacity to scavenge IL-2 could vary greatly according to their IL-2Rα levels.
To quantify rates of IL-2 depletion by Treg cells (a straightforward measurement, as these cells do not produce IL-2), we compared the IL-2 concentrations over time in four cultures differing in both the density of the Treg cells as well as in the initial IL-2Rα levels, obtained by pre-exposure to IL-2 (see the Materials and methods section). When exposed to 4 pM of extracellular IL-2, Treg cells whose IL-2Rα levels are upregulated by a factor of 2.7 (geometrical mean) depleted this cytokine 1.6±0.3 times faster than those with basal IL-2Rα levels. Practically, this faster depletion can decrease IL-2 levels below functional significance (0.1 pmol) after 24 h, while slower depletion may leave enough IL-2 (>1 pmol) for pSTAT5 response (Figure 3D). This enhanced rate of IL-2 depletion is quantitatively explained by our biochemical model that takes into account concomitant IL-2Rα upregulation and IL-2 endocytosis (fits in Figure 3D). These measurements, along with a 10-min depletion assay presented in Supplementary information 7, validated our computer model (Figure 2E) quantifying the variable ability of Treg cells to deplete IL-2 from the extracellular environment. Note that Treg cells that have been pre-exposed to IL-2, ensuing upregulation of their IL-2Rα levels, become more efficient at IL-2 depletion. Hence, we have quantified how Treg cells deplete IL-2 significantly and dynamically in vitro.
In Teff cells, IL-2Rα expression is inducible and regulated by several transcription factors activated by both antigen stimulation and cytokine signals (Kim et al, 2006). We found that IL-2Rα levels on the fraction of Teff cells that are activated and express IL-2Rα correlate with agonist peptide concentration (Figure 3E). When TCR activation is suboptimal due to low antigen concentrations, IL-2 enhances the upregulation of IL-2Rα levels in the activated population. By comparison, when TCR activation is strong due to a higher-antigen concentration, IL-2 is not required to induce high densities of IL-2Rα on Teff cells (Figure 3E). Using these results, together with insights from Figure 2, we could establish a causal link between strong TCR stimulation, high IL-2Rα levels and elevated sensitivity to IL-2, that would lead to enhanced STAT5 phosphorylation, and thereby decreased cell death (Ihle, 2001).
Variability of IL-2Rα upregulation in cocultures of Teff and Treg cells
So far, our findings have shown that both Teff and Treg cells are able to upregulate their sensitivity to IL-2 when being exposed to this very cytokine. To investigate whether this has the potential to affect the behavior of a population of T cells, we next tested whether the IL-2 that Teff cells secrete upon activation can be sufficient to induce IL-2Rα upregulation in neighboring Treg cells. We cocultured Treg cells (sorted as an endogenous cohort of CD4+CD25+ cells within a population of B10.A splenocytes), and naive T cells from 5C.C7 TCR-transgenic mice that become Teff cells upon activation with the peptide antigen K5 presented by B10.A splenocytes (Krogsgaard et al, 2003). In our assay, most polyclonal Treg cells are not TCR activated by this specific antigen. We found that after 27 h, the IL-2 produced by peptide-activated Teff cells indeed induced 10-fold upregulation of IL-2Rα on Treg cells (Figure 4A), and that this effect could be reversed by treatment with IL-2 blocking antibodies, indicating that this upregulation was due to IL-2 binding. Therefore, due to their persistent expression of fully functional IL-2Rs, following antigen stimulation of neighboring naive Teff cells, Treg cells can improve their capacity to scavenge IL-2 by rapidly increasing their IL-2Rα chain densities.
Figure 4.

Variable IL-2Rα upregulation in cocultures of Treg and Teff cells after 24 h of antigen activation. (A) Non-TCR-activated Treg cells upregulate IL-2Rα when cocultured with antigen-activated Teff cells. Reversal of this effect by IL-2 blocking antibodies shows that this IL-2Rα upregulation is specifically triggered by the IL-2 secreted by neighboring Teff cells. (B) The presence of Treg cells decreases IL-2Rα levels for weakly (1 nM, left panel) but not strongly (1 μM, right panel) stimulated Teff cells. This effect is only partially reversible by addition of exogenous IL-2. (C) IL-2Rα levels (of 200 representative cells) and their geometrical mean on peptide-stimulated Teff and non-TCR-activated Treg cells cocultured with different antigen doses. For the effector cells, the geometrical mean is taken over the IL-2Rα+ population only.
As IL-2Rα chain densities on Teff cells are influenced by both antigen concentrations and IL-2 concentrations, we measured IL-2Rα levels on antigen-activated Teff cells in the presence or absence of Treg cells (Figure 3E). The presence of Treg cells resulted in a reduction of IL-2Rα levels on Teff cells activated at low-antigen concentrations, but not at saturating antigen concentrations (Figure 4B). This decreased expression of IL-2Rα in weakly activated cells can only be partially reversed by a saturating concentration of IL-2, suggesting that additional Treg suppressive mechanisms, besides IL-2 consumption, may be acting in parallel to alter IL-2Rα levels (von Boehmer, 2005). As shown previously (Figure 2), Teff cells with higher IL-2Rα levels can sense lower concentrations of IL-2 and should thus be less sensitive to IL-2 scavenging by Treg cells. On the other hand, higher IL-2Rα levels on Treg cells make these better IL-2 scavengers. Thus, by comparing IL-2Rα levels on cocultured Treg and Teff cells, we uncovered a critical crossover between the IL-2Rα levels on the Teff- and Treg-cell populations: at low-peptide concentrations, Treg cells have higher IL-2Rα levels than activated Teff cells, but this is reversed at high peptide concentrations (Figure 4C). This implies great plasticity in the ability of Teff versus Treg cells to take advantage of the shared pool of secreted IL-2.
Computer model: Treg can inflict a ‘double hit’ on Teff cells by depleting the available IL-2 and reducing their IL-2Rα levels
To test the significance of this dynamic competition for IL-2 between Teff and Treg cells and capture the dynamics of each of their respective IL-2/IL-2R signaling pathways, we built a computational model (see Materials and methods). This model incorporates our measurement of IL-2 signaling at the single-cell level (Figure 2), our measurement of IL-2 depletion (Figure 3), and negative- and positive-feedback loops for IL-2 production and receptor levels, respectively (Figure 4; Supplementary information 1). The negative regulation of IL-2 by pSTAT5 causes IL-2 secretion and accumulation to be transient and constitutes a major difference between our model and that presented in Busse et al (2010) in which IL-2 secretion is bistable due to positive feedback with pSTAT5. A more complete model including spatial resolution and accounting for IL-2 diffusion in the extracellular medium yields comparable results (see Supplementary information 8). Note that, given our experimental settings, we are able to model our system in a well-mixed manner. This assumption was validated experimentally by comparing the pSTAT5 response of T cells in our experimental settings, to the same pSTAT5 response when the same T cells have been stripped of their bound IL-2 and re-exposed to their original supernatant after mixing (Supplementary information 9). We found that these two pSTAT5 responses were similar thus validating our well-mixed approximation in our model.
We simulated the first 60 h of T-cell activation for different cell densities as well as for different rates of IL-2 production and IL-2Rα expression (Kemp et al, 2007), both in the presence or absence of Treg cells. Given the experimentally measured parameters included in the simulation, we found that Treg cells can indeed deplete IL-2 and limit IL-2Rα upregulation thereby inflicting a ‘double hit’ on weakly activated Teff cells that stifles pSTAT5 response (Figure 5A and B). The model predicted that strongly activated Teff cells will manage to express IL-2Rα at higher levels than the Treg cells, thereby maintaining high phosphorylation of STAT5 despite enhanced IL-2 depletion by Treg cells (Figure 5C and D). Hence, the effect of Treg cells on strongly activated Teff cells remains minimal, and Teff cells are able to proliferate in response to even low IL-2 concentrations.
Figure 5.

Computer simulations of the IL-2 tug-of-war between Teff and Treg cells. (A–D) We modeled in silico the first 60 h of activation of a culture of Teff cells (7 strongly activated or 70 weakly activated cells per μl) in the presence or absence of 70 Treg cells per μl. We plot the simulated numbers of IL-2Rα and pSTAT5/cell, and the simulated IL-2 concentration (in fMol) in the medium. We present two extreme cases illustrating how Treg cells can suppress pSTAT5 in weakly activated cells at a high density (arrow, panel B), while marginally affecting pSTAT5 for strongly activated cells in a smaller density (arrow, panel D). We chose these conditions such that, in the absence of Treg cells, the IL-2 levels secreted in both cases were matched (panels A and C); the major difference between these two cases is then the maximal IL-2Rα levels that the cells present on their surface upon activation. Note that simulating the system with a heterogeneous population of T cells was found not to affect modeling predictions for our experimental setting (our unpublished data). Hence, in our present model, all Teff cells share the same activation strength, and all Treg cells share the same level of IL-2Rα. (E) Computer prediction of a differential effect of Treg cells on the quorum-sensing threshold for STAT5 phosphorylation of strongly activated versus weakly activated Teff cells. We compute the total pSTAT5 (in molecules/cell) generated after 60 h in individual Teff cells, simulated at varied density with or without an equal density of Treg cells.
To make further progress we tested numerically how different densities of Teff cells (under weak or strong antigen stimulation) are affected by the presence of an equal number of Treg cells (Figure 5E). For strong stimulation, we found a ‘quorum-sensing’ threshold (Surette et al, 1999; Burroughs et al, 2006), as a minimal number of cells is necessary to secrete enough IL-2 leading to sustained pSTAT5 levels. This threshold is not affected by the addition of Treg cells. For weaker activation, the minimal density of cells that sustain pSTAT5 increases because of diminished IL-2 secretion and diminished expression of IL-2Rα. For these weakly activated Teff cells, the addition of Treg cells completely inhibits the simulated pSTAT5 response (Figure 5E). Hence, our model has unraveled the intricate cell-density-dependent dynamics of IL-2 regulation that explains the plasticity of Teff/Treg competition.
In vitro validation of computer model predictions
Next, we went on to test the key prediction from our model: whether this IL-2 depletion by Treg cells indeed acts as a core mechanism to suppress differentially a large number of weakly activated cells but not strongly activated ones, even in small numbers (Sakaguchi et al, 2009). We cultured 5C.C7 TCR-transgenic T cells with Treg-depleted B10.A splenocytes and a low concentration of antigenic peptide. We found that little IL-2 accumulated in the medium and little pSTAT5 was generated at low cell densities (<10 cells/μl) (Figure 6A). However, increasing the density to >100 cells/μl led to higher concentrations of secreted IL-2, thereby increasing the fraction of cells phosphorylating STAT5. This clearly demonstrates that autocrine signaling (whereby each cell responds to its own secreted cytokine) is negligible in our experimental settings, while it is the paracrine loop (whereby cells contribute a shared secreted IL-2) that drives STAT5 response (see Supplementary information 9 for further discussion). As predicted by our simulations (Figure 5E), this ‘quorum-sensing’ mechanism could enable the expansion of weakly activated cells when cultured at a sufficient density. Our model predicted that this expansion should be actively disrupted by the presence of Treg cells.
Figure 6.

Treg cells inflict an IL-2Rα /IL-2 double hit to differentially suppress a large number of weakly activated but not a small number of strongly activated effector cells in vitro. (A) pSTAT5 response for 5C.C7 T cells at 46 h of stimulation with 0.3 μM K5 (the red line is a simple dose-response fit and a guide to the eyes). Although all cells were stimulated by the same antigen dose, only those at high densities sense IL-2 and phosphorylate STAT5. At low densities, cells do not sense IL-2 at all, ruling out the possibility of an autocrine loop. (B) IL-2 concentrations are similar for many weakly or a few strongly activated cells (60 000 cells with 2 nM of K5 peptide versus 3000 cells with 100 nM K5). When we added 60 000 Treg cells (yielding a ratio of Teff:Treg cells of 1:1 or 1:20), we found a similar scavenging effect for IL-2. (C–F) Comparing pSTAT5 levels in effector cells in the presence or absence of Treg cells at 37 h (C–D) or at 61 h (E–F) reveals a marked specific suppression of weakly activated effector cells only (D, F). (G, H) Suppression of proliferation, as measured by CFSE dilution at 61 h, is more pronounced for many weakly activated effector cells (H) than for a few strongly activated cells (G). (I) Treg cells suppress the proliferation of Teff cells better for cells undergoing weak antigen activation ([K5]=0.3 nmol) compared to cells undergoing strong antigen activation ([K5]=200 nmol). The suppression index is defined as the ratio of the numbers of Teff cells undergoing proliferation in the presence of Treg cells with the numbers of Teff cells undergoing proliferation in the absence of Treg cells after peptide stimulation. These data were pooled from four separate experiments.
Accordingly, we tested how Treg cells affect phospho-STAT5 levels in Teff cells depending on activation conditions. We measured a marked decrease in IL-2 concentrations when Teff cells were cocultured with complete splenocytes compared with Treg-depleted splenocytes (Figure 6B). We then confirmed our model predictions presented in Figure 5: Treg cells induce a marked decrease in STAT5 phosphorylation in Teff cells, by limiting IL-2Rα upregulation and depleting IL-2 (Supplementary information 10–12). This double hit suppressed weakly activated Teff cells even at high density, but not strongly activated Teff cells at lower density, both in terms of STAT5 phosphorylation (Figure 6C–F) and proliferative capacity (Figure 6G–I). This suppressive effect is enhanced if IL-2Rα levels on Treg cells are upregulated by pre-exposure to IL-2 in vitro (Supplementary information 13) again consistently with our model predictions. Note that IL-2 is dramatically lowered and pSTAT5 is slightly decreased in Teff cells in the presence of Treg cells for strongly activated cells, Figure 6B and E. This is consistent with our model (Figure 5B, D, and E): at high-cell density, in the presence of Treg cells, cells consume IL-2 so efficiently they may reduce slightly the amount of phosphorylated STAT5 per strongly activated Teff cell (Figure 6E); this decrease was predicted by our model (Figure 5C and D). To conclude, our in vitro measurements confirm that the plasticity of Treg suppression is based on the dynamic regulation of IL-2 competition.
Pre-exposure to IL-2 limits the proliferation of Teff cells in vivo
Finally, we tested whether our theoretical model and in vitro results provided key insights and predictions for an in vivo model of T-cell proliferation (Figure 7A). We used adoptive transfer of CFSE-labeled TCR-transgenic T cells and immunization with agonist peptide to quantify the proliferation of these cells with or without additional exposure to IL-2. Similar to the in vitro observation described above (Figure 3C), Treg cells also upregulate IL-2Rα (CD25) levels in response to IL-2 exposure in vivo. We compared IL-2Rα levels in the spleen of naive mice treated with four intra-peritoneal injections of 1.5 μg human IL-2 during 24 h, with control mice injected with carrier PBS. While we found no significant differences in cell numbers, or frequencies of CD4+ or CD4+FoxP3+ Treg cells (see Supplementary information 14), we report here a marked increase (by three-fold) in IL-2Rα levels accompanied by an increase in IL-2Rβ levels on Foxp3+ cells in IL-2-treated mice (Figure 7B; Supplementary information 14). This is consistent with the fact that, in naive mice, normally only Treg cells constitutively express IL-2Rα, and thereby are capable of forming a high-affinity trimeric IL-2r that can signal.
Figure 7.

Early administration of IL-2 has a suppressive effect on Teff cell proliferation upon peptide immunization in vivo. (A) Experimental protocol (asterisks indicate additional i.p. injection of 1.5 μg of rhIL-2 for the control experiment presented in Figure 7D). (B) CD4+Foxp3+ Treg cells, but not CD4+Foxp3− Teff cells, respond to four in vivo injections of 1.5 μg rhIL-2, over 36 h before immunization, by upregulating IL-2Rα levels (PBS is used as a negative control). (C) CFSE dilution in Teff cells 36 h after immunization. (D) IL-2-treated and PBS-treated (control) mice before immunization reveal a significant negative effect of early IL-2 administration on the percentages of cells that start dividing following immunization (↓). However, IL-2 treatment post-immunization compensates for this defective proliferation (marked with * in Figure 7A and with ↑ in this panel).
In a subsequent experiment, we adoptively transferred 1 million CFSE-labeled 5C.C7 TCR-transgenic Rag2−/− lymphocytes in congenic recipients. We then injected intraperitoneally four doses of 1.5 μg of IL-2 or PBS carrier within 24 h (Figure 7A). Twelve hours after the last injection, we immunized these mice with 10 μg of MCC-102S peptide and 10 ng of LPS. Thirty-six hours post-immunization, we harvested the spleens, and analyzed the proliferation of 5C.C7 cells (Figure 7C). We found that mice that were pre-exposed to IL-2 (and had upregulated the IL-2Rα levels in their Treg cells; Figure 7B), created an environment that limited Teff cell proliferation. The number of cells that started to proliferate after 36 h of exposure to the antigen was reduced by half if the mice had been pre-exposed to IL-2 (Figure 7D).
To rule out possible effect of IL-2 pre-exposure that would not be Treg mediated, we verified that CD4− splenocytes fraction from either IL-2 or PBS pre-treated B10.A mice can comparatively stimulate 5C.C7 cells, in vitro (Supplementary information 15). Furthermore, we used an adoptive transfer strategy to rule out possible off-target effects on the host environment. As described in Supplementary information 16, Treg cells were isolated from mice that were injected with IL-2 or PBS and adoptively transferred along with 5C.C7 splenocytes into CD3ε−/− mice on which immunizations were performed: suppression of Teff cell proliferation in the presence of IL-2 pre-exposed Treg cells (see Supplementary information 13) is consistent with the results in Figure 7C. We went on to confirm that IL-2 is indeed the limiting factor during Teff proliferation when Treg cells have upregulated IL-2Rα: further injections of IL-2 were performed after immunization and abrogated the suppression observed when mice were pre-exposed to IL-2 (Figure 7D). These in vivo results concur with predictions derived from our in vitro and in silico models: IL-2 leads to upregulation of IL-2Rα in Treg cells, that correlates with their enhanced suppressive capacity for Teff proliferation.
Discussion
In this paper, we have analyzed quantitatively how IL-2 critically regulates immune responses and enforces ligand discrimination at the systems level. In particular, we quantitatively analyzed how the competition for IL-2 shapes the proliferative response of a population of Teff cells when Treg cells are present. Both Teff and Treg cells rely on IL-2 for the upregulation of their surface IL-2Rα (Figure 3), such that the binding of this shared cytokine to one of these cell types often comes at the expense of the other. Consequently, one must account for potential plasticity in the competition for IL-2. Treg cells express IL-2Rα constitutively, and are the first cells to bind (O’Gorman et al, 2009) and degrade IL-2 produced by neighboring Teff cells upon stimulation (Figure 3F). This drives IL-2Rα upregulation on Treg cells, accelerating their capacity to scavenge IL-2 (Figure 3D). As Teff cells are dependent on IL-2 to survive and proliferate, this cytokine depletion can severely impede their clonal expansion. On the other hand, upon binding IL-2, Teff cells also upregulate IL-2Rα, thereby increasing their affinity for IL-2, and consequently, their resistance to its depletion (Figure 2). Hence, there exists a tug-of-war for IL-2 between Teff and Treg cells controlling the decision between proliferation or the lack thereof (Sakaguchi et al, 2009).
Recently, Busse et al presented a model for such IL-2 competition between Teff and Treg cells, and emphasized, in particular, that the expression of IL-2Rα in Teff cells is all-or-none after 72 h of activation in vitro. This contribution addressed how Treg cells could suppress Teff cells at a distance, via competition for IL-2, see Figure 5 in Busse et al (2010). This is particularly significant as the lack of suppression for Teff cells when Treg cells are separated by a filter membrane (so-called transwell assay) has frequently been misinterpreted as a need for cell–cell contact in Treg suppression (Thornton and Shevach, 1998). Indeed, in transwell assays, cytokine communication (e.g. IL-2 competition) is delayed by diffusion in a way that may generate false-negative results (Pandiyan et al, 2007; Shevach, 2009) (our unpublished data). Busse et al's contribution demonstrates how competition for IL-2 without cell–cell contact may be sufficient for Treg suppression.
However, our experimental results and current knowledge drawn from the literature challenge some of the premises for Busse et al's model, and justify the need for an alternative model like the one introduced here.
First, Busse et al's model is critically dependent on autocrine loops in cytokine regulation of Teff cells. Yet the relevance of autocrine loops for IL-2 in these cells can be ruled out experimentally. For example, upon diluting a population of activated T cells to low densities (<100 cells/μl), we could not detect any phosphorylation of STAT5 while some of the cells were producing IL-2 (as measured with a cytokine capture assay); separately, we checked that these cells could respond to a high dose of IL-2 (our unpublished data). Hence, IL-2 can feedback on T-cell activation via a paracrine loop but not an autocrine loop. Similar observations have been previously reported in an in vivo model of infection (Long and Adler, 2006). Thus, any model of IL-2 regulation cannot rely on autocrine regulation of this cytokine to understand Teff/Treg competition.
Busse et al's model also functions with low expression levels of IL-2 receptors (e.g. 6000 IL-2Rα/cell), such that it takes >60 pMol of accumulated IL-2 to get any IL-2 responsiveness in Teff cells. Our single-cell measurements highlight how varied and significant IL-2Rα levels can be in Teff cells (from 0 to 3 × 10⁵ copies; see Supplementary information 2E), with responsiveness down to 100 fMol (Figure 2E). A linear relationship between bound IL-2 and IL-2Rα levels was uncovered previously (Supplementary information 1 of Busse et al), but this is insufficient to predict STAT5 phosphorylation, as the complete tetrameric assembly of the IL-2/IL-2R complex is required for signaling (Figure 2G).
There exist further discrepancies in the experimental observations that stress the incompatibilities of our model. Busse et al report digital regulation of IL-2Rα, but this is accurate only after 72 h of culture in vitro, when cells undergo proliferation. At shorter time scales (<60 h), we found that IL-2Rα levels are in fact extremely varied (Figures 2A, 3, and 4). Busse et al's model predicted that IL-2 could not accumulate away from the cells, because of autocrine capture: our experimental measurements report bulk levels of IL-2 as large as 100 pMol at earlier time, 24 h post-activation (Figure 6B). We also checked that there is no heterogeneity in IL-2 response, by comparing pSTAT5 response in our cell cultures, to their pSTAT5 response in well-mixed conditions (Supplementary information 9).
Finally, Busse et al's model comprises a positive feedback loop for the production of IL-2 by Teff cells, upon sensing IL-2. This positive feedback appears to drive the digital profile in IL-2Rα levels, and maintains high concentrations of IL-2 after 10 h of simulated time and at later time points, cf Figure 2C in Busse et al (2010). However, our measurements on IL-2 concentrations in cultures of Teff and Treg cells show that IL-2 is rapidly consumed by these cells, thus availability of secreted IL-2 is transient (Figure 6B; Supplementary information 9B). Our results are consistent with the strong negative feedback on IL-2 production reported by others (Kim et al, 2006; Villarino et al, 2007), and the transient nature of IL-2 accumulation (Sojka et al, 2004).
Owing to these observations, we posit that Busse et al's model operates with an IL-2 feedback and an overall parameter regime that are incompatible with our new experimental results. Hence, the quantitative mechanism for immune regulation derived previously (Busse et al, 2010) could not be validated in vitro. Our new measurements (Figures 2, 3, 4 and 5) allowed us to introduce an alternative quantitative model for IL-2 regulation, based on differential signaling through IL-2R, and dynamic feedback regulation for Teff and Treg cells. Our model firmly establishes the quantitative role of the competition for IL-2 to shape the balance between immune tolerance and immune response (Figure 8). Of note, the validity and functional relevance of our quantitative model was tested with quantitative predictions from our model that we validated experimentally in vivo (Figure 7).
Figure 8.

Sketch of the differential suppression by Treg cells, based on the ‘double hit’ cytokine depletion mechanism. Empty green circles denote Teff cells and full red circles denote Treg cells. Increased font size for IL-2Rα and IL-2 is used to signify increased levels for these receptor and cytokine. This sketch summarizes how Treg cells can suppress pSTAT5 and proliferation signals in large numbers of weakly activated Teff cells, while allowing a small number of strongly activated Teff cells to maintain pSTAT5 and proliferate.
By developing a new computational model to account for this dynamic competition for IL-2 between T cells, we were able to predict and subsequently validate experimentally that Treg cells can suppress large densities of weakly activated Teff cells while strongly activated Teff cells, due to their high expression levels of IL-2Rα, are unaffected by the presence of Treg cells (Figure 8). Hence, our theoretical framework provides a mechanistic explanation for the large plasticity of suppression of Teff cells by Treg cells (Sojka et al, 2005; Stephens et al, 2005; Tran et al, 2009). Other mechanisms of suppression (e.g. the role of CTLA-4 or the competition for IL-6 in Th17/Treg balance) will need to be considered to estimate their quantitative relevance to Treg function.
Our study also emphasizes how critical it is to combine both theoretical modeling and experimental measurement of T-cell function at the level of individual cells instead of simply monitoring a population average. At a given IL-2 concentration, only a fraction of cells, as determined by their IL-2Rα levels, will receive a survival signal or scavenge the cytokine. Thus, the plastic regulation of IL-2 among T cells can be viewed as a means to maintain a flexible balance at the population level that leads either to the onset or to the suppression of immune responses. Subtle disruptions in this balance, either because of genetic defects (Vella et al, 2005; Brand et al, 2007; Yamanouchi et al, 2007) or by direct application of IL-2 (Brandenburg et al, 2008; Tang et al, 2008), have been shown to strongly affect the inception of autoimmune disorders with potential therapeutic implications. For example, a controlled regimen of IL-2 injection could restore the Treg/Teff balance and block the onset of diabetes in NOD mice (Tang et al, 2008). In another study, Webster et al (2009) injected IL-2/antibody complexes in mice for 3 days, and recorded a robust expansion of the Treg pool and enhanced tolerance and resistance to EAE or diabetes. Our system is more contained: we tested effects of IL-2 injection (without crosslinking/activating S4B6 antibody) on <3-day short time scales (Figure 7). In particular, we did not record any enlargement of the Treg pool in the IL-2-injected mice (Supplementary information 14). But our computational model (Figure 5) also highlights how higher levels of IL-2Rα in an expanding Treg cell pool could account for their enhanced suppressive capacity in the experiments by Webster et al (2009) (see their Figures 1D and 2C) as well as in the experiments by Tang et al (2008) (see their Figure 4A), and others’ (Pandiyan et al, 2007). More generally, our quantitative understanding of the IL-2 competition between Treg and Teff cells opens new avenues to manipulate the balance between immune tolerance and immune responsiveness (Figure 7). Additional mechanisms of suppression, e.g. IL-10 secretion, CTLA-4 upregulation, etc. (von Boehmer, 2005), will need to be added to our model to refine our quantitative understanding of the function of Treg cells. Moreover, spatial considerations, as suggested in Busse et al (2010), might have a critical function in regulating the IL-2 competition between Treg and Teff cells: future work will include the diffusion of this cytokine in more realistic confined geometry, in addition to the signaling feedback regulation quantified in the model presented here.
To conclude, by combining single-cell measurement and quantitative modeling of pSTAT5 responses in T cells, we have established quantitative rules for the IL-2 tug-of-war between Treg and Teff cells. Timing, molecular cell surface densities, free molecular concentrations, and competition for cytokine secretion and sensing are critical characteristics of immune responses that classical genetic approaches cannot quantify (Tomlin and Axelrod, 2007; Schulz et al, 2009). Particularly, our study demonstrates for the first time how qualitative functional consequences of weak versus strong antigenic recognition leads to exquisitely sensitive feedback regulation of the IL-2/IL-2R signaling system and enforces self-/non-self-discrimination at the system level. We anticipate that such quantitative modeling combined with experimental single-cell resolution of molecular expression will be an increasingly useful method to dissect how cytokine regulation and competition dynamically shape cellular responses in the immune system.
Materials and methods
Mice
Breeding pairs of 5C.C7 TCR-transgenic Rag2−/− (Seder et al, 1992), B10A CD3ε−/− and B10.A mice were obtained from Taconic (Hudson, NY). These mice were bred, and maintained in the animal facilities of the Memorial Sloan-Kettering Cancer Center (MSKCC) according to our institutional guidelines. All experiments were performed with mice of age between 1 and 3 months.
Media
All in vitro experiments were performed in complemented RPMI medium, prepared by the Media facility at MSKCC. It consists of RPMI 1640 supplemented with 10% heat-inactivated fetal bovine serum, 2 mM L-glutamine, 10 mM HEPES (pH 7.4), 0.1 mM non-essential amino acids, 1 mM sodium pyruvate, 100 μg/ml of penicillin, and 100 μg/ml of streptomycin and 50 μM of β-mercaptoethanol. All cell cultures were maintained in an incubator at 37°C with 5% CO2.
Reagents and antibodies
Recombinant methionyl human IL-2 (hIL-2) was obtained from Amgen (Thousand Oaks, CA). Recombinant mouse IL-2 (mIL-2) was obtained from eBioscience, CA. The following antibodies were used: anti-CD3(2C11), anti-CD4 (RM4–5) (APC-Cy7), anti-IL-2Rα (anti-CD25, PC61) (PE-Cy7), anti-IL-2Rα (anti-CD25, 7D4) (biotin), anti-CD28(35.51), anti-IL-2Rβ (anti-CD122, Tm.b1) (biotin or PE) were from BD Bioscience (San Jose, CA); anti-phospho-STAT5(Tyr 694) was from Cell Signaling; anti-Rabbit IgG (APC) from Jackson ImmunoResearch (West Grove, PA); Mouse non-lytic IL-2/Fc fusion protein was from Chimerigen (Allston, MA). DAPI and CFSE dyes were obtained from Fluka/Sigma/Aldrich (St Louis, MO).
All staining were performed in FACS buffer (PBS with 4% fetal calf serum (FCS) and 0.1% sodium azide). All flow cytometer acquisitions were performed on a LSR-II machine (Beckton-Dickinson, San Jose, CA). Special care was taken to set up the compensation matrix with single-stained samples before each acquisition.
Cell preparation
CD4+CD25+ cells were purified from a cell suspension harvested from B10.A spleen and lymp nodes, using a MACS Treg-cell isolation kit (Miltenyi Biotec, Auburn, CA) according to the manufacturer's instructions. In other experiments, CD25+ cells were depleted using a MACS CD25 microbead kit (Miltenyi Biotec). 5C.C7 T cells were collected from the spleen and lymph nodes of the 5C.C7 TCR-transgenic Rag2−/− mouse.
CFSE labeling
5C.C7 splenocytes were labeled with 2 μM CFSE for 10 min at 37°C. Excess unreacted CFSE was removed with two cold washed with RPMI. Cells were placed in culture in vitro, or washed in PBS and adoptively transferred immediately after labeling.
Measuring pSTAT5 response to varying IL-2 concentrations
We used 5C.C7 T cells that were cultured for 48–72 h in the presence of irradiated APCs (from B10A spleens) and 100 nM K5. This cell culture maximizes the heterogeneity in IL-2Rα expression. Cells were then collected and dead cells removed by centrifugation on a ficoll gradient (GE, Uppsala, Sweden). Bound IL-2 was stripped from cell surface by a 2-min incubation with 0.1 M Glycine buffer equilibrated at pH 4.0, followed by a 5-min wash in RPMI (Duprez et al, 1988). Cells were then aliquoted and exposed to different concentrations of IL-2 for 10 min in 37°C.
Single-cell staining
Following protocols optimized by the Nolan group (Krutzik et al, 2005). Cells were fixed by 15 min incubation in 1.6% paraformaldehyde in PBS. In experiments where cells were stained directly after culture fixation was stopped after 10 min, followed by surface staining with biotinilated anti-IL-2Rα antibody, followed by 5 extra minutes in 1.6% PFA. After spinning down the cells, they were resuspended in 90% MeOH on ice (or at −20°C for overnight storage). Cells were then washed twice in staining buffer and stained intracellularly for pSTAT5 or rIgG Isotype control and different combinations of CD4, IL-2Rα, IL-2Rβ, and streptavidin (for surface IL-2Rα).
To measure the correlation between IL-2 binding and STAT5 phosphorylation, we used T-cell blasts that were stripped of surface IL-2 (see above; Duprez et al, 1988). Cells were then exposed to 100 pmol IL-2-Fc fusion protein and incubated for 60 min at 37°C. Cells were then washed, fixed with ice-cold 1.6% paraformaldehyde for 10 min, and permeabilized with ice-cold methanol (90% in water) for 10 min. Cells were then washed twice with FACS buffer, and stained for pSTAT5 (primary staining) then anti-rabbit(PE)+anti-mouse(APC)+ anti-IL-2Rα(PECy7).
IL-2 depletion
B10.A mice were administered intraperitoneally with four doses of either 1.5 μg of hIL-2 or PBS during a period of 24 h. The spleen and lymph nodes of the mice were harvested about 10 h after final injection and CD4+ cells were isolated by negative selection with a cocktail of antibodies (against CD8α+, Ter119+, CD11β+, CD45r+, and CD49β+) using the miltenyi magnetic bead kit. Cells were counted before experiment to ensure a known number of CD4+CD25+ cells. Cells were then placed into 96-well plates, 150 μl per condition in the presence of a known amount of mIL-2. Supernatants were collected at different time points for analysis by ELISA, in some of these times, cells were restained for IL-2Rα and IL-2Rβ levels to track the changes in their expression over time.
Biochemical model for STAT5 signaling and IL-2 depletion
We developed a biochemical model to simulate the binding of soluble IL-2 onto a heterogeneous population of cells expressing varied levels of IL-2Rα and the IL-2Rβ•IL-2Rγ complex (IL-2R denotes the full-trimeric complex IL-2Rα•IL-2Rβ•IL-2Rγ). The cell population was binned into N groups depending on their receptor levels, each group (indexed by i) may hold an arbitrary number of cells which are considered identical. This model expands the ligand/receptor interaction section specified in Table I to N bins and consists of 4 × N+1 rate equations:
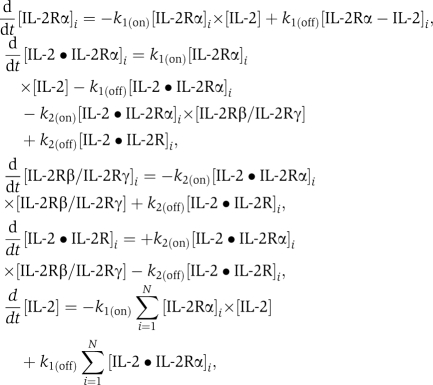 |
where k1(on)=1.4 × 10⁷/mol/s, k1(off)=0.4/s, and k2(off)=2.3 × 10⁻⁴/s were previously directly measured (Wang and Smith, 1987). As a simplification that had no influence on model results (see Supplementary information 6), IL-2Rβ binding and IL-2Rγ binding to IL-2•IL-2Rα complex were considered as a single-dynamical step (rather than two subsequent steps); the symbol IL-2Rβ/IL-2Rγ should be taken to signify this fact and does not imply a pre-formed complex. In these equations, the brackets [ ] designate bulk concentration in pM which was calculated for surface receptors, by multiplying the number of receptors/cell by the total number of cells in the bin and dividing by Na Avogadro's number and the total volume. k2(on) was fit as described in the main text. The actual value for each bin is k2(on)=3.3 × 10−4 × 10−12 × Na × (DensityofCell)−1, where DensityofCell is the number of cells in bin divided by the total volume. This set of differential equations were solved using MATLAB software and simulated deterministically for a period of 10 min that is shorter than the half-life of the IL-2•IL-2r complex so that receptor internalization could be neglected (Duprez et al, 1991).
Table 1. List of parameters for biochemical model.
| Reaction | On rate | Off rate |
|---|---|---|
| Ligand receptor interaction | ||
| IL-2+IL-2Rα↔IL-2•IL-2Rα | 1.4 × 10⁷/mol/s | 0.4/s |
| IL-2•IL-2Rα+IL-2Rβ/IL-2Rγ ↔ IL-2•IL-2Rα•IL-2Rβ•IL-2Rγ | 3 × 10⁻⁴/s | 2.3 × 10⁻⁴/s |
| Reaction | On rate | Off rate |
| Signaling and regulation | ||
| IL-2Rα → ∅ | 5 × 10⁻⁵/s | |
| IL-2Rβ/IL-2Rγ → ∅ | 5 × 10⁻⁴/s | |
| IL-2•IL-2Rα•IL-2Rβ•IL-2Rγ → ∅ | 1.1 × 10⁻³/s | |
| IL-2•IL-2Rα•IL-2Rβ•IL-2Rγ+STAT5 → IL-2•IL-2Rα•IL-2Rβ•IL-2Rγ+pSTAT5 | 1 × 10⁻⁴/s | |
| pSTAT5 → STAT5 | 10−2/s | |
| pSTAT5+PromoterIL-2Rα↔pSTAT5•PromoterIL-2Rα | 1.2 × 10⁻⁵/s | 2 × 10²/s |
| pSTAT5+PromoterIL-2Rβ/IL-2Rγ↔ pSTAT5•PromoterIL-2Rβ/IL-2Rγ | 1.2 × 10⁻⁴/s | 2 × 10²/s |
| pSTAT5+PromoterIL-2 → pSTAT5•PromoterIL-2 | 1.2 × 10⁻⁷/s | |
| Protein (inducer) | Expression rate | |
| Expression levels | ||
| IL-2Rα transcription (TCR induced) | 0.4/s (Treg); 0.25/s (Teff) | |
| IL-2Rα transcription (TCR+pSTAT5 induced) | 2.7/s (Treg); 2.8/s (Teff) | |
| IL-2Rβ/IL-2Rγ transcription (TCR induced) | 0.1/s (Treg, Teff) | |
| IL-2Rβ/IL-2Rγ transcription (TCR+pSTAT5 induced) | 0.2/s (Treg, Teff) | |
| IL-2 transcription (TCR induced) | 0 (Treg), 0.7/s (Teff) | |
| IL-2 transcription (TCR+pSTAT5 induced) | 0 (Treg), 0.18/s (strong Teff) | |
| Molecule | Copies/cell | |
| Initial values | ||
| IL-2Rα | 104 (Treg) 0 (Teff) | |
| IL-2Rβ/IL-2Rγ | 3 × 10² | |
| STAT5 | 2 × 10³ | |
| PromoterIL-2Rα | 2 | |
| PromoterIL-2Rβ/IL-2Rγ | 2 | |
| PromoterIL-2 | 2 | |
We checked that the map of STAT5 phosphorylation for varied levels of IL-2Rα was identical for Treg and Teff cells (Supplementary information 5), hence we used the same equations and parameters (ligand and receptor section of Table I) to model types of T cells. To estimate IL-2 depletion for extended period of times, the 10-min simulation was iterated many times when the final IL-2 concentration of one run is used as the initial concentration of the next. The half-lifetime of the full complex before depleted by 15 min, while the other half stays bound to the cells’ surface as a starting condition for the following iteration. In these fits, all cells were assumed to have a constant IL-2Rβ expression of 1000 receptors/cell. IL-2Rα levels change over long periods of time. Rather than simulating them, these levels were measured at multiple time points during the depletion experiments and a smooth interpolation between these measurements was used as the parameterized heterogeneity during the simulation.
Dynamical model for the competition for IL-2 between Treg and Teff cells
A dynamical model for the regulation of IL-2Rα, IL-2Rβ, and extracellular IL-2 was simulated using BioNetGen rule based modeling software (Blinov et al, 2004). The simulation includes the following processes for Teff cells (as detailed in Table I):
IL-2 binding to IL-2R. Here, we incorporate our two-step, short time scale biochemical model of IL-2/IL-2R binding (cf Figure 2) as a module in this longer time scale simulation. Full IL-2•IL-2R complexes are endocytosed with a typical time scale of 15 min (Hemar et al, 1995).
STAT5 dynamics. Including binding of STAT5 unto full IL-2•IL-2r complexes leading to its phosphorylation and STAT5 dephosphorylation.
IL-2 dynamics. IL-2 production commences at t=0 and scales with TCR activation strength (Kemp et al, 2007), the maximal single-cell secretion rate is 150 secreted molecules/min—this number is estimated using measurements from Sojka et al (2004). Upon endocytosis, IL-2 is degraded. IL-2 secretion downregulation as a function of STAT5 is modeled as pSTAT5 binding to the IL-2 promoter region, irreversibly limiting further IL-2 production (Villarino et al, 2007).
IL-2Rα dynamics. IL-2Rα upregulation commences at t=0 and scales with TCR activation strength, maximal expression rates are at 90 molecules/cell (this was calibrated with our measurements of the steady-state expression of IL-2Rα on Treg cells, see below). Further IL-2Rα upregulation as a function of STAT5 phosphorylation is modeled by its increased production rate (by a factor of ∼6 over the TCR-induced production rate) upon reversible binding of pSTAT5 unto the promoter region of the IL-2Rα gene. Unbound IL-2Rα receptors are endocytosed with a slow time scale of 5 h (Duprez and Dautry-Varsat, 1986) IL-2Rα homeostasis is maintained both by recycling of endocytosed receptors (Hemar et al, 1995) and by new synthesis of IL-2Rα.
IL-2Rβ dynamics. IL-2Rβ upregulation commences at t=0. Upon endocytosis, IL-2Rβ is degraded (Hemar et al, 1995). Further, IL-2Rβ upregulation as a function of STAT5 phosphorylation is modeled by its increased production rate upon reversible binding of pSTAT5 unto the IL-2Rβ promoter region. Unbound IL-2Rβ subunits degrade with a typical time scale of 1 h (Hemar et al, 1995).
Initial conditions. At t=0, Teff cells express 103 copies of IL-2Rβ and no IL-2Rα. The IL-2 concentration is set to 0.
For Treg cells, the same rules apply with two exceptions: Treg cells do not secrete any IL-2 and have 104 copies of the IL-2Rα receptor at t=0. The IL-2Rα expression rate on in the absence of pSTAT5 signaling was calibrated to be 25 units/min to maintain a steady state of 10 000 receptors/cell before stimulation. IL-2Rβ production rates were set in a similar manner and assumed to be identical between Teff and Treg cells.
Our computer simulation includes a large number of processes and experimentally validated parameters (see Table I); it provides valuable dynamical insight into the competition between Treg and Teff cells. Simulations included either one effector cell, one effector cell and one regulatory cell or one effector cell and 10 regulatory cells (Figure 5D). We simulated these few cells in rescaled volumes to achieve varied cell densities: that practically modeled the dynamics of varying cell numbers, in a constant volume of 150 μl as used in our experimental setup.
Weakly activated cells were modeled with production rates for IL-2 and IL-2Rα that are 10-fold lower than those in strongly activated cells. Treg cells were modeled to have intermediate, IL-2Rα production rates: half a decade below strongly activated cells and half a decade above weakly activated cells. The model simulation runs under well-mixed conditions. The simulation was run stochastically using the Gillespie algorithm. Simulation codes will be provided upon request.
Classic suppression assay with anti-CD3/anti-CD28 stimulation)
CFSE-stained CD4+ T cells from 5C.C7 TCR-transgenic Rag2−/− mice were cultured in U-bottom wells in 150 μl of RPMI with soluble anti-CD3 and anti-CD28 each at 0.1 μg/ml. The cells were cultured either in the presence or absence of CD4+CD25+ cells isolated from naive B10.A spleens and lymph nodes using the Miltenyi isolation kit (see reagents). Varying numbers of 5C.C7 and CD4+CD25+ cells were mixed for different experiments.
Suppression assay with antigen stimulation
CFSE-stained CD4+ T cells from 5C.C7 TCR-transgenic Rag2−/− mice were cultured in flat-bottom wells in 150 μl of RPMI. The cells were cocultured with either B10.A splenocytes or B10.A splenocytes depleted of CD25+ cells by negative selection with the Miltenyi kit. We divided these splenocytes such that there were 50 000 Treg cells/well. Prior to culture, it was verified that the number of CD4−CD8− of B10.A splenocytes per well is matched between the two conditions. For antigenic stimulation, different concentrations of K5 (typically between 0.1 nM and 1 μM) were added to the wells at t=0. We have verified that this suppression assay leads to a decrease in the numbers of dividing effector cells (see Figure 6G–I).
In vivo upregulation of IL-2Rα in Treg cells upon exposure to IL-2
B10.A mice were administered intraperitoneally with four doses of either 1.5 μg hIL-2 (Amgen) or carrier PBS during a period of 24 h. Mice were then euthanized, spleen and lymph nodes (inguinal and axillary) were harvested, and cells were stained for surface CD4 and IL-2Rα and intracellular FoxP3.
In vivo activation of T cells with/without pre-exposure to IL-2
In all, 1 Million 5C.C7 CD4+ cells were stained with CFSE and adoptively transferred into naive B10.A recipient mice. Twenty-four hours later, these B10.A mice were intraperitoneally administered four doses of either 1.5 μg hIL-2 (Amgen) or carrier PBS during a period of 24 h. Nine hours after the last IL-2 dose, the mice were immunized intraperitoneally with 10 μg of MCC-102S peptide and 0.1 ng LPS. The mice were euthanized 36 h later, and the spleen was stained for CD4 and IL-2Rα. In control experiments, 1.5 μg hIL-2 was administered once with immunization then 4, 9, 22, and 29 h post-immunization prior to euthanization 36 h post-immunization.
A variant of this assay was performed to isolate the effect of Treg cells on cells on effector proliferation in vivo. B10.A mice were intraperitoneally administered either IL-2 or PBS, as above. Spleens and lymph nodes were then harvested and Treg cells isolated using a Miltenyi kit. We then adoptively transferred, by tail-end injection, the isolated Treg cells (that have undergone either PBS or IL-2 pre-treatment), 1 Million CFSE-labeled 5C.C7 effector cells into B10.A CD3ε−/− recipient mice. We cotransferred 20 Million splenocytes from a wild-type B10.A mouse to prevent lymphopenic expansion. Eight hours later, mice were immunized with MCC-102S peptide and LPS, as described above. Spleens were harvested 45 h after immunization, stained for CD4 and the Vβ-3 chain of the 5C.C7 TCR and analyzed for CFSE dilution by FACS.
Measurement of IL-2 concentrations in supernatants by ELISA
Supernatants were collected and stored at −20°C. In all, 96-well EIA/RIA plates from Corning (NY) were pre-coated with 2 μg/ml of IL-2 capturing antibody (JES6-1A12, eBioscience) in coating buffer (0.1 NaHCO3 in PBS, pH 8.2) by incubating over night at 4°C. Plates were then washed and blocked for 2 h in 10% FCS in PBS. Washes with PBS Tween 0.05% were performed following each step. Plates were then incubated with the thawed supernatants overnight at 4°C Following a 1-h incubation in 100 μl/well of 1 μg/ml biotinilated IL-2 detection antibody (JES6-5H4, eBioscience) and 10% FCS in PBS. Plates were incubated for a further hour at room temperature in 100 μl/well of 1.5 μg/ml alkalaine phophotase (SigmaFAST, Sigma) and 10% FCS in PBS followed by a washes with PBS Tween and then distilled water. Finally, wells were incubated with 100 μl of PNPP tablets in a TRIS buffer (SigmaFAST, Sigma) for about 30 min in the dark and analyzed by a Emax (Molecular Devices) plate reader for absorbance at 405 nM. Results were analyzed by MATLAB software using calibration wells with an IL-2 titration. Error bars were estimated by computing the standard deviation between two different sets of calibration wells.
Supplementary Material
Supplementary online materials
Acknowledgments
We thank Alexander Rudensky, Derek Sant’Angelo, Li-Fan Lu, Marcel van den Brink, Michael Farrar, Nihal Altan-Bonnet, Ron Germain, and Warren Leonard for useful discussions; Ottum Rao and Nuri Yim for technical support; OF is supported by a Burroughs-Wellcome Career Award at the Scientific Interface. TE acknowledges support for TE from an Alfred P Sloan Foundation Fellowship and support for GJ and MS from NSF grant #CCF-0829836. GA-B is the incumbent of a Bristol-Myers Squibb/James D Robinson III junior faculty chair at MSKCC. GA-B acknowledges support from an NSF grant #0848030, an NIH grant AI083408, and a CTSC grant from Cornell-Weill Medical College.
Author contributions: OF and GA-B designed and performed the experiments, as well as developed the original theoretical model. KT, JWC, and KAS contributed to the experimental effort. GJ, MH, MWS, and TE contributed to the modeling effort.
Footnotes
The authors declare that they have no conflict of interest.
References
- Altan-Bonnet G, Germain RN (2005) Modeling T cell antigen discrimination based on feedback control of digital ERK responses. PLoS Biol 3: e356. [DOI] [PMC free article] [PubMed] [Google Scholar]
- Barthlott T, Moncrieffe H, Veldhoen M, Atkins CJ, Christensen J, O’Garra A, Stockinger B (2005) CD25+ CD4+ T cells compete with naive CD4+ T cells for IL-2 and exploit it for the induction of IL-10 production. Int Immunol 17: 279–288 [DOI] [PubMed] [Google Scholar]
- Belkaid Y, Piccirillo CA, Mendez S, Shevach EM, Sacks DL (2002) CD4+CD25+ regulatory T cells control Leishmania major persistence and immunity. Nature 420: 502–507 [DOI] [PubMed] [Google Scholar]
- Blinov ML, Faeder JR, Goldstein B, Hlavacek WS (2004) BioNetGen: software for rule-based modeling of signal transduction based on the interactions of molecular domains. Bioinformatics 20: 3289–3291 [DOI] [PubMed] [Google Scholar]
- Brand OJ, Lowe CE, Heward JM, Franklyn JA, Cooper JD, Todd JA, Gough SC (2007) Association of the interleukin-2 receptor alpha (IL-2Ralpha)/CD25 gene region with Graves’ disease using a multilocus test and tag SNPs. Clin Endocrinol (Oxf) 66: 508–512 [DOI] [PubMed] [Google Scholar]
- Brandenburg S, Takahashi T, de la Rosa M, Janke M, Karsten G, Muzzulini T, Orinska Z, Bulfone-Paus S, Scheffold A (2008) IL-2 induces in vivo suppression by CD4(+)CD25(+)Foxp3(+) regulatory T cells. Eur J Immunol 38: 1643–1653 [DOI] [PubMed] [Google Scholar]
- Burroughs NJ, Miguel Paz Mendes de Oliveira B, Adrego Pinto A (2006) Regulatory T cell adjustment of quorum growth thresholds and the control of local immune responses. J Theor Biol 241: 134–141 [DOI] [PubMed] [Google Scholar]
- Busse D, de la Rosa M, Hobiger K, Thurley K, Flossdorf M, Scheffold A, Hofer T (2010) Competing feedback loops shape IL-2 signaling between helper and regulatory T lymphocytes in cellular microenvironments. Proc Natl Acad Sci U S A 107: 3058–3063 [DOI] [PMC free article] [PubMed] [Google Scholar]
- Cantrell DA, Smith KA (1984) The interleukin-2 T-cell system: a new cell growth model. Science 224: 1312–1316 [DOI] [PubMed] [Google Scholar]
- Chen Y, Inobe J, Kuchroo VK, Baron JL, Janeway CA. Jr, Weiner HL (1996) Oral tolerance in myelin basic protein T-cell receptor transgenic mice: suppression of autoimmune encephalomyelitis and dose-dependent induction of regulatory cells. Proc Natl Acad Sci U S A 93: 388–391 [DOI] [PMC free article] [PubMed] [Google Scholar]
- Davis MM, Boniface JJ, Reich Z, Lyons D, Hampl J, Arden B, Chien Y (1998) Ligand recognition by alpha beta T cell receptors. Annu Rev Immunol 16: 523–544 [DOI] [PubMed] [Google Scholar]
- Duprez V, Cornet V, Dautry-Varsat A (1988) Down-regulation of high affinity interleukin 2 receptors in a human tumor T cell line. Interleukin 2 increases the rate of surface receptor decay. J Biol Chem 263: 12860–12865 [PubMed] [Google Scholar]
- Duprez V, Dautry-Varsat A (1986) Receptor-mediated endocytosis of interleukin 2 in a human tumor T cell line. Degradation of interleukin 2 and evidence for the absence of recycling of interleukin receptors. J Biol Chem 261: 15450–15454 [PubMed] [Google Scholar]
- Duprez V, Ferrer M, Cornet V, Olive D, Dautry-Varsat A (1991) Modulation of interleukin 2 internalization and interleukin 2-dependent cell growth by antireceptor antibodies. J Biol Chem 266: 1497–1501 [PubMed] [Google Scholar]
- Feinerman O, Veiga J, Dorfman JR, Germain RN, Altan-Bonnet G (2008) Variability and robustness in T cell activation from regulated heterogeneity in protein levels. Science 321: 1081–1084 [DOI] [PMC free article] [PubMed] [Google Scholar]
- Forsten KE, Lauffenburger DA (1994) The role of low-affinity interleukin-2 receptors in autocrine ligand binding: alternative mechanisms for enhanced binding effect. Mol Immunol 31: 739–751 [DOI] [PubMed] [Google Scholar]
- George TC, Bilsborough J, Viney JL, Norment AM (2003) High antigen dose and activated dendritic cells enable Th cells to escape regulatory T cell-mediated suppression in vitro. Eur J Immunol 33: 502–511 [DOI] [PubMed] [Google Scholar]
- Hemar A, Subtil A, Lieb M, Morelon E, Hellio R, Dautry-Varsat A (1995) Endocytosis of interleukin 2 receptors in human T lymphocytes: distinct intracellular localization and fate of the receptor alpha, beta, and gamma chains. J Cell Biol 129: 55–64 [DOI] [PMC free article] [PubMed] [Google Scholar]
- Horak I, Lohler J, Ma A, Smith KA (1995) Interleukin-2 deficient mice: a new model to study autoimmunity and self-tolerance. Immunol Rev 148: 35–44 [DOI] [PubMed] [Google Scholar]
- Ihle JN (2001) The Stat family in cytokine signaling. Curr Opin Cell Biol 13: 211–217 [DOI] [PubMed] [Google Scholar]
- Irvine DJ, Purbhoo MA, Krogsgaard M, Davis MM (2002) Direct observation of ligand recognition by T cells. Nature 419: 845–849 [DOI] [PubMed] [Google Scholar]
- Kemp ML, Wille L, Lewis CL, Nicholson LB, Lauffenburger DA (2007) Quantitative network signal combinations downstream of TCR activation can predict IL-2 production response. J Immunol 178: 4984–4992 [DOI] [PubMed] [Google Scholar]
- Kim HP, Imbert J, Leonard WJ (2006) Both integrated and differential regulation of components of the IL-2/IL-2 receptor system. Cytokine Growth Factor Rev 17: 349–366 [DOI] [PubMed] [Google Scholar]
- Kim HP, Kelly J, Leonard WJ (2001) The basis for IL-2-induced IL-2 receptor alpha chain gene regulation: importance of two widely separated IL-2 response elements. Immunity 15: 159–172 [DOI] [PubMed] [Google Scholar]
- Krogsgaard M, Prado N, Adams EJ, He XL, Chow DC, Wilson DB, Garcia KC, Davis MM (2003) Evidence that structural rearrangements and/or flexibility during TCR binding can contribute to T cell activation. Mol Cell 12: 1367–1378 [DOI] [PubMed] [Google Scholar]
- Krutzik PO, Clutter MR, Nolan GP (2005) Coordinate analysis of murine immune cell surface markers and intracellular phosphoproteins by flow cytometry. J Immunol 175: 2357–2365 [DOI] [PubMed] [Google Scholar]
- Lenardo MJ (1991) Interleukin-2 programs mouse alpha beta T lymphocytes for apoptosis. Nature 353: 858–861 [DOI] [PubMed] [Google Scholar]
- Lin JX, Leonard WJ (2000) The role of Stat5a and Stat5b in signaling by IL-2 family cytokines. Oncogene 19: 2566–2576 [DOI] [PubMed] [Google Scholar]
- Long M, Adler AJ (2006) Cutting edge: paracrine, but not autocrine, IL-2 signaling is sustained during early antiviral CD4 T cell response. J Immunol 177: 4257–4261 [DOI] [PMC free article] [PubMed] [Google Scholar]
- Lund JM, Hsing L, Pham TT, Rudensky AY (2008) Coordination of early protective immunity to viral infection by regulatory T cells. Science 320: 1220–1224 [DOI] [PMC free article] [PubMed] [Google Scholar]
- O’Gorman WE, Dooms H, Thorne SH, Kuswanto WF, Simonds EF, Krutzik PO, Nolan GP, Abbas AK (2009) The initial phase of an immune response functions to activate regulatory T cells. J Immunol 183: 332–339 [DOI] [PMC free article] [PubMed] [Google Scholar]
- Pandiyan P, Zheng L, Ishihara S, Reed J, Lenardo MJ (2007) CD4+CD25+Foxp3+ regulatory T cells induce cytokine deprivation-mediated apoptosis of effector CD4+ T cells. Nat Immunol 8: 1353–1362 [DOI] [PubMed] [Google Scholar]
- Pasare C, Medzhitov R (2003) Toll pathway-dependent blockade of CD4+CD25+ T cell-mediated suppression by dendritic cells. Science 299: 1033–1036 [DOI] [PubMed] [Google Scholar]
- Pillet AH, Lavergne V, Pasquier V, Gesbert F, Thèze J, Rose T (2010) IL-2 induces conformational changes in its preassembled receptor core, which then migrates in lipid raft and binds to the cytoskeleton meshwork. J Mol Biol 403: 671–692 [DOI] [PubMed] [Google Scholar]
- Sakaguchi S (2004) Naturally arising CD4+ regulatory t cells for immunologic self-tolerance and negative control of immune responses. Annu Rev Immunol 22: 531–562 [DOI] [PubMed] [Google Scholar]
- Sakaguchi S, Sakaguchi N, Asano M, Itoh M, Toda M (1995) Immunologic self-tolerance maintained by activated T cells expressing IL-2 receptor alpha-chains (CD25). Breakdown of a single mechanism of self-tolerance causes various autoimmune diseases. J Immunol 155: 1151–1164 [PubMed] [Google Scholar]
- Sakaguchi S, Wing K, Onishi Y, Prieto-Martin P, Yamaguchi T (2009) Regulatory T cells: how do they suppress immune responses? Int Immunol 21: 1105–1111 [DOI] [PubMed] [Google Scholar]
- Schorle H, Holtschke T, Hunig T, Schimpl A, Horak I (1991) Development and function of T cells in mice rendered interleukin-2 deficient by gene targeting. Nature 352: 621–624 [DOI] [PubMed] [Google Scholar]
- Schulz EG, Mariani L, Radbruch A, Hofer T (2009) Sequential polarization and imprinting of type 1 T helper lymphocytes by interferon-gamma and interleukin-12. Immunity 30: 673–683 [DOI] [PubMed] [Google Scholar]
- Seder RA, Paul WE, Davis MM, Fazekas de St Groth B (1992) The presence of interleukin 4 during in vitro priming determines the lymphokine-producing potential of CD4+ T cells from T cell receptor transgenic mice. J Exp Med 176: 1091–1098 [DOI] [PMC free article] [PubMed] [Google Scholar]
- Shevach EM (2009) Mechanisms of foxp3+ T regulatory cell-mediated suppression. Immunity 30: 636–645 [DOI] [PubMed] [Google Scholar]
- Smith KA (1984) Interleukin 2. Annu Rev Immunol 2: 319–333 [DOI] [PubMed] [Google Scholar]
- Smith KA, Cantrell DA (1985) Interleukin 2 regulates its own receptors. Proc Natl Acad Sci USA 82: 864–868 [DOI] [PMC free article] [PubMed] [Google Scholar]
- Sojka DK, Bruniquel D, Schwartz RH, Singh NJ (2004) IL-2 secretion by CD4+ T cells in vivo is rapid, transient, and influenced by TCR-specific competition. J Immunol 172: 6136–6143 [DOI] [PubMed] [Google Scholar]
- Sojka DK, Hughson A, Sukiennicki TL, Fowell DJ (2005) Early kinetic window of target T cell susceptibility to CD25+ regulatory T cell activity. J Immunol 175: 7274–7280 [DOI] [PubMed] [Google Scholar]
- Stephens LA, Gray D, Anderton SM (2005) CD4+CD25+ regulatory T cells limit the risk of autoimmune disease arising from T cell receptor crossreactivity. Proc Natl Acad Sci U S A 102: 17418–17423 [DOI] [PMC free article] [PubMed] [Google Scholar]
- Surette MG, Miller MB, Bassler BL (1999) Quorum sensing in Escherichia coli, Salmonella typhimurium, and Vibrio harveyi: a new family of genes responsible for autoinducer production. Proc Natl Acad Sci U S A 96: 1639–1644 [DOI] [PMC free article] [PubMed] [Google Scholar]
- Suzuki H, Kundig TM, Furlonger C, Wakeham A, Timms E, Matsuyama T, Schmits R, Simard JJ, Ohashi PS, Griesser H, Taniguchi T, Paige CJ, Mak TW (1995) Deregulated T cell activation and autoimmunity in mice lacking interleukin-2 receptor beta. Science 268: 1472–1476 [DOI] [PubMed] [Google Scholar]
- Tang Q, Adams JY, Penaranda C, Melli K, Piaggio E, Sgouroudis E, Piccirillo CA, Salomon BL, Bluestone JA (2008) Central role of defective interleukin-2 production in the triggering of islet autoimmune destruction. Immunity 28: 687–697 [DOI] [PMC free article] [PubMed] [Google Scholar]
- Thornton AM, Shevach EM (1998) CD4+CD25+ immunoregulatory T cells suppress polyclonal T cell activation in vitro by inhibiting interleukin 2 production. J Exp Med 188: 287–296 [DOI] [PMC free article] [PubMed] [Google Scholar]
- Tomlin CJ, Axelrod JD (2007) Biology by numbers: mathematical modelling in developmental biology. Nat Rev Genet 8: 331–340 [DOI] [PubMed] [Google Scholar]
- Tran DQ, Glass DD, Uzel G, Darnell DA, Spalding C, Holland SM, Shevach EM (2009) Analysis of adhesion molecules, target cells, and role of IL-2 in human FOXP3+ regulatory T cell suppressor function. J Immunol 182: 2929–2938 [DOI] [PMC free article] [PubMed] [Google Scholar]
- Vella A, Cooper JD, Lowe CE, Walker N, Nutland S, Widmer B, Jones R, Ring SM, McArdle W, Pembrey ME, Strachan DP, Dunger DB, Twells RC, Clayton DG, Todd JA (2005) Localization of a type 1 diabetes locus in the IL2RA/CD25 region by use of tag single-nucleotide polymorphisms. Am J Hum Genet 76: 773–779 [DOI] [PMC free article] [PubMed] [Google Scholar]
- Villarino AV, Tato CM, Stumhofer JS, Yao Z, Cui YK, Hennighausen L, O’Shea JJ, Hunter CA (2007) Helper T cell IL-2 production is limited by negative feedback and STAT-dependent cytokine signals. J Exp Med 204: 65–71 [DOI] [PMC free article] [PubMed] [Google Scholar]
- von Boehmer H (2005) Mechanisms of suppression by suppressor T cells. Nat Immunol 6: 338–344 [DOI] [PubMed] [Google Scholar]
- Wang HM, Smith KA (1987) The interleukin 2 receptor. Functional consequences of its bimolecular structure. J Exp Med 166: 1055–1069 [DOI] [PMC free article] [PubMed] [Google Scholar]
- Webster KE, Walters S, Kohler RE, Mrkvan T, Boyman O, Surh CD, Grey ST, Sprent J (2009) In vivo expansion of T reg cells with IL-2-mAb complexes: induction of resistance to EAE and long-term acceptance of islet allografts without immunosuppression. J Exp Med 206: 751–760 [DOI] [PMC free article] [PubMed] [Google Scholar]
- Willerford DM, Chen J, Ferry JA, Davidson L, Ma A, Alt FW (1995) Interleukin-2 receptor alpha chain regulates the size and content of the peripheral lymphoid compartment. Immunity 3: 521–530 [DOI] [PubMed] [Google Scholar]
- Yamanouchi J, Rainbow D, Serra P, Howlett S, Hunter K, Garner VE, Gonzalez-Munoz A, Clark J, Veijola R, Cubbon R, Chen SL, Rosa R, Cumiskey AM, Serreze DV, Gregory S, Rogers J, Lyons PA, Healy B, Smink LJ, Todd JA et al. (2007) Interleukin-2 gene variation impairs regulatory T cell function and causes autoimmunity. Nat Genet 39: 329–337 [DOI] [PMC free article] [PubMed] [Google Scholar]
Associated Data
This section collects any data citations, data availability statements, or supplementary materials included in this article.
Supplementary Materials
Supplementary online materials