

Abstract
The microRNA pathway participates in basic cellular processes and its discovery has enabled the development of si/shRNAs as powerful investigational tools and potential therapeutics. Based on a simple kinetic model of the mRNA life cycle, we hypothesized that mRNAs with high turnover rates may be more resistant to RNAi-mediated silencing. The results of a simple reporter experiment strongly supported this hypothesis. We followed this with a genome-wide scale analysis of a rich corpus of experiments, including RT–qPCR validation data for thousands of siRNAs, siRNA/microRNA overexpression data and mRNA stability data. We find that short-lived transcripts are less affected by microRNA overexpression, suggesting that microRNA target prediction would be improved if mRNA turnover rates were considered. Similarly, short-lived transcripts are more difficult to silence using siRNAs, and our results may explain why certain transcripts are inherently recalcitrant to perturbation by small RNAs.
Keywords: microRNA, mRNA decay, RNAi, siRNA
Introduction
What determines how strongly an mRNA responds to a microRNA or an siRNA? We know that properties of the sequence match between the small RNA and the mRNA are crucial. However, the same microRNA can repress different mRNAs to varying orders of magnitude, with no noticeable difference in features of the binding site (Lim et al, 2005; Grimson et al, 2007). Similarly, different siRNAs that are designed according to state-of-the-art guidelines will silence their target mRNAs to different degrees. In part, this may be explained by limitations in our understanding of small RNA-target recognition and the influence of various contextual features. However, large-scale validations of siRNA efficacies have shown that certain transcripts remain recalcitrant to perturbation even after repeated redesign of the siRNA (Krueger et al, 2007). Weak response to RNAi may thus be an inherent property of the mRNA, but the underlying factors have proven difficult to uncover.
Progress has been made in identifying features, which help predict the outcome of RNAi outside the specific micro/siRNA binding site. These include the contribution of local sequence context (Grimson et al, 2007), local RNA structure (Kertesz et al, 2007; Long et al, 2007), RNA-binding protein (RBP) motifs (Jacobsen et al, 2010), pre-existing endogenous microRNA regulation (Khan et al, 2009) and total target cellular abundance (Arvey et al, 2010). However, even taking these factors into account still leaves puzzling discrepancies in what we can explain or quantitatively predict.
siRNAs induce degradation by sequence-specific cleavage of their target mRNAs (Elbashir et al, 2001). MicroRNAs, too, induce mRNA degradation, and ∼80% of their effect on protein levels can be explained by changes in transcript abundance (Hendrickson et al, 2009; Guo et al, 2010). Given that multiple factors act simultaneously to degrade individual mRNAs, we here consider whether variable responses to micro/siRNA regulation may, in part, be explained simply by the basic dynamics of mRNA turnover. If a transcript is already under strong destabilizing regulation, it is theoretically possible that the relative change in abundance after the addition of a novel degrading factor would be less pronounced compared with a stable transcript (Figure 1). mRNA turnover is achieved by a multitude of factors in addition to small RNAs, such as those that act on AU-rich elements (AREs) and other destabilizing RBPs, although the relative contributions of these components are not known. The influence of such factors on small RNA targeting can be individually explored. However, their combined action, including yet unknown factors, is summarized into a single property: the mRNA decay rate.
Figure 1.

Schematic illustration. The relative change in degradation rate after perturbation of an mRNA by a small RNA will be different depending on the pre-existing degrading effect.
mRNA decay rates in animal cells are highly variable, with half-lives ranging from minutes to days (Ross, 1995). For instance, for mRNAs in mouse embryonic stem cells the median is around 7 h, whereas some genes, including Foxa2, Hes5 and Trib1, have half-lives under an hour (Sharova et al, 2009). We investigated the relationship between mRNA decay rates, mRNA abundance and susceptibility to small RNA perturbation using a mathematical model, a basic reporter experiment and analysis of a rich corpus of large-scale experiments, including RT–qPCR validation data for thousands of siRNAs, siRNA/microRNA overexpression data and mRNA stability data. Our theoretical analysis suggests that short-lived transcripts could be more difficult to perturb using microRNAs and siRNAs, and this is consistently supported by the experimental data.
Results
A basic model suggests a relationship between turnover rate and targetability
First, we explored the theoretical relationship between the pre-existing turnover rate of an mRNA, and its expected susceptibility to perturbation by a small RNA. We assumed a basic model of the mRNA life cycle, in which the rate of transcription is constant and the rate of degradation is described by first-order kinetics (see Materials and methods). We initially assumed that pre-existing cell-endogenous factors (e.g. microRNAs and RBPs) and an externally introduced or suddenly upregulated factor (e.g., an siRNA or a microRNA) act independently and contribute additively to the decay rate of an mRNA. Under this model, the relative change in steady-state expression level will become smaller as the pre-existing decay rate grows larger, independent of the transcription rate (Figure 2A). This relationship persists also if we assume various degrees of synergy and antagonism between the pre-existing factors and the external factor (described by an interaction coefficient q, see Materials and methods), with increasing synergism leading to transcripts being more equally targetable, regardless of their pre-existing decay rate. In this model, the pre-existing decay rate is a property of the target mRNA, while the introduced component describes the added effect of a specific small RNA. We can thus expect the size of the latter to be variable, and it is useful to think of the pre-existing decay rate as a factor that limits rather than determines the perturbation effect (Figure 2B).
Figure 2.

Theoretical variability in targeting efficacy as a function the pre-existing decay rate. (A) Various degrees of synergism and antagonism between pre-existing mRNA decay rate and the added contribution of an introduced degrading factor (e.g., an siRNA) were explored. The curves represent q=0 (additive model), q=−1 (antagonistic), q=−2 (suppressive) and q=1 and 5 (synergistic) (the interaction coefficient q is described in Materials and methods). (B) The exogenous component was randomized between 0 and 1 to describe variation in efficacy between different small RNAs (additive model).
Destabilization of a reporter transcript decreases targetability
We next investigated the predicted relationship between pre-existing mRNA stability and susceptibility to RNAi in a simple experimental system. We generated a series of four luciferase reporter constructs with destabilizing AREs of various strengths incorporated into their 3′ UTRs (Figure 3A). The strongest ARE in this series reduced the reporter signal to 46% compared with a non-destabilized construct (Figure 3B). This confirmed the activity of the AREs and corresponds to a 2.2-fold increase in turnover rate (assuming constant transcription rates and translation efficacies). To evaluate how the different constructs would respond to perturbation, we performed co-transfections with an siRNA targeted at the coding region of the luciferase gene. This reduced the signal of the non-destabilized construct to 26% compared with a control siRNA. In contrast, the most destabilized construct showed 42% remaining reporter activity compared with the control siRNA, and we could observe a dose–response relationship across the series (linear regression P<0.004, Figure 3C). Least-squares fitting of these results to our theoretical equations, based on standardized turnover rates estimated from Figure 3B, revealed that a weakly synergistic (q=0.45) model gave the closest fit. However, this model was marginally better than the additive case, and bootstrapping analysis showed that q was not significantly different from 0 (95% CI, −0.15 to 2.15) (Figure 3C). In conclusion, we observed changes in the ability of a reporter transcript to respond to siRNA perturbation (55% increase in residual signal), caused by a relatively small (2.2-fold) modulation of the turnover rate. mRNAs in the cell are known to exhibit a considerably broader range of turnover rates, motivating further investigation of this effect on real-world transcripts.
Figure 3.

Reporter experiments. (A) Schematic overview of luciferase reporter constructs harboring variable numbers of destabilizing (AUUU)n multimers (AREs) in their 3′ UTRs. n varied from 1 (non-functional ARE, ‘ΔARE’) to 7 (potent ARE). To keep UTR length constant, (AUUU) elements were never removed but rather replaced by non-functional (GUUU) elements (Zubiaga et al, 1995). (B) Relative luciferase signals from reporter constructs after transfection in HEK293 cells (normalized to Renilla luciferase). (C) Co-transfections with a luciferase siRNA. Bars show reporter activities in siLuc-transfected cells relative to a control siRNA (siCtrl), and error bars indicate s.e.m. (n=3). b=2.5% per (AUUU) repeat; 95% CI 1.2–3.7% using linear regression. White and gray bars show theoretically expected results (least-squares fitting) based on an additive (q=0) and a weakly synergistic (q=0.42) model (sum of squared errors=0.021 and 0.018, respectively).
High-turnover transcripts are more resistant to silencing using siRNAs
We tested the relationship between the efficacy of individual siRNAs, as determined using thousands of RT–qPCR measurements, and the turnover rates of their respective mRNA targets. First, in order to determine turnover rates for individual transcripts, we reanalyzed a microarray time series of HeLa cells that were transcriptionally inhibited using actinomycin D (Act D) (Iwamoto et al, 2008). Log2-transformed mRNA decay profiles were fit to a linear curve y=β1t+β0, where β1 is a decay rate coefficient related to half-life (t1/2=−1/β1, Figure 4A). Second, we analyzed a previously unpublished set of 2622 siRNAs, for which individual efficacies were determined using RT–qPCR 48 h post-transfection in HeLa cells (Supplementary Table 1) (www.appliedbiosystems.com). Of these, 1778 could be associated with a decay rate as determined above. Indeed, our results showed a relationship between the efficacy of an siRNA and the pre-existing turnover rate of the target transcript. Although the overall correlation between the two variables was modest (Spearman's rank correlation rs=0.22, P<1e−20), we found that siRNAs directed at high-turnover (t1/2<200 min) and medium-turnover (200<t1/2<1000 min) mRNAs caused significantly less repression than those targeting long-lived (t1/2>1000 min) transcripts (P<8e−11 and <4e−9, respectively, two-tailed KS-test, Figure 4B). While 41.6% (498/1196) of the siRNAs directed at low-turnover transcripts reached 10% remaining expression or better, only 16.7% (31/186) of the siRNAs that targeted high-turnover mRNAs reached this high degree of silencing (Figure 4B). Reduced targetability (25.2%, 100/396) was also seen for transcripts with medium turnover rate. We observed a similar trend using RT–qPCR and RT–PCR measurements from 87 si/shRNAs transfected into mouse embryonic stem cells (Ren et al, 2006), confirming these results in another cell type and using an independent set of turnover rate measurements (Sharova et al, 2009) (Supplementary Figure 1).
Figure 4.
Turnover rates influence siRNA efficacy. (A) Distribution of turnover rates for mRNAs in HeLa as determined using Act D chase. (B) RT–qPCR validation data for 1778 siRNAs. The scatter plot shows the obtained repression, indicated by the log2-transformed mRNA expression ratio, as a function of the mRNA decay slope β1. siRNAs were further grouped into three bins based on the half-life of their targets. The bars indicate the fraction of siRNAs in each bin that reached 10% remaining expression (90% silencing, −3.32 log2) or better. The cumulative distribution function (CDF) of log2-fold changes is indicated for each group. (C) Similar analysis on a per-gene basis. The plot only shows genes for which at least four siRNAs were evaluated. Source data is available for this figure at www.nature.com/msb.

We expect to see variability in efficacy among different siRNAs directed at the same target, due to properties of the siRNAs themselves. To account for this, we performed a gene level analysis that included only targets for which four or more siRNAs had been evaluated (n=50). Most of these extensively evaluated genes (40/50) could be silenced to 20% residual expression or lower by one or more siRNAs, and more than half (28/50) to 10%. However, a significant correlation between the two factors could still be observed (rs=0.29, P<0.05) and this relationship appeared to grow stronger when only considering genes for which five or six siRNAs had been evaluated (n=9, rs=0.53, P<0.15, Figure 4C). Taken together, these results show that high pre-existing mRNA turnover rate is associated with reduced susceptibility to silencing by siRNAs.
High-turnover transcripts are less influenced by microRNAs overexpressed in HeLa and HepG2 cells
siRNAs typically induce strong silencing by cleavage of their perfectly complementary targets, whereas microRNAs are guided by imperfect complementarity to induce deadenylation and subsequent degradation. On average, microRNAs have a weaker variable effect on a larger set of transcripts, and due to the limitations of microRNA target prediction not all putative targets will be altered. Nevertheless, the mode of action is similar enough to suggest that turnover rates could also be important for microRNA targeting. We assembled genome-wide mRNA expression data from 20 published microRNA transfections in HeLa cells (Supplementary Table 2) and defined predicted targets for these microRNAs. As expected, in 17 out of the 20 data sets, predicted target mRNAs with low turnover rates (as defined above) had stronger average repression than their high-turnover counterparts (Supplementary Figure 2). To quantify the effect, we pooled z-transformed expression changes from all 20 experiments. We found that predicted target mRNAs with short and medium half-life were significantly less repressed after transfection than their long-lived counterparts (P<8e−5 and P<0.03, respectively, two-tailed KS-test, Figure 5A). Specifically, 10.2% (293/2874) of long-lived targets versus 4.4% (41/942) of short-lived targets were strongly (z-score <−3) repressed.
Figure 5.
High-turnover mRNAs are less influenced by microRNA overexpression. (A) Genes were divided into three bins based on their half-lives (t1/2). The plot shows the cumulative distribution function (CDF) of relative mRNA expression levels after transfection of synthetic microRNAs. Z-normalized log2-transformed mRNA expression ratios from 20 microRNA overexpression experiments were pooled. The bar graphs indicate, for each half-life bin, the fraction of predicted targets or non-targets that were strongly repressed (z-score <−3). (B) Similar analysis based on a time series of miR-124 overexpression in HepG2 cells. Result shown is for 24 h after transfection. Source data is available for this figure at www.nature.com/msb.

To confirm these results in another cell type, we performed a similar analysis using a microarray time series of miR-124 overexpression in HepG2 cells (Wang, 2006), which was also the basis of a recent mRNA decay modeling study (Vohradsky et al, 2010). These data were combined with published decay rates for 3600 genes in the same cell line (Yang et al, 2003). Predicted targets with high turnover rates were more strongly affected, both in the early response after transfection (8 and 16 h) and at the end of the time series (120 h, Supplementary Figure 3). At 24 h, none of the predicted targets with high-turnover rates (t1/2<200 min) were repressed more than −1.5 log2, while 13% of predicted targets with t1/2>1000 min reached this level (P<0.02, Figure 5B).
High-turnover transcripts are more resistant to siRNA off-target effects
siRNAs are known to cause off-target effects that are mediated, in part, by microRNA-like seed complementarity (Jackson et al, 2006). Our results indicate that mRNA turnover rates could also influence seed-mediated off-target regulation. To investigate this, we analyzed changes in transcript levels after transfection of seven different siRNAs, each with a unique seed region (Jackson et al, 2006). Z-transformed expression changes from all seven experiments were pooled, and putative ‘off-targets’ were identified by mapping of non-conserved seed matches in 3′ UTRs. We found that low-turnover mRNAs (t1/2>1000 min) were more affected by seed-mediated off-target silencing than high-turnover mRNAs (t1/2<200 min), with twice as many long-lived seed-containing transcripts (3.8 versus 1.9%) being strongly (z-score <−3) repressed (Supplementary Figure 4).
Relationship between mRNA turnover rate, mRNA abundance and targetability
mRNA turnover rate is intimately coupled to mRNA abundance, as the steady-state levels of mRNAs having the same rate of transcription will be completely determined by their decay characteristics. We observed a modest but significant correlation (rs=−0.23, P<1e−20) between decay rate and abundance, indicating that abundance could have a predictive value on targetability (Supplementary Figure 5A). Indeed, we observed a negative correlation between target mRNA level and relative level after siRNA transfection (rs=−0.24, P<1e−20, Supplementary Figure 5B). Other factors related to mRNA turnover rate, such as UTR length and the number of conserved target sites for highly expressed microRNAs, were only weakly associated (rs=0.07 and 0.11, respectively). In contrast to turnover rate, the association between abundance and targetability became weaker when we considered the best siRNA out of several tested against the same gene (rs=−0.20 and −0.10 for four or five to six siRNAs, respectively, Supplementary Figure 5C). It should be noted that abundance here refers to the level of the target transcript, as opposed to previous work investigating the influence of the total abundance of competing targets in the cell (Arvey et al, 2010).
To assess whether turnover rate and abundance contributed independently to targetability, we combined the two using multiple linear regression on the full set of siRNAs (n=1778). Both were found to contribute significantly (βhalf-life=0.16; 95% CI 0.12–0.21, βabundance=−0.23; 95% CI −0.28 to −0.19), as we observed an increased correlation for the complete model compared with abundance or turnover rate alone (rs=0.31, determined leave-one-out cross-validation). The model was not further improved by incorporating UTR length and conserved sites as additional features. Interestingly, despite an overall correlation between abundance and targetability, mRNAs with high turnover rate remained difficult to repress regardless of their steady-state levels: siRNAs were divided into three bins based on their target mRNA levels (low, medium and high abundance; n=714, 806 and 258, respectively, Figure 6). For siRNAs targeting genes with t1/2<200 min, strong repression (<10% residual expression) was seen in only 18.0, 16.3 and 20.0% of the cases, respectively. In comparison, 28.3, 40.4 and 57.7% of siRNAs targeting genes with t1/2>200 min reached this level (Figure 6).
Figure 6.
High-turnover mRNAs are recalcitrant to repression, regardless of their steady-state levels. The color code indicates, for each individual siRNA, whether the achieved silencing was >90%. Multiple siRNAs targeting the same transcript are plotted in groups close to each other. siRNAs were divided into bins based on abundance and turnover rate, and the pie charts indicate the fraction of siRNA that reached 90% silencing or better in each bin. Source data is available for this figure at www.nature.com/msb.

In conclusion, mRNA abundance contributes additional information, with high abundance being associated with higher targetability. However, in accordance with our theoretical model, high turnover rate is associated with limited targetability also in the case of abundant transcripts.
Discussion
Starting with a basic model of the mRNA life cycle, we predicted that the pre-existing turnover rate of an mRNA should influence its susceptibility to perturbation by small RNA molecules. Assuming constant transcription rate, the relative mRNA level change will depend on the relative and not the absolute change in degradation rate. A simple experiment showed that introduction of destabilizing elements to a reporter transcript leads to attenuated siRNA silencing. Although our interpretation of the model was based on steady-state solutions and the reporter experiment represents a dynamic situation, the outcome was close to the expectation under a model where endogenous destabilizing factors and the exogenous agent (the siRNA) contribute additively to decay rate of the transcript.
We then present several independent lines of evidence for the inverse relationship between mRNA decay rates and susceptibility to small RNA perturbation on a genome-wide scale. The analysis of qPCR-based siRNA validation data shows that real-world high-turnover transcripts are more resistant to siRNA silencing. The correlation between achieved silencing and turnover rate is substantially stronger, if we only consider the most effective siRNA designed against a particular gene. Given that siRNA molecules cannot be infinitely efficient and that their concentrations during delivery must be kept within certain limits, this suggests that that as other aspects of siRNA targeting improve, we approach an upper bound to the level of silencing that can be achieved for any given turnover rate. The limitations may thus not be in the design of the molecule, but rather inherent to the target as a whole. This should reduce expectations and clarify observed inconsistencies between different levels of repression achieved. Our observations are consistent with a recent report, suggesting that unknown target-inherent factors may limit siRNA efficacy for certain genes (Krueger et al, 2007). These included two kinases, DGKE and ARHGAP27, which could not be efficiently silenced in HeLa cells, despite evaluation of 18 unique siRNAs. Interestingly, t1/2 for these genes is short (309 and 511 min, respectively), probably explaining the observed low efficacy. Differences in mRNA half-life may also explain why reporter vectors, containing cloned target sites, tend to be more efficiently silenced than the corresponding endogenous targets. Still, our analysis also shows that low turnover rate does not guarantee strong repression, and continued search for additional transcript-inherent properties that modulate RNAi susceptibility is therefore motivated.
We additionally observed that high transcript abundance was associated with high susceptibility to repression by siRNAs. This is intriguing as two earlier studies failed to show such a relationship (Krueger et al, 2007; Guo et al, 2010). Although we observed a similar effect for microRNAs (data not shown), it is in this case possible that fold changes of low-abundance transcripts could be compressed due to the limited signal-to-noise ratio of microarrays (Evans et al, 2003). A related technical explanation cannot be excluded for our siRNA analysis, but it seems less likely as it was based on RT–qPCR measurements, which have considerable dynamic range (Heid et al, 1996). Interestingly, the most abundant transcripts were usually associated with low turnover rates, although a technical artifact cannot be excluded (e.g., flattened decay curve due to saturation on the microarray). Importantly, however, abundant transcripts associated with high-turnover rates still remained difficult to repress, and multiple regression was used to show that the two factors contributed independent information about targetability. We also noted that the correlation between abundance and targetability was reduced when only considering the best out of four to six siRNAs designed against the same gene. In conclusion, abundance contributes additional information about targetability. However, whereas a simple model can explain the relationship between decay rate and targetability, the mechanism is less clear in the case of target abundance, and our results call for further investigation.
Modified siRNAs are being developed for therapeutic use, for instance in lowering LDL-cholesterol by targeting of APOB and PCSK9 (Zimmermann et al, 2006; Frank-Kamenetsky et al, 2008). On the whole, mRNAs display a wide range of stabilities in any given physiological condition, and different functional groups tend to have distinct, conserved half-life profiles (Yang et al, 2003). It follows therefore, that some groups of genes are more likely to be targetable by siRNAs than others. For instance, metabolic related genes (with low-turnover mRNAs) may be more targetable than apoptosis-related genes (Cheadle et al, 2005) and transcription factors (Yang et al, 2003), which tend to have shorter half-lives. For future choices of therapeutic targets in pathways of interest, mRNA half-life could be one factor to consider, as it may be beneficial to avoid inherently recalcitrant targets and instead focus of long-lived transcripts that are more likely to respond to perturbation. This may also allow the therapeutic index to be increased. We also show that siRNA off-target effects, mediated by seed complementarity, are more frequently seen on transcripts with low-turnover rates, thus suggesting that selecting seed sequences that preferably match high-turnover transcripts may reduce these effects.
microRNA target prediction typically involves sequence analysis to identify putative target sites, and the predicted strength of the interaction is judged from properties of the site or its immediate sequence context (John et al, 2004; Grun et al, 2005; Hammell et al, 2008; Friedman et al, 2009). When we analyzed genome-wide transcript level changes after microRNA overexpression, we found a relationship between the turnover rates of predicted target mRNAs and the extent to which they were repressed. The chance of observing strong repression was reduced by ∼50% for short-lived predicted targets compared with long-lived predicted targets. Recent work has suggested a move away from the binary distinction between mRNAs as ‘targets’ or ‘non-targets’, toward a more context-dependent and quantitative approach (Seitz, 2009; Arvey et al, 2010; Poliseno et al, 2010). Our work supports this view, in which an mRNA in one cell type may not be targetable by a microRNA or siRNA to the same extent in another cell type, depending on the turnover rate of the mRNA in that context. This suggests that future microRNA target prediction algorithms should benefit from the use of system-level properties such as pre-existing decay rates. We estimate that ∼11% of all genes expressed in HeLa cells have half-lives below 200 min, a figure that is likely translatable to other cells types, and specifically show that this category of genes is difficult to perturb using RNAi. Although this represents only a small fraction of the transcriptome, it still means that over 2000 protein-coding genes may be inherently more difficult to repress due to their high turnover rates.
In summary, mRNA turnover rates have an important influence on the changes exerted by small RNAs on mRNA levels. It can be assumed that mRNA half-lives will influence how mRNAs are differentially perturbed whenever small RNA levels change in the cell, not only after transfection but also during differentiation, pathogenesis and normal cell physiology.
Materials and methods
A basic model of mRNA turnover
We wanted to theoretically clarify the relationship between the pre-existing turnover rate of an mRNA, and its expected susceptibility to perturbation by a small RNA molecule. To do this, we assumed a basic model of the mRNA life cycle, in which the rate of transcription is constant and the rate of degradation is described by first-order kinetics. In a generalized form of this model, the derivative of the abundance of an mRNA can be described as
where α is the rate of transcription and f(μ, M) is the combined contributions of endogenous factors (μ) and an externally introduced factor (M) to the (specific) decay rate. If we assume additivity and independence, f would be simply the sum of the two factors. However, there are specific known cases of siRNAs and microRNAs acting in synergy (Vella et al, 2004; Grimson et al, 2007; Saetrom et al, 2007). It also cannot be excluded that the accumulated action of a multitude of heterogeneous degrading factors on an mRNA would, on average, eventually exhibit an antagonistic effect, because of, e.g., steric competition for access to the mRNA or flux limitations in the molecular components involved in degradation. To explore synergism and antagonism, we defined f as:
By modulating q, this function can be tuned to describe additive, synergistic, antagonistic and even suppressive interaction, where the addition of a second factor releases the effect of the first (Bollenbach et al, 2009) (Supplementary Figure S5). Steady-state equilibrium (y˙=0) is reached when
The relative abundance after introduction of an external destabilizing agent M can be therefore be described as
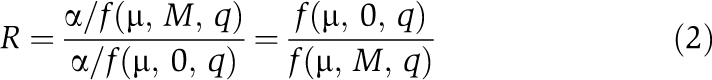 |
or, for the special case of additivity,
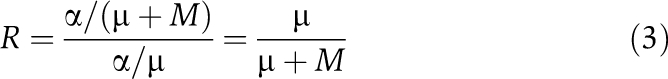 |
As the rate of transcription is eliminated, it does not influence susceptibility to perturbation under this basic model. The endogenous decay rate μ must be larger than zero, or the mRNA would accumulate indefinitely in the unperturbed cell.
We now explored how the relative abundance after perturbation, R, varies with μ, for simplicity using a fixed value for the exogenous component (M=1) (Figure 2A). As expected from Equation (3), the size of the perturbation becomes less pronounced as μ (the pre-existing endogenous degradation rate) grows large relative to M (the externally introduced perturbation) under a purely additive model. An antagonistic behavior will make this relationship stronger. Increasing synergism, on the other hand, will make transcripts more equally targetable, regardless of their endogenous decay rate.
Luciferase assays
A destabilizing (AUUU)7 multimer element (ARE) (Zubiaga et al, 1995) was cloned into the 3′ UTR of the pEZX-MT01 SV40-firefly luciferase reporter vector (Genecopoeia). Three mutated variants of this construct were generated, where 2, 4 or 6 of the adenosines were replaced by guanosines, the last representing a completely inactivated ARE. In addition, all constructs contained an identical 60 bp fragment from the mouse Fli1 3′ UTR (Larsson et al, 2009). Cloned sequences are listed in Supplementary Table 3 (mutations are indicated in bold). HEK293 cells, 25 000 per well, were seeded onto 24-well plates and cultured overnight in DMEM (10% FCS) without antibiotics. Co-transfections were performed using Lipofectamine 2000 (Invitrogen), according to the manufacturers instructions, and using 75 ng of plasmid DNA and 10 pmol of a custom siRNA directed against the coding region of the luciferase gene (siLuc) or a negative control siRNA (AM4636, Applied Biosystems). Firefly luciferase activity was assayed using the Dual-Luciferase Reporter System (Promega) after 52 h. Signals were normalized to the activity of the CMV-Renilla luciferase gene, which is built into pEZX-MT01.
Least-squares fitting
Based on Equation (1), and assuming turnover rates and translation efficacies to be constant, pre-existing turnover rates (μ) of the four constructs were estimated as 1/y, where y represents the reporter signal (0.47, 0.51, 0.75 and 1.00 on a standardized scale). We minimized the fit (sum of squared errors) of Equation (2) to the observed relative levels in Figure 3C, with the exogenous component M and the interaction coefficient q being the two unknown parameters. Due to the low dimensionality, this was done using exhaustive search of the solution space at high resolution. A bootstrapping strategy was applied to determine whether q was significantly different from 0. The observed luciferase data was resampled 1000 times with replacement and with the same sample size as the original data, and least-squares fitting of the model was performed on each sample. A 95% confidence interval was estimated by determining the 2.5th and 97.5th percentiles.
Determination of mRNA half-lives in HeLa cells
mRNA half-lives (t1/2) were determined by reanalysis of a 120-min, five time point, microarray (Affymetrix U133v2) time series of HeLa cells that were transcriptionally inhibited using Act D (Iwamoto et al, 2008). The arrays were annotated using gene-probeset mappings from the ENSEMBL database (Birney et al, 2004). Probesets mapping to more than one ENSEMBL gene were removed and probesets associated with the same gene were averaged, resulting in a final dataset covering 17849 unique ENSEMBL genes. Log2-transformed intensity values for each gene were fit to a linear curve y=β1t+β0, corresponding to an exponential decay model, where β0 is the initial intensity when Act D is added and β1 is a decay slope related to half-life (t1/2=−1/β1). Genes with a poor fit to this model (sum-of-squared errors >0.5) and genes with low expression in HeLa cells (signal intensity <100) were removed, eventually resulting in β1 coefficients being reliably determined for 8211 genes. Intensity values before Act D treatment (time point 0) were used as measurements of mRNA abundances in HeLa.
siRNA qPCR validation data
Overall, 4481 RT–qPCR measurements in HeLa (SYBR green or Taqman) for 2622 human Silencer® siRNAs covering 1105 unique genes were obtained from Applied Biosystems (www.appliedbiosystems.com). Replicate measurements (log2 scale) were averaged to produce one measure per unique siRNA. Half-life data, as described above, were available for 735 of these genes.
Assembly of microarray experiments from public repositories
We assembled microarray data from 20 microRNA-mimic overexpression experiments (Lim et al, 2005; Grimson et al, 2007; He et al, 2007; Linsley et al, 2007; Selbach et al, 2008; Gennarino et al, 2009) (Supplementary Table 2) and 7 siRNA overexpression experiments (Jackson et al, 2006) (MAPK14-1…7), all performed in HeLa cells. The 20 microRNA experiments were selected to represent a non-redundant set of microRNA families. In cases where we could identify more than one data set for the same microRNA family, the one showing the strongest regulation (as determined using the two-sample KS-test) of predicted targets versus remaining genes was selected. Redundant probes were averaged. Predicted targets were identified by mapping of microRNA and siRNA seed regions as described previously (Khan et al, 2009), requiring evolutionary conservation across four mammalian species for microRNAs and requiring presence of two non-conserved seed matches for siRNAs. Conserved sites for microRNAs with high endogenous expression was identified as described previously (Khan et al, 2009), in brief based on the 10 most abundant microRNA families in HeLa.
Multiple regression
We applied multiple linear regression, using least-squares minimization, as implemented in the Matlab Statistics Toolbox (Mathworks Inc.). The two predictor variables (turnover rate and mRNA abundance), as well as the response variable (log2 relative target mRNA level after siRNA transfection), were standardized by adjusting their means and standard deviations to 1. We employed leave-one-out cross-validation (n=1778) to assess whether the combined model had higher predictive power (as determined by Spearman's rank correlation rs) than either variable alone.
Supplementary Material
Supplementary figures S1–6, Supplementary tables S2–3
Efficacies of Silencer siRNAs in HeLa, as determined using RT-qPCR.
Acknowledgments
We are grateful to Applied Biosystems, notably, Susan Magdaleno and Daniel Williams, for providing access to their extensive set of siRNA validation results. We thank Martin Miller and Aaron Arvey for useful discussions and comments on the manuscript. Erik Larsson was supported by a postdoctoral fellowship from the Swedish Research Council. Author contributions:EL and DSM designed the research and performed data analysis. EL had the initial concept and implemented the computation and experiments. CS contributed to the modeling concepts and some text. EL, DSM, CS were involved in analytical discussions. EL, DSM wrote the paper and DSM led the project.
Footnotes
The authors declare that they have no conflict of interest.
References
- Arvey A, Larsson E, Sander C, Leslie CS, Marks DS (2010) Target mRNA abundance dilutes microRNA and siRNA activity. Mol Syst Biol 6: 363. [DOI] [PMC free article] [PubMed] [Google Scholar]
- Birney E, Andrews TD, Bevan P, Caccamo M, Chen Y, Clarke L, Coates G, Cuff J, Curwen V, Cutts T, Down T, Eyras E, Fernandez-Suarez XM, Gane P, Gibbins B, Gilbert J, Hammond M, Hotz HR, Iyer V, Jekosch K et al. (2004) An overview of Ensembl. Genome Res 14: 925–928 [DOI] [PMC free article] [PubMed] [Google Scholar]
- Bollenbach T, Quan S, Chait R, Kishony R (2009) Nonoptimal microbial response to antibiotics underlies suppressive drug interactions. Cell 139: 707–718 [DOI] [PMC free article] [PubMed] [Google Scholar]
- Cheadle C, Fan J, Cho-Chung YS, Werner T, Ray J, Do L, Gorospe M, Becker KG (2005) Control of gene expression during T cell activation: alternate regulation of mRNA transcription and mRNA stability. BMC Genomics 6: 75. [DOI] [PMC free article] [PubMed] [Google Scholar]
- Elbashir SM, Harborth J, Lendeckel W, Yalcin A, Weber K, Tuschl T (2001) Duplexes of 21-nucleotide RNAs mediate RNA interference in cultured mammalian cells. Nature 411: 494–498 [DOI] [PubMed] [Google Scholar]
- Evans SJ, Watson SJ, Akil H (2003) Evaluation of sensitivity, performance and reproducibility of microarray technology in neuronal tissue. Integr Comp Biol 6: 780–785 [DOI] [PubMed] [Google Scholar]
- Frank-Kamenetsky M, Grefhorst A, Anderson NN, Racie TS, Bramlage B, Akinc A, Butler D, Charisse K, Dorkin R, Fan Y, Gamba-Vitalo C, Hadwiger P, Jayaraman M, John M, Jayaprakash KN, Maier M, Nechev L, Rajeev KG, Read T, Rohl I et al. (2008) Therapeutic RNAi targeting PCSK9 acutely lowers plasma cholesterol in rodents and LDL cholesterol in nonhuman primates. Proc Natl Acad Sci USA 105: 11915–11920 [DOI] [PMC free article] [PubMed] [Google Scholar]
- Friedman RC, Farh KK, Burge CB, Bartel DP (2009) Most mammalian mRNAs are conserved targets of microRNAs. Genome Res 19: 92–105 [DOI] [PMC free article] [PubMed] [Google Scholar]
- Gennarino VA, Sardiello M, Avellino R, Meola N, Maselli V, Anand S, Cutillo L, Ballabio A, Banfi S (2009) MicroRNA target prediction by expression analysis of host genes. Genome Res 19: 481–490 [DOI] [PMC free article] [PubMed] [Google Scholar]
- Grimson A, Farh KK, Johnston WK, Garrett-Engele P, Lim LP, Bartel DP (2007) MicroRNA targeting specificity in mammals: determinants beyond seed pairing. Mol Cell 27: 91–105 [DOI] [PMC free article] [PubMed] [Google Scholar]
- Grun D, Wang YL, Langenberger D, Gunsalus KC, Rajewsky N (2005) microRNA target predictions across seven Drosophila species and comparison to mammalian targets. PLoS Comput Biol 1: e13. [DOI] [PMC free article] [PubMed] [Google Scholar]
- Guo H, Ingolia NT, Weissman JS, Bartel DP (2010) Mammalian microRNAs predominantly act to decrease target mRNA levels. Nature 466: 835–840 [DOI] [PMC free article] [PubMed] [Google Scholar]
- Hammell M, Long D, Zhang L, Lee A, Carmack CS, Han M, Ding Y, Ambros V (2008) mirWIP: microRNA target prediction based on microRNA-containing ribonucleoprotein-enriched transcripts. Nat Methods 5: 813–819 [DOI] [PMC free article] [PubMed] [Google Scholar]
- He L, He X, Lim LP, de Stanchina E, Xuan Z, Liang Y, Xue W, Zender L, Magnus J, Ridzon D, Jackson AL, Linsley PS, Chen C, Lowe SW, Cleary MA, Hannon GJ (2007) A microRNA component of the p53 tumour suppressor network. Nature 447: 1130–1134 [DOI] [PMC free article] [PubMed] [Google Scholar]
- Heid CA, Stevens J, Livak KJ, Williams PM (1996) Real time quantitative PCR. Genome Res 6: 986–994 [DOI] [PubMed] [Google Scholar]
- Hendrickson DG, Hogan DJ, McCullough HL, Myers JW, Herschlag D, Ferrell JE, Brown PO (2009) Concordant regulation of translation and mRNA abundance for hundreds of targets of a human microRNA. PLoS Biol 7: e1000238. [DOI] [PMC free article] [PubMed] [Google Scholar]
- Iwamoto F, Stadler M, Chalupnikova K, Oakeley E, Nagamine Y (2008) Transcription-dependent nucleolar cap localization and possible nuclear function of DExH RNA helicase RHAU. Exp Cell Res 314: 1378–1391 [DOI] [PubMed] [Google Scholar]
- Jackson AL, Burchard J, Schelter J, Chau BN, Cleary M, Lim L, Linsley PS (2006) Widespread siRNA ‘off-target’ transcript silencing mediated by seed region sequence complementarity. RNA 12: 1179–1187 [DOI] [PMC free article] [PubMed] [Google Scholar]
- Jacobsen A, Wen J, Marks DS, Krogh A (2010) Signatures of RNA binding proteins globally coupled to effective microRNA target sites. Genome Res 20: 1010–1019 [DOI] [PMC free article] [PubMed] [Google Scholar]
- John B, Enright AJ, Aravin A, Tuschl T, Sander C, Marks DS (2004) Human MicroRNA targets. PLoS Biol 2: e363. [DOI] [PMC free article] [PubMed] [Google Scholar]
- Kertesz M, Iovino N, Unnerstall U, Gaul U, Segal E (2007) The role of site accessibility in microRNA target recognition. Nat Genet 39: 1278–1284 [DOI] [PubMed] [Google Scholar]
- Khan AA, Betel D, Miller ML, Sander C, Leslie CS, Marks DS (2009) Transfection of small RNAs globally perturbs gene regulation by endogenous microRNAs. Nat Biotechnol 27: 549–555 [DOI] [PMC free article] [PubMed] [Google Scholar]
- Krueger U, Bergauer T, Kaufmann B, Wolter I, Pilk S, Heider-Fabian M, Kirch S, Artz-Oppitz C, Isselhorst M, Konrad J (2007) Insights into effective RNAi gained from large-scale siRNA validation screening. Oligonucleotides 17: 237–250 [DOI] [PubMed] [Google Scholar]
- Larsson E, Fredlund Fuchs P, Heldin J, Barkefors I, Bondjers C, Genove G, Arrondel C, Gerwins P, Kurschat C, Schermer B, Benzing T, Harvey SJ, Kreuger J, Lindahl P (2009) Discovery of microvascular miRNAs using public gene expression data: miR-145 is expressed in pericytes and is a regulator of Fli1. Genome Med 1: 108. [DOI] [PMC free article] [PubMed] [Google Scholar]
- Lim LP, Lau NC, Garrett-Engele P, Grimson A, Schelter JM, Castle J, Bartel DP, Linsley PS, Johnson JM (2005) Microarray analysis shows that some microRNAs downregulate large numbers of target mRNAs. Nature 433: 769–773 [DOI] [PubMed] [Google Scholar]
- Linsley PS, Schelter J, Burchard J, Kibukawa M, Martin MM, Bartz SR, Johnson JM, Cummins JM, Raymond CK, Dai H, Chau N, Cleary M, Jackson AL, Carleton M, Lim L (2007) Transcripts targeted by the microRNA-16 family cooperatively regulate cell cycle progression. Mol Cell Biol 27: 2240–2252 [DOI] [PMC free article] [PubMed] [Google Scholar]
- Long D, Lee R, Williams P, Chan CY, Ambros V, Ding Y (2007) Potent effect of target structure on microRNA function. Nat Struct Mol Biol 14: 287–294 [DOI] [PubMed] [Google Scholar]
- Poliseno L, Salmena L, Zhang J, Carver B, Haveman WJ, Pandolfi PP (2010) A coding-independent function of gene and pseudogene mRNAs regulates tumour biology. Nature 465: 1033–1038 [DOI] [PMC free article] [PubMed] [Google Scholar]
- Ren Y, Gong W, Xu Q, Zheng X, Lin D, Wang Y, Li T (2006) siRecords: an extensive database of mammalian siRNAs with efficacy ratings. Bioinformatics 22: 1027–1028 [DOI] [PubMed] [Google Scholar]
- Ross J (1995) mRNA stability in mammalian cells. Microbiol Rev 59: 423–450 [DOI] [PMC free article] [PubMed] [Google Scholar]
- Saetrom P, Heale BS, Snove O Jr, Aagaard L, Alluin J, Rossi JJ (2007) Distance constraints between microRNA target sites dictate efficacy and cooperativity. Nucleic Acids Res 35: 2333–2342 [DOI] [PMC free article] [PubMed] [Google Scholar]
- Seitz H (2009) Redefining microRNA targets. Curr Biol 19: 870–873 [DOI] [PubMed] [Google Scholar]
- Selbach M, Schwanhausser B, Thierfelder N, Fang Z, Khanin R, Rajewsky N (2008) Widespread changes in protein synthesis induced by microRNAs. Nature 455: 58–63 [DOI] [PubMed] [Google Scholar]
- Sharova LV, Sharov AA, Nedorezov T, Piao Y, Shaik N, Ko MS (2009) Database for mRNA half-life of 19 977 genes obtained by DNA microarray analysis of pluripotent and differentiating mouse embryonic stem cells. DNA Res 16: 45–58 [DOI] [PMC free article] [PubMed] [Google Scholar]
- Vella MC, Choi EY, Lin SY, Reinert K, Slack FJ (2004) The C. elegans microRNA let-7 binds to imperfect let-7 complementary sites from the lin-41 3′UTR. Genes Dev 18: 132–137 [DOI] [PMC free article] [PubMed] [Google Scholar]
- Vohradsky J, Panek J, Vomastek T (2010) Numerical modelling of microRNA-mediated mRNA decay identifies novel mechanism of microRNA controlled mRNA downregulation. Nucleic Acids Res 38: 4579–4585 [DOI] [PMC free article] [PubMed] [Google Scholar]
- Wang X (2006) Systematic identification of microRNA functions by combining target prediction and expression profiling. Nucleic Acids Res 34: 1646–1652 [DOI] [PMC free article] [PubMed] [Google Scholar]
- www.appliedbiosystems.com. Applied Biosystems
- Yang E, van Nimwegen E, Zavolan M, Rajewsky N, Schroeder M, Magnasco M, Darnell JE Jr (2003) Decay rates of human mRNAs: correlation with functional characteristics and sequence attributes. Genome Res 13: 1863–1872 [DOI] [PMC free article] [PubMed] [Google Scholar]
- Zimmermann TS, Lee AC, Akinc A, Bramlage B, Bumcrot D, Fedoruk MN, Harborth J, Heyes JA, Jeffs LB, John M, Judge AD, Lam K, McClintock K, Nechev LV, Palmer LR, Racie T, Rohl I, Seiffert S, Shanmugam S, Sood V et al. (2006) RNAi-mediated gene silencing in non-human primates. Nature 441: 111–114 [DOI] [PubMed] [Google Scholar]
- Zubiaga AM, Belasco JG, Greenberg ME (1995) The nonamer UUAUUUAUU is the key AU-rich sequence motif that mediates mRNA degradation. Mol Cell Biol 15: 2219–2230 [DOI] [PMC free article] [PubMed] [Google Scholar]
Associated Data
This section collects any data citations, data availability statements, or supplementary materials included in this article.
Supplementary Materials
Supplementary figures S1–6, Supplementary tables S2–3
Efficacies of Silencer siRNAs in HeLa, as determined using RT-qPCR.