

Abstract
A promising strategy to control the aggregation of the Alzheimer's Aβ peptide in the brain is the clearance of Aβ from the central nervous system into the peripheral blood plasma. Among plasma proteins, human serum albumin plays a critical role in the Aβ clearance to the peripheral sink by binding to Aβ oligomers and preventing further growth into fibrils. However, the stoichiometry and the affinities of the albumin-Aβ oligomer interactions are still to be fully characterized. For this purpose, here we investigate the Aβ oligomer-albumin complexes through a novel and generally applicable experimental strategy combining saturation transfer and off-resonance relaxation NMR experiments with ultrafiltration, domain deletions, and dynamic light scattering. Our results show that the Aβ oligomers are recognized by albumin through sites that are evenly partitioned across the three albumin domains and that bind the Aβ oligomers with similar dissociation constants in the 1–100 nM range, as assessed based on a Scatchard-like model of the albumin inhibition isotherms. Our data not only explain why albumin is able to inhibit amyloid formation at physiological nM Aβ concentrations, but are also consistent with the presence of a single high affinity albumin-binding site per Aβ protofibril, which avoids the formation of extended insoluble aggregates.
Introduction
The Alzheimer's Aβ peptide is produced not only in the central nervous system (CNS) but also in most cells of peripheral tissues (1). Removal of the Aβ peptide from the CNS to the periphery through the blood brain barrier has been proposed as an effective strategy to prevent the Aβ accumulation in the brain (1). Specifically, according to the peripheral sink hypothesis, blood plasma proteins, such as human serum albumin (HSA), control Aβ aggregation within the brain from the periphery, by regulating the equilibrium of Aβ peptide across the blood brain barrier. Therefore, it is likely that plasma protein dysfunctions affect the clearance of Aβ from the CNS and consequently Aβ plaque deposition within the brain. For instance, recent clinical studies show that low albumin levels are associated with increased odds of cognitive impairment and, moreover, indicate the use of albumin in plasma exchange therapies as a promising avenue in the treatment of mild to moderate Alzheimer's disease (2,3). Furthermore, HSA is also an effective inhibitor of Aβ fibrilization (4–7).
Despite the clinical relevance of albumin in the context of Alzheimer's disease, several fundamental questions about the nature of the HSA-Aβ interactions are still open. Although it has been suggested that albumin preferentially targets Aβ oligomers rather than monomers through capping of exposed hydrophobic sites (4), considerable uncertainty remains on the stoichiometries and on the affinities of HSA-Aβ binding (5–9). Here we report both the prevailing binding stoichiometries and the domain-specific binding affinities for the Aβ/HSA system.
HSA is composed of three domains (Fig. 1 a) and the distribution of binding sites across the three HSA domains varies widely for different albumin ligands (10). For instance, nonesterified fatty acids (FAs) are one of the primary physiological HSA ligands and their binding involves up to seven binding sites, three of which are confined within domain 3 whereas the other four are in domains 1 and 2 (Fig. 1 a) (10,11). Unlike FAs, exogenous amphiphilic drugs bind HSA at sites that do not involve all three domains (10). Specifically, ibuprofen-like drugs with aromatic carboxylates in an extended conformation display a marked selectivity for Sudlow's site II in domain 3, whereas warfarin-like drugs with a bulky heterocyclic anion bind preferentially Sudlow's site I in domain 2. Within this range of possible binding stoichiometries, it is currently unknown whether the recognition of Aβ oligomers by HSA approaches more closely the three-domain binding pattern of fatty acids or the domain-selective interactions displayed by several drugs.
Figure 1.
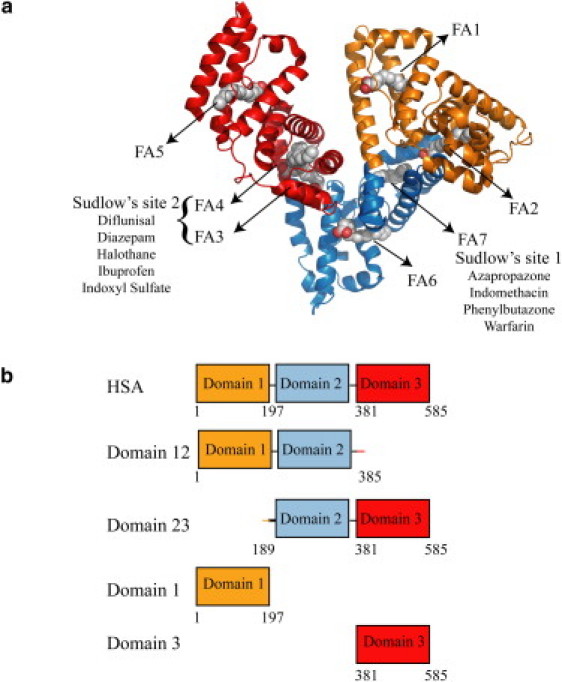
Domain organization of HSA and design of the HSA constructs used in this investigation. (a) Ribbon diagram of the HSA structure in the fatty acid bound state (PDB file1E7H) (11). Palmitate molecules are shown in space-filling representation to indicate fatty acid binding sites. Domain 1 contains FA1 and FA2 binding sites, while domain 2 contains FA6 and FA7 binding sites. Domain 3 contains FA 3-5 binding sites. Drug binding sites are indicated as Sudlow sites 1 and 2, and their representative drug ligands are listed (10). (b) Constructs used in this study.
Furthermore, only partial characterizations are available for the binding affinities of the HSA-Aβ assembly complexes (4,7,8). Based on measured half-maximal inhibitory protein concentration (IC50 values) for the competitive inhibition by HSA of the incorporation of Aβ monomers into preformed fibrils, a broad upper limit of ∼10 μM for the Aβ assembly-HSA dissociation constants has been proposed (7,8). It is therefore still unclear whether the Aβ oligomer-HSA KD values are in the μM or in the nM range, which would be more comparable to the physiological nM concentration of the Aβ peptide in human plasma (1). In addition, due to the presence of a distribution of Aβ oligomer sizes and possibly of binding stoichiometries (12), it is also unknown if and how the Aβ oligomer-HSA KD values vary among the three domains of HSA.
To investigate the Aβ oligomer-HSA binding stoichiometries and domain-specific binding affinities, we have developed an integrated experimental strategy based on saturation transfer difference (STD) (4,13,14) and off-resonance relaxation (15,16) NMR experiments aimed at quantitatively comparing the Aβ oligomerization inhibitory potencies of different HSA deletion constructs. Our comparative NMR analyses have primarily focused on the Aβ (12–28) peptide, which not only spans the central hydrophobic core of the Aβ peptide (L17VFFA21) and key HSA binding sites (5), but it is also known to provide a reliable and stable model for the Aβ oligomers (17–19). However, whenever possible, the results obtained for Aβ (12–28) were validated using the longer Aβ (1–42) peptide.
Our data indicate an even partitioning of largely independent Aβ oligomer-binding sites across the three HSA domains, with similar affinities in the submicromolar range. In addition, the presence of a single high affinity albumin-binding site per Aβ oligomer/protofibril was established through dynamic light scattering (DLS) measurements, which, unlike NMR, are sensitive to small populations of high molecular weight (MW) species. We anticipate that the experimental strategies proposed here will be useful for the characterization of complex stoichiometries and relative affinities in other systems involving oligomerization inhibitory proteins and amyloidogenic peptides that self-associate into a distribution of oligomers with heterogenous sizes (12).
Materials and Methods
See the Supporting Material.
Results
HSA domain dissection approach
Our experimental design aimed at defining the partitioning of the Aβ oligomer binding sites across the three HSA domains and at dissecting the HSA domain contributions to the inhibition of the Aβ oligomerization relies on five protein constructs (Fig. 1 b). Besides full-length HSA, these include one-domain and two-domain HSA deletion mutants (Fig. 1 b). The one-domain segments include domains 1 and 3, which are soluble in isolation. However, domain 2 is only marginally soluble when isolated from HSA (20) and therefore it was expressed and purified as part of a pair of two-domain constructs (i.e., 12 and 23, Fig. 1 b), in which the fusion to either domain 1 or 3 ensures the required solubility. The inhibitory efficiency of domain 2 with respect to the Aβ oligomerization can then be assessed through the comparative analysis of the one- and two-domain constructs. The structural integrity of the five HSA constructs in Fig. 1 b was confirmed by circular dichroism spectroscopy (Eq. S2, Fig. S1, and Table S1 in the Supporting Material).
All three HSA domains contain Aβ oligomer binding sites and inhibit Aβ oligomer formation
The oligomerization inhibitory properties of the five HSA constructs shown in Fig. 1 b were initially qualitatively evaluated through simple one-dimensional NMR spectra of the model peptide Aβ (12–28), as illustrated in Fig. 2. The reference spectrum of the filtered Aβ (12–28) (Fig. 2 a) was acquired first and is characterized by narrow line-widths as expected for a largely monomeric Aβ peptide (4). As previously indicated (4), addition of 25 mM NaCl to the filtered Aβ (12–28) results in signal broadening of most resonances (Fig. 2 b) (4) due to screening of repulsive intermolecular electrostatic interactions and hydrophobic-collapse-driven oligomerization. The signal broadening observed in Fig. 2 b is therefore a result of the exchange of polypeptide chains between the monomeric and the oligomeric states of Aβ (12–28). Albumin interferes with this chemical exchange phenomenon and results in a marked line sharpening (Fig. 2 c). The Aβ (12–28) line sharpening observed upon albumin addition is not caused by nonspecific Aβ interactions with HSA, because control proteins (i.e., insulin and lysozyme) did not result in any detectable line-width change (Fig. S2).
Figure 2.
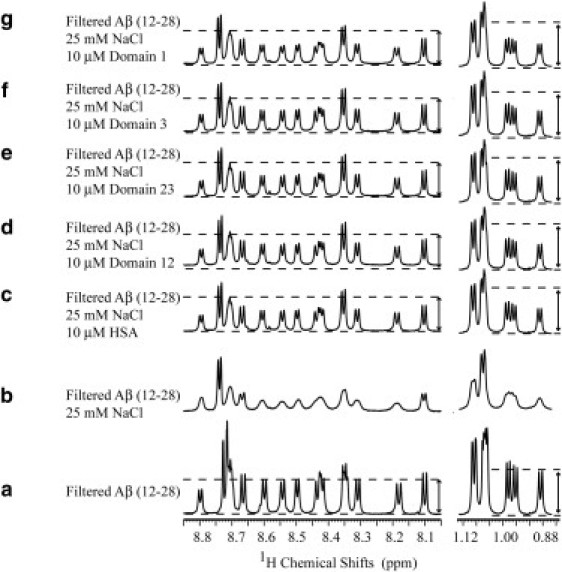
Effect of wt HSA and its deletion mutants on the one-dimensional NMR spectra of the Aβ (12–28) peptide. (a) Spectrum of 30 kDa filtered 1 mM Aβ (12–28). (b) Addition of 25 mM NaCl causes significant aggregation as indicated by line broadening and intensity losses. (c–g) Effect of the addition of HSA and its deletion mutants: domains 12 and 23 and domains 3 and 1, respectively. A similar line sharpening is obtained upon addition of all protein constructs. (Dotted lines and arrows) Comparison of the one-dimensional intensities between different spectra; although protein addition results in line sharpening, it does not result in the restoration of the starting signal intensity. Spectra a–c were previously published elsewhere (4) and are reported here only for comparison purposes.
A closer inspection to the spectra in Fig. 2, a–c, indicates that, although HSA sharpens several peaks to line-widths comparable with those of the filtered sample, HSA is unable to restore the NMR signal intensities to those of the original filtered Aβ (12–28) sample before the salt-induced oligomer formation (Fig. 2 a). This observation points to a significantly lower population of the monomeric states in the samples with HSA relative to the filtrated solution and has been rationalized in terms of a Aβ monomer competitor inhibitory mechanism, whereby HSA does not revert the oligomerization equilibria back to the monomeric peptide, but binds the Aβ oligomers and blocks their growth (4).
When similar experiments are repeated with the HSA deletion mutants, i.e., corresponding to domains 1, 3, 12, and 23 (Fig. 1 b), a line sharpening comparable to that observed after the addition of wt HSA is observed (Fig. 2, d–g). These observations indicate that both domains 1 and 3 contain Aβ oligomer binding sites and they are able to inhibit Aβ oligomerization through the Aβ monomer competitor inhibitory mechanism. Nonetheless, based on these data alone, no firm conclusions can be inferred about the inhibitory function of domain 2, because at this point we cannot rule out that the line-sharpening effect detected for the two-domain constructs (Fig. 2, d and e) is mainly due to domains 1 and 3.
The results obtained in Fig. 2 for the Aβ (12–28) peptide are in full agreement with the inhibitory profiles measured for the full-length Aβ peptide spanning residues 1–42, for which self-association was monitored both in the absence and presence of wild-type HSA and of several HSA deletion mutants. The self-assembly of Aβ (1–42) into NMR-undetectable oligomers, protofibrils, and fibrils was followed over time through the simple loss in one-dimensional NMR signal intensity (Fig. S3). Fig. S3 a shows that, in the absence of oligomerization inhibitors, >50% of the original one-dimensional signal is lost already after 11 h from sample preparation. Conversely, in the presence of substoichiometric amounts of HSA, this decay is dramatically quenched (Fig. S3 b) and a similar effect is observed for substoichiometric amounts of the HSA deletion mutants (Fig. S3, c–e), confirming that domains 1 and 3 include Aβ binding sites and preserve significant Aβ oligomerization inhibitory functions even for the full-length Aβ peptide. Therefore, overall the results on the Aβ (1–42) peptide (Fig. S3) corroborate the relevance of the Aβ (12–28) construct and of the related one-dimensional line-width analysis (Fig. 2).
Furthermore, the Aβ (1–42) one-dimensional NMR spectra acquired immediately after addition of the HSA constructs do not differ significantly from the spectra of the Aβ (1–42) peptide alone (Fig. S4), confirming that inhibition of Aβ fibril formation in the presence of HSA is not due to interactions with monomeric but with oligomeric Aβ (1–42). However, it is still not possible based on these data alone to reach a definitive conclusion on the role of domain 2 in the Aβ oligomer inhibition, or to obtain information on the dissociation constants of the albumin-Aβ oligomer interactions. To dissect the contributions of the single domains, more quantitative estimations of the oligomerization inhibitory potencies of the different HSA constructs is required. For this purpose, one-dimensional STD data were acquired at increasing protein concentrations (Fig. 3, b–f), starting from filtered Aβ (12–28) samples in which stable oligomers were induced by salt addition, as in Fig. 2 b. These STD experiments are less suitable for the longer Aβ (1–42) peptide, because, in this case, the soluble oligomers in exchange with the NMR-detectable low-MW species appear only transiently (4,21).
Figure 3.
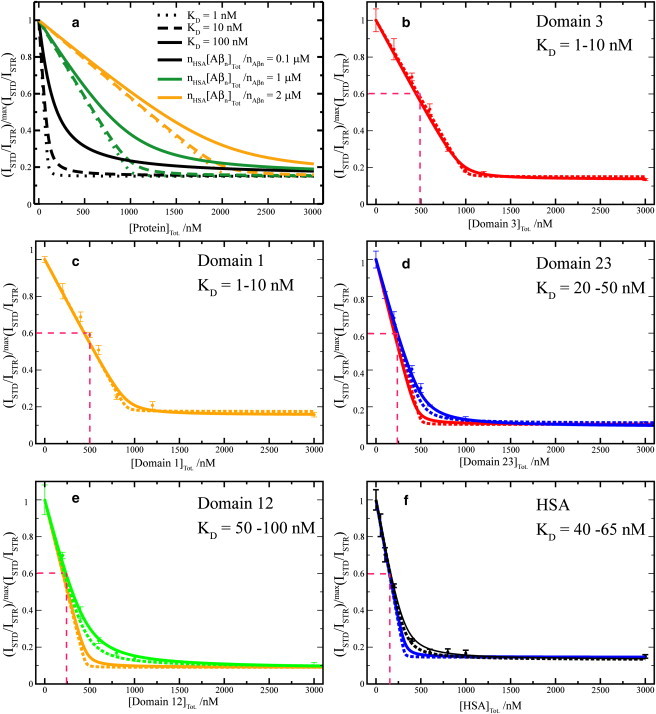
Dose-response STD-based profiles for the inhibition of the Aβ (12–28) self-association by HSA and its deletion mutants. (a) Effect of different KD values and of different HSA-binding competent Aβ oligomer concentrations on dose-response STD curves simulated according to a Scatchard-like model. This model assumes full equivalence and independence of all sites in HSA that can bind Aβ oligomers. Further details on this model are available in the text. (b–f) Effect of HSA deletion mutants (i.e., domain 3, domain 1, domains 23 and 13) and wt HSA, respectively, on the relative ISTD/ISTR ratios measured for the filtered Aβ (12–28) peptide aggregated through the addition of 25 mM NaCl. All ratios were normalized to their maximum value measured before protein addition. (b and c, Dashed and solid lines) Backcalculated dose-response curves using the Scatchard-like model and KD values of 1 and 10 nM, respectively. (d, Dashed and solid blue lines) Backcalculated dose-response curves using the Scatchard-like model and KD values of 20 and 50 nM, respectively. This range of KD values is in good agreement with the experimental data measured for the domain 23 construct. (Red lines) Obtained based on the single domain constructs KD values (1 and 10 nM), assuming that individual domains bind independently, i.e., simply downscaling the one-domain curves of panel b by a factor of two. (e, f, green and black curves) Computed using the KD values that fit the experimental data. (e, f, orange and blue lines) Obtained based on the one-domain curves of panel c, assuming fully independent binding of Aβ oligomers to two and three domains, i.e., simply downscaling the curves of panel c by a factor of two or three, respectively.
The STD monitored titration data (Fig. 3, b–f) display a typical dose-response pattern, in which the saturation transfer difference/saturation transfer reference ratios (ISTD/ISTR) decrease progressively as the protein concentration increases, until a plateau is reached. This dose-response pattern is observed for full-length HSA (Fig. 3 f) as well as for all four HSA deletion mutants (Fig. 3, b–e). Although no major differences were observed among the HSA constructs in the plateau heights, which cluster around a residual basal STD effect corresponding to ∼15–18% of the original value measured in the absence of protein (Fig. 3, b–f), significant domain-dependent variations were observed in the slope of the initial ISTD/ISTR decay (Fig. 3, b–f). The latter is quantified in terms of half-maximal inhibitory protein concentration (i.e., IC50), corresponding to the midpoint between the maximum (i.e., initial) ISTD/ISTR value and the plateau region (Fig. 3, b–f). Notably, Fig. 3, b–f, shows that the measured IC50 values decrease in an almost linear progression as the number of domains in the inhibitory HSA constructs increases. Specifically, for both domains 1 and 3 the IC50 values are ∼500 nM (Fig. 3, b and c), while the IC50 decreases by ∼50% (i.e., ∼250 nM) for the two-domain constructs (Fig. 3, d and e) and by ∼67% (i.e., ∼160 nM) for full-length HSA with all three domains (Fig. 3 f). These observations point to the presence of Aβ oligomer binding sites within the second HSA domain and to the equivalence of the three HSA domains in their efficiency as self-assembly inhibitors under our experimental conditions.
The even partitioning across the three albumin domains of binding sites for the Aβ oligomers revealed by the IC50 analysis suggests the existence of a common oligomer recognition mode shared by all three HSA domains. To test this hypothesis, the effect of the HSA deletion mutants on the oligomeric equilibria of Aβ (12–28) was monitored also through nonselective two-dimensional off-resonance relaxation experiments with a 35.5° tilt angle, which provide a sensitive probe of the involvement of each Aβ residue in self-recognition (15,16). Specifically, the residue-specific variations in Hα-R35.5o,ns rates induced by each HSA deletion mutant were correlated with the corresponding changes in Hα-R35.5o,ns rates caused by full-length HSA (Fig. 4). As shown in Fig. 4, the nonselective two-dimensional off-resonance relaxation profiles of both one-domain and two-domain constructs correlate well with that of full-length HSA, supporting the hypothesis that all three domains share a similar Aβ (12–28) oligomer recognition mode.
Figure 4.
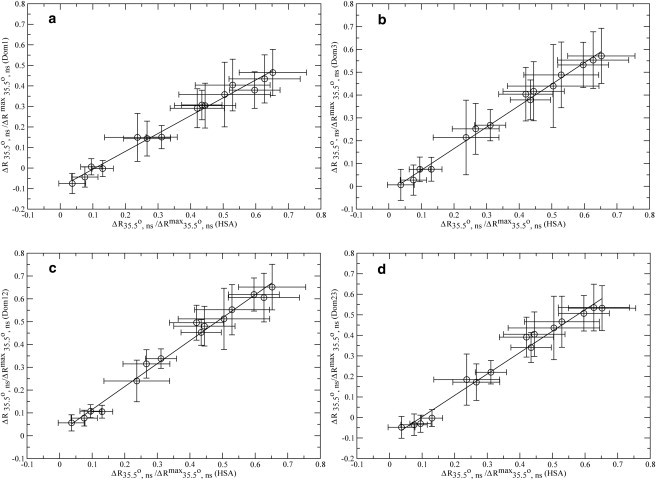
Correlations between the nonselective off-resonance relaxation data of full-length HSA and those measured for the four HSA deletion mutants shown in Fig. 1b. (Horizontal axes) Differences in residue-specific Hα nonselective off-resonance relaxation rates measured for the aggregated 1 mM Aβ (12–28) sample before and after addition of 10 μM full-length HSA. (a–d, Vertical axes) Variations caused by the addition to the aggregated sample of 10 μM of the four HSA deletion mutants (domain 1, domain 3, and domains 12 and 23, respectively).
While the equivalent self-assembly inhibitory efficiency of the three HSA domains is independently supported by both the off-resonance relaxation experiments (Fig. 4) and the relationship between the IC50 values and the number of domains in the HSA constructs (Fig. 3, b–f), it is important to note that the IC50 values or the data in Fig. 4 do not provide any strict quantification of the affinity between the HSA domains and the Aβ oligomers. For instance, the IC50 values derived from the STD titration curves depend on the oligomer concentrations, which in turn depend on the concentrations of Aβ peptide and salt (Fig. S5), and therefore can be used only to provide an upper limit for the dissociation constants (KD) of the Aβ oligomer-albumin complexes. The determination of these KD values requires a more quantitative modeling of the dose-response inhibitory profiles in Fig. 3, b–f.
Modeling the dependence of the Aβ saturation transfer on the concentration of inhibitor
The dissociation constant, unlike the IC50 value, is independent of the Aβ oligomer concentration and therefore provides a more meaningful descriptor of the affinity of HSA for the Aβ oligomers. To obtain dissociation constant values for the Aβ oligomer-HSA complex, the titration data of Fig. 3, b–f, were analyzed according to a simple model of the binding isotherms. The first assumption of this model is that in the absence of albumin, the NMR STD signal observed for the monomeric Aβ peptide arises from the saturation of Aβ oligomers, here denoted as Aβn (4). Therefore, the STD/STR ratio can be expressed as:
| (1) |
where [Aβ] is the concentration of monomeric free Aβ and KD,Aβ is the dissociation constant of a single polypeptide chain of Aβ from the Aβn+1 oligomers. It should be emphasized that KD,Aβ represents just an effective dissociation constant that captures only the average STD effects of the heterogeneous distribution of Aβn sizes present in solution. In this respect, the use of a single effective KD,Aβ constant as opposed to several Aβn MW-dependent dissociation constants is a major oversimplification. However, Eq. 1 is still useful for the interpretation of the data in Fig. 3, b–f, to the extent that it represents one of the simplest possible models still able to reproduce the key trends observed in the experimental data, avoiding overparameterization and the consequent risk of making line fitting an underdetermined problem. Similar considerations apply for the other dissociation constants defined below.
Because albumin competes with the Aβ monomers for binding to the Aβn oligomers (4), HSA is effectively modeled as a competitive inhibitor of the interaction between Aβ monomers and oligomers. For the sake of simplicity, we assume that HSA and the Aβ oligomers bind in a 1:1 ratio with an effective dissociation constant:
The STD/STR ratio is then modeled as
| (2) |
Equation 2, however, does not take into account that only a fraction of the oligomers in solution is HSA-binding-competent (4,5). It has been shown that only Aβ oligomers larger than a critical MW are able to bind albumin (4,5). Although the exact MW cutoff for the size of the Aβ oligomers that bind HSA is still unknown, it is possible to model this effect into Eq. 2 by introducing the fraction f of Aβ oligomers that are not HSA-binding-competent. These smaller Aβ oligomers are not bound by HSA (5) and therefore Eq. 2 becomes:
| (3) |
Equation 3 essentially combines Eqs. 1 and 2 and it can be further simplified by defining the effective apparent dissociation constant:
| (4) |
KD,HSA,app. as defined in Eq. 4 is an effective equilibrium constant because the monomeric Aβ concentration (i.e., [Aβ]) is not significantly affected by [HSA], as shown by the one-dimensional NMR spectra of Aβ (12–28) acquired at different concentrations of albumin (Fig. S6). Using Eq. 4, and normalizing the (STD/STR)[HSA]>0 ratio through (STD/STR)[HSA]=0 as expressed in Eq. 1, Eq. 3 is simplified to:
| (5) |
This equation was used to model the inhibition curves shown in Fig. 3. In the absence of HSA, Eq. 5 correctly predicts
while at saturating concentrations of HSA, i.e.,
Eq. 5 reduces to:
| (6) |
The fraction f of oligomers that are HSA-binding-incompetent is therefore directly readable from the plateau height of the dose-response inhibition plots of Fig. 3. For intermediate concentrations of albumin, it is important to note that, in Fig. 3, the ratios
are reported as a function of the total HSA concentration ([HSA]Tot) as opposed to the free HSA concentration ([HSA]) used in Eq. 5. However, [HSA] can be easily estimated starting from [HSA]Tot because Eq. 5 indicates that the normalized STD/STR ratios of Fig. 3 are effectively modeled by the binding of HSA to the Aβn oligomer with an apparent dissociation constant KD,HSA,app.. [HSA] can then be computed from [HSA]Tot. using KD,HSA,app. as a parameter, provided that the total concentration of HSA-binding competent oligomers (i.e., [Aβn]Tot) is known. [Aβn]Tot is determined experimentally from the transition point between the binding and saturation regions of the HSA titrations curves of Fig. 3, i.e., from the beginning of the plateau region. Using the experimentally determined [Aβn]Tot value and KD,HSA,app as a fitting parameter, it is possible to compute [HSA] for each [HSA]Tot. based on Eq. S1 (in the Supporting Material). Once [HSA] is known, the value of
is then calculated through Eq. 5, and compared to the experimental data reported in Fig. 3.
In conclusion, for the case of a 1:1 HSA:Aβn oligomer-binding stoichiometry, the inhibitory dose-response titration curves of
provide three distinct parameters:
-
1.
The height of the plateau represents the fraction f of Aβn oligomers that are not HSA-binding-competent (i.e.f)
-
2.
The [HSA]Tot concentration at which the plateau starts (i.e., crossing point of binding and saturation regions) provides the total concentration of Aβn oligomers that are HSA-binding-competent (i.e., [Aβn]Tot.)
-
3.
Through fitting, it is possible to obtain the average apparent dissociation constant of the HSA:Aβn oligomer complexes, KD,HSA,app, which is highly sensitive to the curvature of the plot in the transition zone between the binding and saturation regions (Fig. 3 a).
Once the KD,HSA,app value is determined, the actual nonapparent KD,HSA can be computed using Eq. 4. However, it should be noted that, in our case, the monomer concentration [Aβ] is in the submillimolar range and under our experimental conditions KD,Aβ is expected to be of the order of mM (17). We therefore expect that, within error, KD,HSA,app and KD,HSA are in the same concentration range.
If the number of Aβn oligomers bound per HSA molecule (nAβn) is >1, the simplest possible model that accounts for our experimental data assumes that the multiple Aβn oligomer binding sites within HSA are all equivalent and independent of each other (i.e., Scatchard-like model). In this case, it is still possible to employ the formalism developed above leading to Eq. 5 and Eq. S1, provided that the [HSA]Tot used in Eq. S1 is scaled up according to the number of Aβn oligomers bound per HSA molecule (i.e., it is multiplied by nAβn). This is easily appreciated considering that, if the multiple binding sites are equivalent and independent of each other, an increase in nAβn is indistinguishable from a corresponding increase in the number of HSA molecules, which are also equivalent and independent from each other. In other words, an increase in nAβn results mainly in a rescaling of the horizontal axes of the plots of Fig. 3, explaining also the linear relationship between the observed IC50 values and the reciprocal of the number of domains in each HSA construct used in Fig. 3.
In the case the number of HSA molecules bound per Aβn oligomer (nHSA) is >1, we find that the simplest possible model that accounts for our experimental data assumes, again in a Scatchard-like manner, that the multiple HSA binding sites within each Aβn oligomer are all equivalent and independent of each other. And in this case, similarly to what was mentioned for nAβn > 1, it is still possible to use Eq. 5 and Eq. S1, but only after rescaling (by an nHSA factor) the total concentration of HSA-binding competent Aβn oligomers (i.e., [Aβn]Tot.). Therefore, an increase in nHSA results mainly in a rescaling of the horizontal axes of the plots of Fig. 3, similarly to the effect of decreased nAβn. This means that, in general terms, the transition point between the binding and the saturation regions in the titration curves of Fig. 3 provides only the product of nHSA/nAβn and [Aβn]Tot. and based on the inhibition data of Fig. 3 alone, is not possible to dissect further the stoichiometric ratio, nHSA/nAβn, from [Aβn]Tot..
Fig. 3 shows that the experimental profiles
are well reproduced by Eq. 5 and Eq. S1 of our model. Specifically, KD values of 1–10 nM modeled well the experimental data measured for the single domain constructs (i.e., domain 1 and domain 3) (Fig. 3, b and c), while for the two-domains constructs, i.e., domain 12 and domain 23, the experimental STD data is in good agreement with KD values in the range of 50–100 and 20–50 nM, respectively (Fig. 3, e and d).
Interestingly, these dissociation constant values obtained for the two-domain constructs are higher than the KD values measured for the single-domain constructs (blue versus red and green versus orange curves in Fig. 3, d and e, respectively). A possible interpretation of the increased KD values observed for the two- versus one-domain constructs is that binding of Aβ oligomers to two-domain constructs is at least partially inhibited by steric hindrance imposed by binding of other Aβ oligomers to the adjacent domain. No major changes in the fitted KD values were observed in going from the two-domain constructs to full-length HSA (Fig. 3, d–f), confirming that, apart from the pairwise partial steric hindrance between adjacent domains, the three domains of albumin bind Aβ oligomers independently of each other and all in the 1–100 nM range.
Aβ oligomers/protofibrils contain a single high affinity albumin-binding site
Although the previous analyses clearly support the presence of several Aβ-oligomer binding domains within HSA, they cannot unambiguously define the number of albumin molecules bound per Aβ oligomers/protofibrils. However, the observation that all three domains of HSA bind Aβn oligomers with comparable affinities implies that, if the Aβn assemblies bind more than one albumin molecule, albumin is expected to function as an effective cross-linker of Aβn oligomers, resulting in the formation of large weblike networks and possibly in sample precipitation. We did not observe any visible precipitation upon addition of albumin, suggesting that polymerlike networks do not form upon mixing of Aβ and HSA. To confirm this initial qualitative assessment, we performed DLS measurements, which are ideally suited to detect large molecular assemblies because the DLS sensitivity increases for larger particle sizes, allowing the detection of minor populations of high MW aggregates (22,23).
Fig. 5 illustrates the main results obtained through DLS. Specifically, a solution of 0.1 mM Aβ (1−42) freshly prepared (i.e. without incubation) in the absence of albumin displays an oligomer size distribution with two main peaks (Fig. 5 a). The first peak is centered at 17 nm and is assigned to Aβ petamers/hexamers, which have been proposed as the main building block of high MW assemblies (22,23). The second peak is centered at 178 nm and it corresponds to high MW assemblies (23). After 48 h incubation, the oligomer size distribution of Aβ (1–42) in the absence of albumin evolves to result in two peaks in the 10–100 nm region and still a single peak in the 100–1000 nm window, but shifted toward sizes larger than the original 178 nm (Fig. 5 b).
Figure 5.
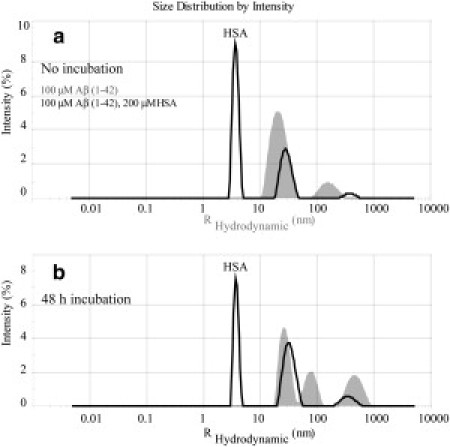
Intensity versus size distribution obtained from DLS measurements of 0.1 mM Aβ (1–42) in the presence and absence of 200 μM of HSA. (a) Measurements collected immediately after samples were prepared. (b) Measurements on the same samples incubated for 48 h at 37°C after preparation. (Shaded and solid representations) DLS profiles in the absence and presence of HSA, respectively. Note that all measurements were performed using 12-μL volume cells and a Zetasizer Nano S System (Malvern Instruments, Malvern, Worcestershire, UK) at 25°C.
When the DLS experiments are repeated in the presence of albumin, the main difference observed without incubation (Fig. 5 a) is a new peak with a ∼3.8 nm radius, which belongs to excess apo albumin. The two main peaks in the 10–100 nm and 100–1000 nm regions detected for Aβ (1− 42) in the absence of albumin are also observed in the presence of HSA (Fig. 5 a). After 48 h incubation, a similar pattern with two main peaks in the 10–100 nm and 100–1000 nm regions is still preserved in the presence of albumin (Fig. 5 b). This observation supports the absence of the above-mentioned large polymerlike networks expected if the Aβ assemblies bound more than one HSA molecule, suggesting that the Aβ oligomers/protofibrils contain only a single high affinity albumin-binding site. These results are also in agreement with previous electron microscopy (EM) images of Aβ (1–42) recorded at different time intervals after the addition of HSA (24). In these EM images, no large MW aggregates were detected in the presence of albumin (24). The DLS and EM data therefore consistently support the presence of a unique high affinity albumin-binding site per Aβn oligomers/protofibrils.
Discussion
The combined analysis of our STD, off-resonance relaxation, and DLS data is consistent with a general model whereby each domain of HSA binds at least one Aβ oligomer with dissociation constants in the 1–100 nM range (Fig. 6). In agreement with a previously proposed monomer-competition model (4), each albumin domain binds the Aβ oligomers with a similar recognition mode targeting sites within the Aβ oligomers that would otherwise accept additional Aβ monomers, thus inhibiting further growth of the Aβ assemblies. The interactions of the Aβ oligomers with different HSA domains appear to be, to a large extent, independent of each other, in as much as the experimental STD-based dose-response curves of Fig. 3 are in good agreement with a Scatchard-like model assuming full equivalence and independence for the multiple albumin sites that bind Aβ oligomers. However, the slight but significant increase in KD values observed in going from the one- to the two-domain constructs (Fig. 3, b–e) is consistent with some degree of cross-talk arising from steric hindrance between adjacent domains. Despite its simplicity, this model leads to three notable implications.
Figure 6.
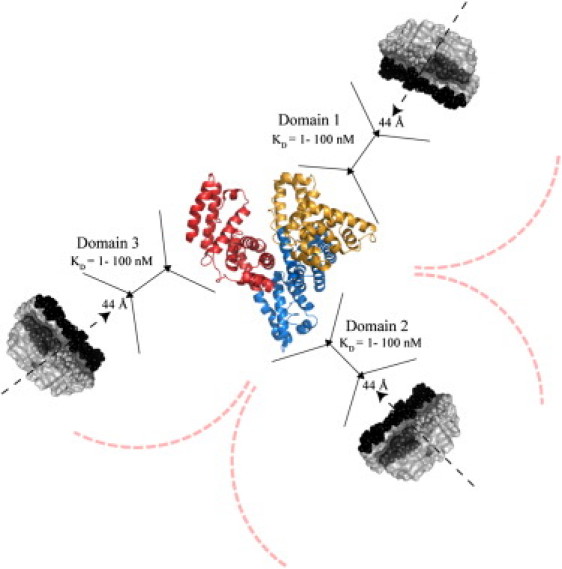
Schematic model to summarize the prevailing stoichiometries and affinities for the complexes between HSA and the Aβ protofibrils. The structures of apo albumin (PDB file 1AO6) and of the Aβ protofibrils (PDB file 2BEG) were used to generate a model with reliable relative scales. The curved dashed lines indicate possible steric hindrance between Aβ protofibrils binding to different domains. The black solid lines are used as an aid in the comparison of the sizes of the albumin domains and of Aβ protofibril. The dashed arrows indicate the direction of protofibril growth while 44 Å corresponds to the protofibrils width. The C-terminal hydrophobic residues are depicted in black, whereas hydrophobic residues in the central hydrophobic core (CHC) are indicated in dark gray. Although a single Aβ protofibril is shown per albumin domain, we cannot rule out based on our data the presence of additional Aβ protofibrils.
First, the even partitioning of the Aβ oligomer binding sites across the three domains of albumin suggests that HSA recognizes the Aβ assemblies quite differently from most drugs, which either target Sudlow's site I or II of HSA (Fig. 1 a). The presence of Aβ oligomer binding sites in all three HSA domains is instead more reminiscent of the binding of fatty acids, for which the binding sites are spread over all three albumin domains (Fig. 1 a). This observation suggests that albumin may target hydrophobic residues in Aβ and also provides a possible explanation for the marked selectivity of albumin toward the Aβ oligomers (i.e., KD < μM) relative to the Aβ monomers (i.e., KD ≥ mM) (4). In the monomeric Aβ peptide the central hydrophobic residues are shielded by intramolecular hydrophobic contacts (25,26), which compete with intermolecular interactions with HSA. However, it has been shown (27) that in the Aβ protofibrils several hydrophobic residues of Aβ become solvent-exposed and therefore potentially available to interact with HSA. It is also possible that the Aβ protofibrils preorganize these hydrophobic side chains for their recognition by albumin. This protofibril-specific preorganization would significantly minimize the entropic loss that would otherwise occur if HSA bound Aβ monomers, which unlike protofibrils populate a structurally diverse ensemble of conformations in dynamic equilibrium (25,26).
A second notable feature of our model (Fig. 6) is that the HSA domains bind Aβ oligomers with an affinity in the 1–100 nM range, which is higher than that reported for most low MW HSA ligands (10). This marked difference in affinity is fully consistent with the different physiological functions of the HSA interactions with Aβ as opposed to other ligands. Albumin functions as a delivery reservoir for FAs and exogenous ligands and therefore the binding of these molecules to HSA requires reversibility. This is why the carrier function of albumin is optimally implemented through affinities in the μM range. On the contrary, when HSA functions as an Aβ fibrilization inhibitor, no binding reversibility is warranted. As a consequence, albumin binds Aβ oligomers with KD < μM, minimizing Aβ oligomer release and ensuring an effective inhibition of Aβ fibril deposition. Furthermore, the nM affinity observed here between HSA and the Aβ assemblies explains also why the majority of Aβ in blood plasma is bound to albumin (6). The Aβ peptide is present in human plasma at ∼nM concentrations (6,28) and the previously reported IC50 value of ∼10 μM for the Aβ fibrilization inhibition by HSA (7) cannot explain alone why the large majority (89%) of Aβ in plasma is bound to albumin (6). It is possible that the previously reported IC50 measurement was limited by the amount of Aβ fibrils used in the experiments and therefore it provides only a broad upper limit for the actual affinity of albumin toward Aβ assemblies.
The third key implication of our proposed model (Fig. 6) is that, while each HSA molecule can bind multiple Aβ oligomers, each Aβ oligomer binds only a single HSA molecule in the prevailing stoichiometry. This DLS- and EM-based conclusion is independently supported by the structure of Aβ protofibril proposed by Lührs et al. (27). Based on this structure, only a single extended patch of exposed hydrophobic residues is present in the Aβ protofibril and it is located at a site referred to as the odd protofibril edge (27). The protofibril odd-edge is not only a locus for monomer recognition, and therefore a protofibril-growing site, but it is also a site available for interactions with possible inhibitors (27), such as HSA. The presence of a single albumin binding site within each Aβ protofibril in vitro is therefore supported by our DLS data and by independent structural evidence. Furthermore, this conclusion is expected to be relevant in vivo as well, because if more than a single albumin binding site was present within each Aβ protofibril, then the albumin-Aβ interactions could easily lead to the formation of extended polymerlike aggregates and actually promote the formation of insoluble deposits.
Overall, we conclude that the affinities and the stoichiometric ratios of the proposed model for the albumin-Aβ interactions (Fig. 6) appear to be functional to the effective inhibition by HSA of Aβ fibrilization. In addition, the experimental strategies integrating NMR, DLS, ultrafiltration, and deletion mutagenesis as well as the Scatchard-like modeling of inhibition outlined here are expected to be of general applicability to other systems composed of amyloid inhibitors and amyloidogenic peptides (29,30).
Acknowledgments
We thank Elle Dunitz, Annie Raditis, Rajeevan Selvaratnam, Madoka Akimoto, Bryan Vanschouwen, Dr. J. Ortega, and Dr. Rahul Das for helpful discussions.
We thank the Natural Sciences and Engineering Research Council of Canada (NSERC) for financial support to G.M. G.M. is also grateful to the Heart and Stroke Foundation of Canada for a Maureen Andrew New Investigator Award. J.M. is funded by an NSERC graduate fellowship.
Supporting Material
References
- 1.Deane R., Wu Z.H., Zlokovic B.V. RAGE (yin) versus LRP (yang) balance regulates Alzheimer amyloid β-peptide clearance through transport across the blood-brain barrier. Stroke. 2004;35(Suppl 1):2628–2631. doi: 10.1161/01.STR.0000143452.85382.d1. [DOI] [PubMed] [Google Scholar]
- 2.Llewellyn D.J., Langa K.M., Lang I.A. Serum albumin concentration and cognitive impairment. Curr. Alzheimer Res. 2010;7:91–96. doi: 10.2174/156720510790274392. [DOI] [PMC free article] [PubMed] [Google Scholar]
- 3.Boada M., Ortiz P., Páez A. Amyloid-targeted therapeutics in Alzheimer's disease: use of human albumin in plasma exchange as a novel approach for Aβ mobilization. Drug News Perspect. 2009;22:325–339. doi: 10.1358/dnp.2009.22.6.1395256. [DOI] [PubMed] [Google Scholar]
- 4.Milojevic J., Raditsis A., Melacini G. Human serum albumin inhibits Aβ fibrilization through a “monomer-competitor” mechanism. Biophys. J. 2009;97:2585–2594. doi: 10.1016/j.bpj.2009.08.028. [DOI] [PMC free article] [PubMed] [Google Scholar]
- 5.Milojevic J., Esposito V., Melacini G. Understanding the molecular basis for the inhibition of the Alzheimer's Aβ-peptide oligomerization by human serum albumin using saturation transfer difference and off-resonance relaxation NMR spectroscopy. J. Am. Chem. Soc. 2007;129:4282–4290. doi: 10.1021/ja067367+. [DOI] [PubMed] [Google Scholar]
- 6.Biere A.L., Ostaszewski B.L., Selkoe D.J. Amyloid β-peptide is transported on lipoproteins and albumin in human plasma. J. Biol. Chem. 1996;271:32916–32922. doi: 10.1074/jbc.271.51.32916. [DOI] [PubMed] [Google Scholar]
- 7.Bohrmann B., Tjernberg L., Nordstedt C. Endogenous proteins controlling amyloid β-peptide polymerization. Possible implications for β-amyloid formation in the central nervous system and in peripheral tissues. J. Biol. Chem. 1999;274:15990–15995. doi: 10.1074/jbc.274.23.15990. [DOI] [PubMed] [Google Scholar]
- 8.Rózga M., Kłoniecki M., Bal W. The binding constant for amyloid Aβ40 peptide interaction with human serum albumin. Biochem. Biophys. Res. Commun. 2007;364:714–718. doi: 10.1016/j.bbrc.2007.10.080. [DOI] [PubMed] [Google Scholar]
- 9.Reyes Barcelo A.A., Gonzalez-Velasquez F.J., Moss M.A. Soluble aggregates of the amyloid-β peptide are trapped by serum albumin to enhance amyloid-β activation of endothelial cells. J. Biol. Eng. 2009;3:5. doi: 10.1186/1754-1611-3-5. [DOI] [PMC free article] [PubMed] [Google Scholar]
- 10.Varshney A., Sen P., Khan R.H. Ligand binding strategies of human serum albumin: how can the cargo be utilized? Chirality. 2010;22:77–87. doi: 10.1002/chir.20709. [DOI] [PubMed] [Google Scholar]
- 11.Bhattacharya A.A., Grüne T., Curry S. Crystallographic analysis reveals common modes of binding of medium and long-chain fatty acids to human serum albumin. J. Mol. Biol. 2000;303:721–732. doi: 10.1006/jmbi.2000.4158. [DOI] [PubMed] [Google Scholar]
- 12.Yan Y.L., Liu Y.Z., Wang C.Y. Surface plasmon resonance and nuclear magnetic resonance studies of ABAD-Aβ interaction. Biochemistry (NY) 2007;46:1724–1731. doi: 10.1021/bi061314n. [DOI] [PubMed] [Google Scholar]
- 13.Mayer M., Meyer B. Group epitope mapping by saturation transfer difference NMR to identify segments of a ligand in direct contact with a protein receptor. J. Am. Chem. Soc. 2001;123:6108–6117. doi: 10.1021/ja0100120. [DOI] [PubMed] [Google Scholar]
- 14.Huang H., Milojevic J., Melacini G. Analysis and optimization of saturation transfer difference NMR experiments designed to map early self-association events in amyloidogenic peptides. J. Phys. Chem. B. 2008;112:5795–5802. doi: 10.1021/jp7118718. [DOI] [PubMed] [Google Scholar]
- 15.Esposito V., Das R., Melacini G. Mapping polypeptide self-recognition through 1H off-resonance relaxation. J. Am. Chem. Soc. 2005;127:9358–9359. doi: 10.1021/ja051714i. [DOI] [PubMed] [Google Scholar]
- 16.Milojevic J., Esposito V., Melacini G. Analysis and parametric optimization of 1H off-resonance relaxation NMR experiments designed to map polypeptide self-recognition and other noncovalent interactions. J. Phys. Chem. B. 2006;110:20664–20670. doi: 10.1021/jp063194z. [DOI] [PubMed] [Google Scholar]
- 17.Mansfield S.L., Jayawickrama D.A., Larive C.K. Measurement of peptide aggregation with pulsed-field gradient nuclear magnetic resonance spectroscopy. Biochim. Biophys. Acta. 1998;1382:257–265. doi: 10.1016/s0167-4838(97)00162-3. [DOI] [PubMed] [Google Scholar]
- 18.Zhang S.S., Casey N., Lee J.P. Residual structure in the Alzheimer's disease peptide: probing the origin of a central hydrophobic cluster. Fold. Des. 1998;3:413–422. doi: 10.1016/S1359-0278(98)00054-6. [DOI] [PubMed] [Google Scholar]
- 19.Jarvet J., Damberg P., Graslund A. Reversible random coil to β-sheet transition and the early stage of aggregation of the Aβ (12–28) fragment from the Alzheimer peptide. J. Am. Chem. Soc. 2000;122:4261–4268. [Google Scholar]
- 20.Mao H.Y., Gunasekera A.H., Fesik S.W. Expression, refolding, and isotopic labeling of human serum albumin domains for NMR spectroscopy. Protein Expr. Purif. 2000;20:492–499. doi: 10.1006/prep.2000.1330. [DOI] [PubMed] [Google Scholar]
- 21.Hou L.M., Shao H.Y., Zagorski M.G. Solution NMR studies of the Aβ (1–40) and Aβ (1–42) peptides establish that the Met35 oxidation state affects the mechanism of amyloid formation. J. Am. Chem. Soc. 2004;126:1992–2005. doi: 10.1021/ja036813f. [DOI] [PubMed] [Google Scholar]
- 22.Ahmed M., Davis J., Smith S.O. Structural conversion of neurotoxic amyloid-β (1–42) oligomers to fibrils. Nat. Struct. Mol. Biol. 2010;17:561–567. doi: 10.1038/nsmb.1799. [DOI] [PMC free article] [PubMed] [Google Scholar]
- 23.Bitan G., Kirkitadze M.D., Teplow D.B. Amyloid β-protein (Aβ) assembly: Aβ 40 and Aβ 42 oligomerize through distinct pathways. Proc. Natl. Acad. Sci. USA. 2003;100:330–335. doi: 10.1073/pnas.222681699. [DOI] [PMC free article] [PubMed] [Google Scholar]
- 24.Kooistra J., Milojevic J., Ortega J. A new function of human HtrA2 as an amyloid-β oligomerization inhibitor. J. Alzheimers Dis. 2009;17:281–294. doi: 10.3233/JAD-2009-1037. [DOI] [PMC free article] [PubMed] [Google Scholar]
- 25.Sgourakis N.G., Yan Y.L., Garcia A.E. The Alzheimer's peptides Aβ40 and 42 adopt distinct conformations in water: a combined MD/NMR study. J. Mol. Biol. 2007;368:1448–1457. doi: 10.1016/j.jmb.2007.02.093. [DOI] [PMC free article] [PubMed] [Google Scholar]
- 26.Triguero L., Singh R., Prabhakar R. Comparative molecular dynamics studies of wild-type and oxidized forms of full-length Alzheimer amyloid beta-peptides Aβ (1–40) and Aβ (1–42) J. Phys. Chem. B. 2008;112:7123–7131. doi: 10.1021/jp801168v. [DOI] [PubMed] [Google Scholar]
- 27.Lührs T., Ritter C., Riek R. 3D structure of Alzheimer's amyloid-β (1–42) fibrils. Proc. Natl. Acad. Sci. USA. 2005;102:17342–17347. doi: 10.1073/pnas.0506723102. [DOI] [PMC free article] [PubMed] [Google Scholar]
- 28.Cavani S., Tamaoka A., Mori H. Plasma levels of amyloid β 40 and β42 are independent from ApoE genotype and mental retardation in Down syndrome. Am. J. Med. Genet. 2000;95:224–228. [PubMed] [Google Scholar]
- 29.Hindo S.S., Mancino A.M., Lim M.H. Small molecule modulators of copper-induced Aβ aggregation. J. Am. Chem. Soc. 2009;131:16663–16665. doi: 10.1021/ja907045h. [DOI] [PMC free article] [PubMed] [Google Scholar]
- 30.Nanga R.P.R., Brender J.R., Ramamoorthy A. Three-dimensional structure and orientation of rat islet amyloid polypeptide protein in a membrane environment by solution NMR spectroscopy. J. Am. Chem. Soc. 2009;131:8252–8261. doi: 10.1021/ja9010095. [DOI] [PMC free article] [PubMed] [Google Scholar]
Associated Data
This section collects any data citations, data availability statements, or supplementary materials included in this article.