

Abstract
H+ extrusion is important for sustained NADPH oxidase activation after “respiratory” burst in macrophage/microglia activation. In this study, we investigated the role of Na+/H+ exchanger isoform 1 (NHE-1) in activation of microglia after lipopolysaccharide (LPS) or oxygen and glucose deprivation and reoxygenation (OGD/REOX) exposure. NHE-1 functioned in maintaining basal pHi of immortalized M4T.4 microglia or mouse primary microglia. Pharmacological inhibition of NHE-1 activity with the potent inhibitor cariporide [HOE 642 (4-isopropyl-3-methylsulfonyl-benzoyl-guanidine-methanesulfonate)] abolished pHi regulation in microglia under basal conditions. Activation of microglia either by LPS, phorbol myristate acetate, or OGD/REOX accelerated pHi regulation and caused pHi elevation, which was accompanied with an increase in [Na+]i and [Ca2+]i as well as production of superoxide anion and cytokines. Interestingly, inhibition of NHE-1 not only abolished pHi regulation but also reduced production of superoxide anion as well as expression of cytokines and inducible nitric oxide synthase. Together, these results reveal that there was a concurrent activation of NHE-1 in microglia in response to proinflammatory stimuli. The study suggests that NHE-1 functions to maintain microglial pHi homeostasis allowing for sustained NADPH oxidase function and “respiratory” burst.
Introduction
Microglial cells are ubiquitously distributed throughout the CNS and serve as neuropathological sensor under conditions such as peripheral nerve injury, trauma and stroke, inflammatory disease, and neurotoxin-induced neuronal injury (Hanisch and Kettenmann, 2007; Chen et al., 2009; Neumann et al., 2009). Microglial activation is associated with morphological changes, proliferation, motility, phagocytosis, and release of reactive oxygen species (ROS), nitrogen species, interleukins, cytokines, and chemokines (Harrigan et al., 2008; Boscia et al., 2009). The NADPH oxidase (NOX)-dependent ROS generation plays a crucial role in host defense to counteract and kill invading microbes, as well as in other physiological functions (Bedard and Krause, 2007). Conversely, ROS liberated by microglial respiratory burst may play an important role in numerous neurodegenerative processes.
The primary source of ROS production in microglia is through NOX that catalyzes the reduction of molecular oxygen to superoxide anion (O2·−) using NADPH as an electron donor (Bedard and Krause, 2007; Harrigan et al., 2008). In this process, H+ accumulates inside microglia, causing depolarization and cytoplasmic acidification (De Vito, 2006). NOX activity is markedly sensitive to intracellular pH (pHi) with an optimal pHi of 7.2 (Henderson et al., 1988). Cytoplasmic acidification may impair O2·− production as a result of inhibition of NOX (Swallow et al., 1993). Therefore, maintaining physiological pHi is critical for respiratory burst activity in microglia. However, the cellular and molecular mechanisms underlying the H+ regulation in microglia are not well defined.
Na+/H+ exchanger isoform 1 (NHE-1) is a ubiquitously expressed plasma membrane protein and the most abundant NHE isoform in the CNS (Ma and Haddad, 1997). NHE-1 protects cells from internal acidification by exchanging Na+ for H+ in an electroneutral manner (Luo et al., 2005). Na+/H+ exchange-mediated H+ extrusion contributes to the pHi recovery of acid-loaded peritoneal macrophages (Rotstein et al., 1987) and alveolar macrophages after osmotic cell shrinkage (Heming and Bidani, 1995). However, to date, no information is available on NHE-1 protein expression in microglia and its role in activation of microglia. In this study, we report that NHE-1 is involved in maintaining pHi homeostasis in microglia. Microglial activation via lipopolysaccharide (LPS), phorbol myristate acetate (PMA), or in vitro ischemia stimulates NHE-1 activity.
Materials and Methods
Materials.
HBSS and l-glutamine were from Mediatech Cellgro. Fura-2 AM, 2′,7′-bis-(2-carboxyethyl)-5-(and-6)-carboxyfluorescein (BCECF) AM, sodium-binding benzofuran isophthalate (SBFI) AM, calcein AM, isolectin GS-IB4 (Alexa Fluor 488 conjugate), dihydroethidium (DHE), 4-bromo A-23187 (4-bromo-calcimycin), DMEM, and versene were from Invitrogen. Diphenylene iodonium (DPI), LPS, PMA, DMEM/F-12, and nigericin were purchased from Sigma. Bafilomycin was from Tocris Bioscience. Pluronic F-127 was from BASF Corp. HOE 642 (4-isopropyl-3-methylsulfonyl-benzoyl-guanidine-methanesulfonate) was a kind gift from Aventis Pharma. Fetal bovine serum (FBS) was obtained from Valley Biomedical. Rabbit anti-CD11b polyclonal antibody and rabbit anti-NHE-1 polyclonal antibody were purchased from Abcam. Rat anti-CD11b monoclonal antibody was purchased from AbD Serotec, and anti-β tubulin monoclonal antibody was from Promega. Goat polyclonal antibody to Iba1 and rabbit polyclonal antibody to NADPH oxidase 2 (NOX2) were purchased from Abcam.
Primary microglia culture.
Isolation of mixed primary glial cultures from postnatal days 1 to 3 mouse brain was performed as described previously with minor modifications (Kintner et al., 2005). Briefly, brains were removed from 1- to 3-d-old neonatal mice, and the meninges were removed. The left and right hemispheres of the brain were gently dissociated in a nylon mesh sterile cell strainer, and the resulting cell suspension was passed through stainless steel screens. The cells were resuspended in DMEM/F-12 complete medium supplemented with 5% FBS, 100 U/ml penicillin, and 100 μg/ml streptomycin (Invitrogen) and seeded in poly-d-lysine-coated T75 tissue culture flasks. The cultures were incubated at 37°C with 5% CO2/95% air and refed three times per week. After 10–14 d of incubation, microglia were removed from the astroglial layer by shaking the flasks on an orbital shaker (Labnet model Orbit P4) for 1 h at 200 rpm in the incubator. After the shaking, the collected medium was centrifuged at 300 × g for 10 min at 4°C. The microglia pellets were gently resuspended in the microglial medium (DMEM supplemented with 10% FBS, 100 U/ml penicillin, and 100 μg/ml streptomycin) and seeded on the poly-d-lysine-coated 15-mm-round glass coverslips in 24-well plates (4–5 × 10⁵ cells per well). Experiments were performed on day 1–3 after seeding.
M4T.4 microglia cell line culture.
The M4T.4 cells were derived from simian virus 40 large T-antigen-immortalized microglia isolated from SJL/J mice (Olson et al., 2003). Normally, the M4T.4 cells are quiescent but can be induced to release proinflammatory cytokines in response to stimuli (Olson et al., 2003). The immune response in M4T.4 cells is similar to the response in primary microglial cultures after exposure to interferon-γ and virus infection (Olson et al., 2003). In brief, M4T.4 cells were cultured in poly-d-lysine-coated T25 flasks in DMEM supplemented with 10% FBS, 2 mm l-glutamine, and recombinant mouse granulocyte-macrophage colony-stimulating factor (GMCSF). M4T.4 cells were maintained in poly-d-lysine-coated flasks with microglia medium at 37°C with 5% CO2/95% air and were split (1:4) every 2 d by gently removing the cells with versene. M4T.4 cells were seeded on the poly-d-lysine-coated 22 × 22 mm glass coverslips in six-well plates (1 × 10⁵ cells per well). Cultures of passage 18 or lower were used in this study.
Oxygen and glucose deprivation, LPS, and PMA treatments.
Microglia cultures grown on coverslips were rinsed with an isotonic oxygen and glucose deprivation (OGD) solution, pH 7.4, containing the following (in mm): 0 glucose, 21 NaHCO3, 120 NaCl, 5.36 KCl, 0.33 Na2HPO4, 0.44 KH2PO4, 1.27 CaCl2, and 0.81 MgSO4. The cells were incubated in 1 ml of OGD solution for 2 h in a hypoxic incubator (model 3130; Thermo Forma) containing 94% N2, 1% O2, and 5% CO2. Normoxic control cells were incubated for 2 h in 5% CO2 and atmospheric air in a buffer identical to the OGD solution except for the addition of 5.5 mm glucose. Reoxygenation (REOX) was achieved by addition of glucose (5.5 mm) and incubation at 37°C in 5% CO2 and atmospheric air. Alternately, REOX was performed on the microscope stage by incubation in a nominally HCO3−-free HEPES buffer, pH 7.4, containing the following (in mm): 5.5 glucose, 137 NaCl, 5.36 KCl, 0.33 Na2HPO4, 0.44 KH2PO4, 1.27 CaCl2, 0.81 MgSO4, and 20 HEPES.
For LPS treatment, microglial cultures were incubated with 100–500 ng/ml LPS for 12–24 h at 37°C. For PMA treatment, microglia was exposed to 100 nm PMA for 10–60 min.
Immunofluorescence staining.
Microglia grown on coverslips were fixed in 4% paraformaldehyde in PBS for 15 min. After rinsing, cells were incubated with a blocking solution for 20 min, followed by application of rat anti-mouse CD11b monoclonal antibody (1:100 diluted in the blocking buffer), rabbit anti-NHE-1 polyclonal antibody (1:100 diluted in the blocking buffer), or rabbit anti-NOX2 polyclonal antibody (1:100 diluted in the blocking buffer) at 4°C overnight. After rinsing in PBS, cells were incubated with goat anti-rat secondary antibody IgG (heavy and light chain) conjugated to Alexa Fluor 488 (1:200 dilution) and goat anti-rabbit secondary antibody IgG (heavy and light chain) conjugated to Alexa Fluor 546 (1:200 dilution) for 1 h at 37°C. Fluorescence images were captured with a Leica DMIRE2 inverted confocal laser-scanning microscope (40× oil-immersion objective).
Immunoblotting.
M4T.4 cells were scraped from the flasks and lysed in PBS, pH 7.4, containing 2 mm EDTA and protease inhibitors by 30 s sonication at 4°C (Luo et al., 2005). Protein content was determined by the bicinchoninic acid method. Protein samples (60 μg/lane) and prestained molecular mass markers (Bio-Rad) were denatured in SDS 5× sample buffer and then electrophoretically separated on 8% SDS gels. After transferring to a nitrocellulose membrane, the blots were incubated in 5% nonfat dry milk in Tris-buffered saline for 2 h at room temperature and then incubated with rabbit anti-CD11b polyclonal antibody (1:440), rabbit anti-NHE-1 polyclonal antibody (1:1000), goat anti-Iba1 polyclonal antibody (1:500), or rabbit anti-NOX2 polyclonal antibody (1:1000) overnight at 4°C, respectively. After rinsing, the blots were incubated with horseradish peroxidase-conjugated secondary IgG at room temperature for 1.5 h. Bound antibody was visualized using the enhanced chemiluminescence assay (GE Healthcare).
Staining of microglia with isolectin IB4.
Primary microglia grown on coverslips were stained with isolectin IB4 (50 μg/ml) conjugated to Alexa Fluor 488 in a humidified chamber at 37° for 30 min. The coverslip was then placed in a perfusion chamber on the stage of the Leica DMIRE2 confocal microscope at 37°C. Microglia were visualized with a 60× oil-immersion objective, and images from 512 × 512 scans were collected (excitation, 488 nm argon laser line; emission, 500–545 nm).
pHi measurement.
pHi measurement and prepulse treatment were performed as described previously (Luo et al., 2007). Briefly, microglia cultures grown on coverslips were incubated with 1.3–2.5 μm BCECF AM at 37°C for 30 min. The coverslips were placed in a temperature-controlled (37°C) open-bath imaging chamber containing HCO3−-free HEPES–MEM (model RC24; Warner Instruments). The chamber was mounted on the stage of the Nikon TE 300 inverted epifluorescence microscope, and the cells were visualized with a 40× objective. The cells were excited every 10–30 s at 440 and 490 nm, and the emission fluorescence at 535 nm was recorded. Images were collected using a Princeton Instruments MicroMax CCD camera and analyzed with MetaFluor (Molecular Devices) image-processing software. The ratio of the background-corrected fluorescence emissions (F490/F440) was calibrated using the high K+/nigericin technique (Boyarsky et al., 1993).
For the prepulse treatment, cells were subjected to an acid load by a transient application (5 min) of a 30 mm NH4+/NH3 solution as described previously (Luo et al., 2007). NH4+/NH3 solutions were prepared by replacing 30 mm NaCl in the HCO3−-free, HEPES-buffered solution with an equimolar concentration of NH4Cl. pHi recovery rate during the first minute after NH4+/NH3 prepulse was determined from the slope of a fitted linear regression at pH 6.5 (Kintner et al., 2004).
For examining HCO3−-dependent transporters in pHi regulation, cells were superfused with a solution containing 21 mm HCO3−/5 mm HEPES bubbled with 5% CO2.
Intracellular Ca2+ measurement.
Microglia grown on coverslips were incubated with 5 μm fura-2 AM at 37°C for 30 min under either normoxic conditions or during the last 30 min REOX after 2 h OGD. After loading, the cells were placed in the open-bath imaging chamber and superfused with HCO3−/MEM at 37°C. Using the Nikon TE 300 inverted epifluorescence microscope and a 40× objective lens, cells were excited every 10–30 s at 345 and 385 nm, and the emission fluorescence at 510 nm was recorded. Images were collected for 2–5 min to determine Ca2+ levels and analyzed with the MetaFluor image-processing software. At the end of each experiment, the cells were exposed to 1 mm MnCl2 in Ca2+-free HCO3−/MEM and 5 μm 4-bromo A-23187. The Ca2+-insensitive fluorescence was subtracted, and the MnCl2-corrected 345/385 emission ratios were converted to Ca2+ concentration as described previously (Lenart et al., 2004).
Intracellular Na+ measurement.
Intracellular Na+ concentration ([Na+]i) was measured in microglia with the fluorescent dye SBFI AM as described previously (Kintner et al., 2004). Cultured cells grown on coverslips were loaded with 10 μm SBFI AM plus 0.02% pluronic acid at 37°C for 60 min (normoxia or REOX). The coverslips were placed in the open-bath imaging chamber and superfused (1 ml/min) with HCO3−/MEM at 37°C. Using the Nikon TE 300 inverted epifluorescence microscope and a 40× lens, cells were excited at 345 and 385 nm, and the emission fluorescence at 510 nm was recorded. Images were collected for 2–5 min to determine Na+ levels, and the 345/385 ratios were analyzed with the MetaFluor image-processing software. Absolute [Na+]i was determined for each cell by performing an in situ calibration as described previously (Su et al., 2002).
Detection of superoxide production.
First, O2·− production was estimated by the fluorescent dye DHE. DHE can react with intracellular O2·− and is oxidized to the red fluorescent compound ethidium, which binds irreversibly to double-stranded DNA in the nucleus (Zhao et al., 2003). Cultured microglia grown on coverslips were loaded with 5 μm DHE for 15 min before 2 h OGD. The coverslips were placed in an open-bath imaging chamber (37°C) in HCO3−-free HEPES/MEM. The cells were excited at 560 nm, and the emission fluorescence at 640 nm was recorded every 10 min for 1 h using Nikon TE 300 inverted epifluorescence microscope and MetaMorph image-processing software (Molecular Devices).
In parallel, O2·− production by microglia was also determined using the Diogenes System (National Diagnostics) according to the directions of the manufacturer. Diogenes is a O2·− chemiluminescence enhancer that produces light in a direct proportion to O2·− concentration. Briefly, either primary microglia or M4T.4 were grown on 96-well white nunclon plates. Cells were subjected to the following treatments: normoxia, 2 h OGD plus 1 h REOX, or 100 nm PMA for 10 min. At the end of the incubations, the medium was removed and replaced with Diogenes solution. Luminescence in the culture was integrated over 10 s using Luminometer (LMax II; Molecular Devices). Total cellular protein was determined in each well with the bicinchoninic acid method. O2·− concentration was expressed as relative light units (RLU) per microgram protein. For the PMA experiments, luminescence in the culture was determined at 0, 1, 5, and 10 min after adding 100 nm PMA. The RLU per seconds per micrograms protein values were normalized to the untreated control values.
Measurements of cytokine mRNA and NOS2 mRNA.
M4T.4 microglia were subjected to 2 h OGD plus 24 h REOX or 500 ng/ml LPS treatment for 24 h. At the end of each treatment, the cells were pelleted and total RNA was isolated from the cells using SV Total RNA Isolation kit (Promega). First-strand cDNA was generated from 1 μg of total RNA from the microglia using Advantage RT-for-PCR kit with oligo-dT12–18 primers in a final volume of 100 μl (Clontech Laboratories). Real-time PCR reactions were conducted with Faststart SYBR Green Master Mix (Roche Molecular Biochemicals). Briefly, 0.5 μm primers, 2 mm MgCl2, 1× FastStart SYBR Green Master mix, and 2 μl of diluted cDNA were used. The primers were synthesized by Invitrogen: interleukin-1β (IL-1β) (5′TGAATGCCATTTTGACA3′, 5′GTAGCTGCCACAGCTTCTCC3′), IL-6 (5′TTCCATCCAGTTGCCTTCTT3′, 5′CAGAATTGCCATTGCACAAC3′), tumor necrosis factor α (TNF-α) (5′CTGTGAAGGGAATGGGTGTT3′, 5′GGTCACTGTCCCAGCATCTT3′), and NOS2 (5′CTCACTGGGACAGCACAGAA3′, 5′TGGTCAAACTCTTGGGGTTC3′). Real-time PCR was conducted on Rotorgene 6000 (Qiagen) using hot start with cycle conditions, 40 cycles: 95°C for 15 s, 60°C for 2 s, and 72°C for 15 s, followed by a melt from 75 to 95°C, and a final 72°C extension for 5 min. Quantitation of the mRNA was based on standard curves derived from cDNA standards for each primer set. Positive and negative cDNA controls were used for each primer set derived from known cell sources for each cytokine. The fold increase was determined based on the mRNA expression of control cells for each condition. Significant increase in mRNA expression for treated cells was based on at least a twofold increase over the controls. Significant difference between untreated and treated cells was determined using the Student's t test.
Cytokine measurement.
M4T.4 microglia were subjected to 2 h OGD plus 24 h REOX or 500 ng/ml LPS treatment for 24 h. Culture medium was collected and assayed for cytokine secretion using Bio-Plex Pro mouse 4 cytokine kit (Bio-Rad), as per the instructions of the manufacturer. Briefly, after prewetting the wells of a porous, flat-bottom 96-well filter microplate with wash buffer, 2500 coupled beads were added per well and washed by vacuum filtration with wash buffer. Coupled beads were incubated with culture medium samples (50 μl/well) for 30 min at room temperature in the dark with agitation. After washing twice with wash buffer, the beads were incubated with 0.8 μg of detection antibody in 50 μl of assay diluant for 30 min at room temperature in the dark with agitation. After washing, the beads were incubated with 100 ng of phycoerythrin (50 μl/well) for 10 min at room temperature in the dark with agitation. The beads were analyzed on Bio-Plex analyzer (Bio-Rad), and the cytokines were quantified based on a set of standards for the assay. Total cellular protein in each well was determined with the bicinchoninic acid method. Cytokine concentration was expressed as picograms per milligrams protein.
Results
Expression of NHE-1 in M4T.4 immortalized microglia and primary microglia
CD11b is expressed in immortalized M4T.4 microglia and primary microglia cells. Abundant NHE-1 protein expression was localized in both cell body and processes of microglia with a “ramified” morphology (Fig. 1A). Colocalization of NHE-1 and CD11b was found in M4T.4 and primary microglia cells (Fig. 1A, overlay). The NHE-1 protein remained abundant in microglia (either M4T.4 or primary) with the “amoeboid” morphology after LPS-mediated activation (100 ng/ml LPS for 12 h).
Figure 1.
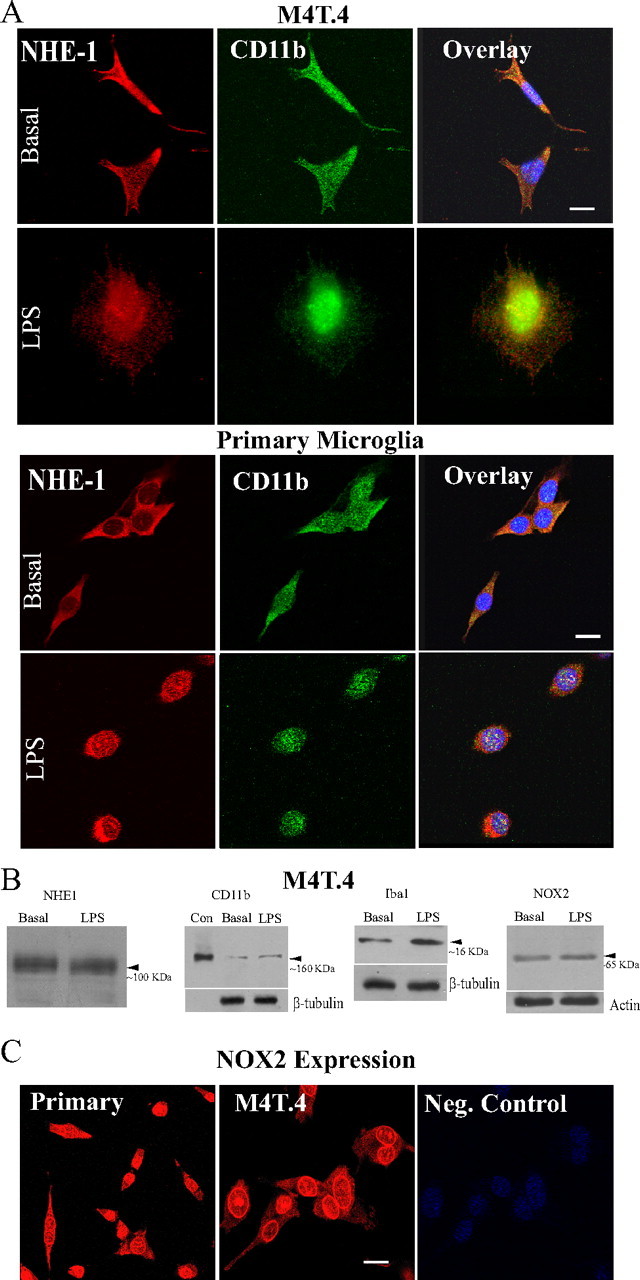
Expression of NHE-1 and CD11b in microglia. A, M4T.4 microglia and primary microglia expressed NHE-1 protein (red) and CD11b protein (green) at basal and stimulated conditions (LPS, 500 ng/ml, 24 h). Scale bar, 15 μm. B, NHE-1, CD11b, Iba 1, or NOX2 were detected in M4T.4 microglia with immunoblotting under basal conditions or after stimulation with LPS. CD11b-positive control (Con) was whole-cell lysates from a mouse leukemic monocyte macrophage cell line (Abcam). Either β-tubulin or actin was probed as a loading control. C, Expression of NOX2 protein in primary and M4T.4 microglia was visualized by immunostaining with an anti-NOX2/gp91phox antibody (red). Scale bar, 15 μm.
NHE-1 and CD11b protein expression in M4T.4 microglia was also shown by immunoblotting (Fig. 1B). NHE-1 protein band (∼100 kDa) was detected in both control and LPS-treated cells. M4T.4 cells exhibited abundant microglial marker proteins CD11b, Iba1, and NOX2 under control conditions and after the LPS treatment (Fig. 1B). Protein loading control was shown with similar levels of β-tubulin or actin expressed in each sample. Moreover, NOX2 protein expression in primary microglia was demonstrated by immunostaining (Fig. 1C).
NHE-1 maintains basal pHi in M4T.4 microglia and primary microglia
Changes of pHi in M4T.4 microglia were determined by the H+-sensitive dye BCECF. The selective and potent NHE-1 inhibitor HOE 642 (IC50 of 0.08 μm) was used to inhibit NHE-1 activity (Scholz et al., 1995). As shown in Figure 2A, M4T.4 microglia exhibited a basal pHi of 7.19 ± 0.03 in a HCO3−-free HEPES/MEM solution. When NHE-1 activity was inhibited by HOE 642, the basal pHi decreased to 6.82 ± 0.02 in the absence of HCO3− (p < 0.05). Interestingly, resting pHi was unchanged in the presence of 21 mm HCO3− (7.23 ± 0.02). Inhibition of NHE-1 activity significantly reduced the basal pHi in the presence of HCO3− (7.03 ± 0.02, p < 0.05) (Fig. 2A). These data suggest that NHE-1 plays a role in regulating basal pHi of M4T.4 microglia.
Figure 2.
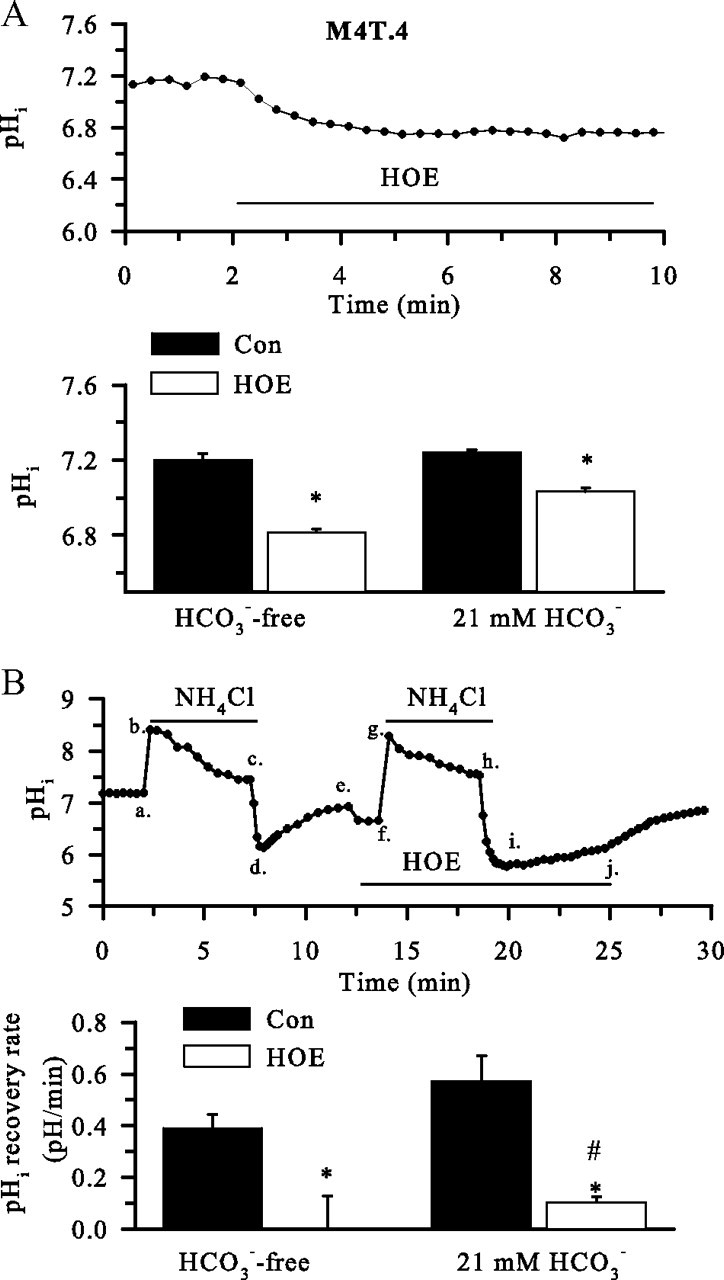
NHE-1 in regulation of basal pHi in M4T.4 microglia. A, Changes of pHi. Top, Representative trace of pHi showing response to the application of 1 μm HOE 642 over 8 min. Bottom, Baseline pHi and pHi after 8 min of treatment with 1 μm HOE 642 in the absence or presence of HCO3−. Data are mean ± SEM. n = 3–4. *p < 0.05 versus control (Con). B, Representative trace of pHi changes from a prepulse experiment in the presence or the absence of HOE 642 (1 μm). Cells were exposed to 30 mm NH4Cl for 5 min (a–c) and then returned to standard HCO3−-free HEPES-buffered solution (c–e), and the pHi recovery was monitored (d, e). The prepulse was repeated in the presence of HOE 642 (f–h), and the pHi recovery was monitored (i, j). pHi recovery rate during the first minute after prepulse acidification was calculated. In the experiments, the solutions were supplemented with 21 mm HCO3−/5% CO2 and 5 mm HEPES. Data are mean ± SEM. n = 5–6. *p < 0.05 versus control; #p < 0.05 versus HCO3−.
To investigate the role of NHE-1 in pHi regulation after acidosis, M4T.4 microglia were exposed to 30 mm NH3/NH4+ for 5 min. pHi rose rapidly to ∼8.5 as NH3 diffused into the cells and combined with H+ to form NH4+ (Fig. 2Ba,Bb), and pHi declined slowly to ∼7.5 with time (Fig. 2Bb,Bc). As the cells were returned to the standard HCO3−-free HEPES/MEM solution, pHi dropped sharply to ∼6 as a result of the newly formed NH4 rapidly leaving cells as NH3, trapping H+ inside (Fig. 2Bc,Bd). These are classical responses to the NH3/NH4+ prepulse. After this acid loading, M4T.4 microglia were able to restore pHi to their basal levels within 5 min (Fig. 2Bd, be) at an initial rate of ∼0.38 pH/min. However, when the second NH3/NH4+ prepulse was repeated in the presence of NHE-1 inhibitor HOE 642 (Fig. 2Bf–Bi), the pHi recovery in M4T.4 microglia was abolished (Fig. 2Bi,Bj).
In the presence of a standard HCO3−-containing solution (21 mm), the pHi recovery rate was not significantly altered in M4T.4 microglia (Fig. 2B). When NHE-1 was inhibited with 1 μm HOE 642, the pHi recovery rate in M4T.4 microglia was blocked by 83% (Fig. 2B). Together, these findings illustrate that NHE-1 activity dominates in regulation of pHi in M4T.4 microglia either in the absence or the presence of HCO3−. The HOE 642-insensitive pHi recovery may reflect HCO3− transporters (such as Na+/ HCO3− cotransporters), which play a minor role in pHi regulation.
Activation of microglia by LPS or PMA stimulates NHE-1 activity
We hypothesized that activation of microglia would result in excessive H+ production after stimulation of NOX, which would activate NHE-1 function. To test this hypothesis, we stimulated primary microglia with LPS or PMA. Primary microglia were abundantly labeled with isolectin IB4 (Fig. 3A). LPS stimulation (100 ng/ml for 24 h) produced the classical microglial morphology change (from “ramified” to “amoeboid”) (Fig. 3B). An alkaline pHi was detected in the LPS-treated microglia. This stimulation was accompanied with ∼2.4-fold increase in pHi recovery rate (Fig. 3C). Similarly, treatment of primary microglia with PMA (100 nm) for 60 min alkalized pHi and stimulated pHi recovery rate by 4.1-fold (Fig. 3C, p < 0.05). Most importantly, inhibition of NHE-1 activity by its potent inhibitor HOE 642 abolished this H+ extrusion triggered by either LPS or PMA treatment (Fig. 3C). These data suggest that activation of microglia with LPS or PMA elevates NHE-1 activity and alkalinizes microglia.
Figure 3.
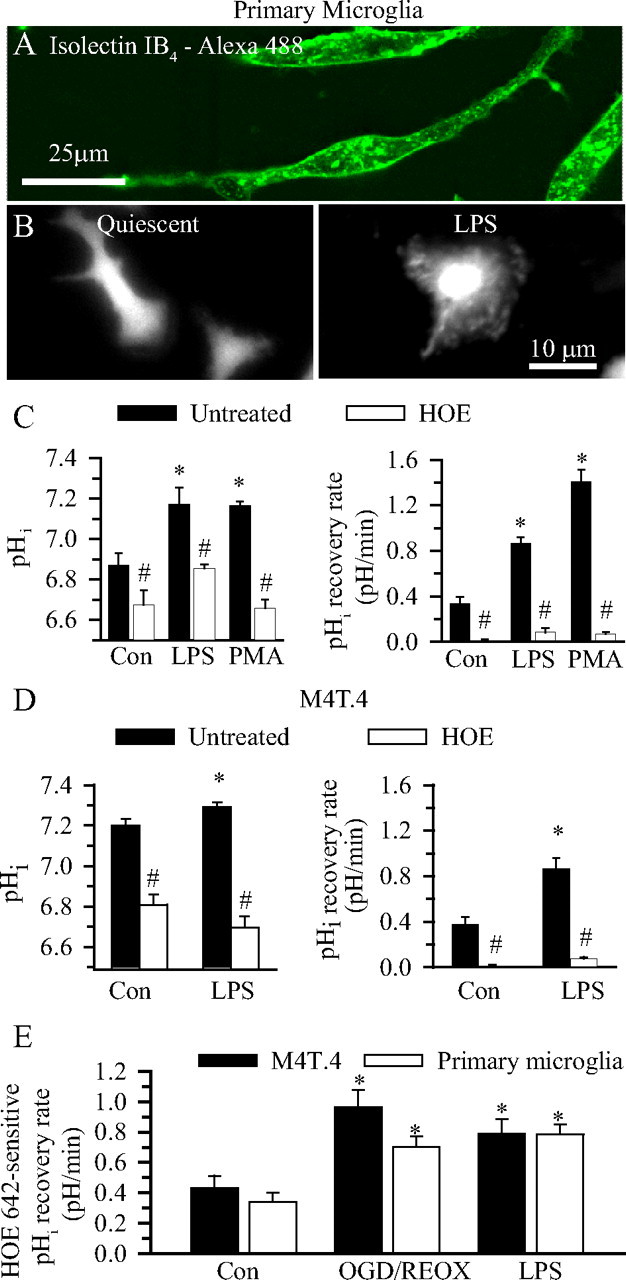
NHE-1 activity in activated microglia. A, Isolectin IB4-loaded primary microglia. B, BCECF-loaded images of primary microglia. Left, Control conditions. Right, Twenty-four hours of 100 ng/ml LPS. C, Primary microglia were subjected to 24 h of LPS stimulation (100 ng/ml) or 1 h of PMA (100 nm) stimulation in either the presence or absence of HOE 642 (1 μm). Βasal pHi and pHi regulation after the NH4+/NH3 prepulse were determined. Data are mean ± SEM. n = 3–5. *p < 0.05 versus control (Con); #p < 0.05 versus untreated. D, Changes in pHi of M4T.4 microglia after LPS stimulation (left). The cells were incubated with LPS (100 ng/ml) for 24 h in either the presence or absence of HOE 642 (1.0 μm). Data are mean ± SEM. n = 6–7. *p < 0.05 versus control; #p < 0.05 versus untreated. pHi regulation in M4T.4 cells after the NH4+/NH3 prepulse was shown in the right. Data are mean ± SEM. n = 6–7. *p < 0.05 versus control. #p < 0.05 versus untreated. E, HOE 642-sensitive pHi regulation was calculated under control, 2 h OGD/1 h REOX, or LPS conditions. Data are mean ± SEM. n = 6–7. *p < 0.05 versus control.
A similar observation was also made in M4T.4 microglia. As shown in Figure 3D, when M4T.4 microglia were exposed to 100 ng/ml LPS for 24 h, the pHi level increased to 7.29 ± 0.02 (n = 6, p < 0.05). The pHi recovery rates after the NH3/NH4+ prepulse were elevated by ∼2.3-fold (Fig. 3D). Moreover, inhibition of NHE-1 activity with HOE 642 significantly acidified M4T.4 microglia and nearly abolished pHi recovery capacity (Fig. 3D). These data suggest that LPS stimulates H+ extrusion through activation of NHE-1 in M4T.4 microglia to maintain an optimal alkaline pHi for NOX function.
To determine whether NHE-1 functions in M4T.4 and primary microglia in a similar manner, we calculated the HOE 642-sensitive pHi regulation (Fig. 3E). There was no difference in basal NHE-1 activity between the cell line and the primary cells. Moreover, NHE-1-mediated pHi regulation rate was significantly stimulated by LPS or OGD/REOX in both M4T.4 and primary microglia.
Activation of microglia with OGD/REOX stimulates NHE-1 activity
M4T.4 microglia and primary microglia were stimulated by 2 h OGD and 60 min REOX. As shown in Figure 4, A and B, M4T.4 microglia exhibited an alkaline pHi after OGD/REOX. The pHi recovery rate in the OGD/REOX-treated M4T.4 microglia was increased by ∼2.4-fold, which allowed cells to restore pHi to their basal levels within 2 min after the NH3/NH4+ prepulse. In contrast, in the presence of 1.0 μm HOE 642, M4T.4 microglia exhibited an acidic basal pHi and failed to regulate pHi after the NH3/NH4+ prepulse (Fig. 4A,C). Moreover, in the presence of the general NHE inhibitor ethylisopropylamiloride (EIPA) (100 μm), M4T.4 microglia exhibited reduced basal pHi and failure to regulate pHi. In contrast, the vacuolar-type ATPase H+ pump inhibitor bafilomycin (1 μm) had no effects on OGD/REOX-mediated pHi alkalization or pHi recovery after the NH4+Cl prepulse (Fig. 4B,C). This suggests that the vacuolar-type ATPase H+ pump is not involved in regulation of pHi in M4T.4 microglia. Thus, NHE-1 is the dominate NHE isoform regulating pHi after OGD/REOX.
Figure 4.
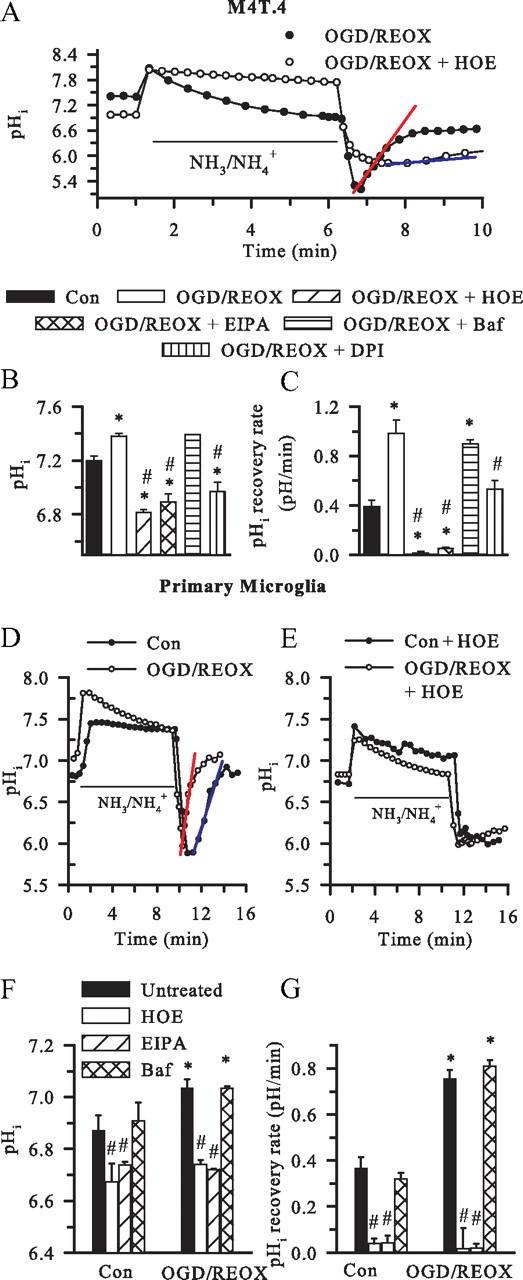
Stimulation of NHE-1 activity in microglia after OGD/REOX. A, Representative traces of pHi during the NH4+/NH3 prepulse in M4T.4 microglia after 2 h OGD and 60 min REOX. In the HOE 642 experiments, the drug was present only during 60 min REOX. Red line, pHi recovery rate in OGD/REOX control cells. Blue line, pHi recovery rate in OGD/REOX plus HOE 642-treated cells. Con, Control. B, Summary of pHi in M4T.4 microglia. In the drug treatment experiments, HOE 642 (1 μm), EIPA (100 μm), bafilomycin (1 μm), or DPI (1 μm) was present during REOX only. C, pHi recovery rate after NH4+/NH3 prepulse in M4T.4 microglia. Data are mean ± SEM. n = 3–10. *p < 0.05 versus control; #p < 0.05 versus OGD/REOX. D, Representative traces of pHi recovery in primary microglia after 2 h OGD and 60 min REOX. E, pHi recovery in primary microglia when NHE-1 activity was inhibited. The HOE 642 (1.0 μm) was only present during 60 min REOX. F, pHi changes in primary microglia. G, pHi regulation in primary microglia after the NH4+/NH3 prepulse. Data are mean ± SEM. n = 3–5. *p < 0.05 versus control; #p < 0.05 versus untreated .
We speculated that the NHE-1 activity-mediated pHi regulation was triggered by NOX activation and H+ production. To test this further, we investigated the effects of inhibition of NOX activity by DPI on NHE-1 function. It should be noted that DPI is a general inhibitor of electron transporters. It not only inhibits all NOX isoforms but also other electron transporters, such as nicotinamide adenine dinucleotide coenzyme Q reductase and nitric oxide synthase (Lambeth et al., 2008). Interestingly, when DPI (1 μm) was present during 60 min REOX, the OGD/REOX-mediated stimulation of NHE-1 activity was reduced by ∼50% at 60 min REOX (from 0.98 ± 0.13 to 0.53 ± 0.07 pH/min) (Fig. 4B,C). These findings further support our view that stimulation of NOX after OGD/REOX concurrently upregulates NHE-1 activity.
In primary microglia, OGD/REOX triggered an increase in the initial pHi recovery rate (0.37 ± 0.05 vs 0.75 ± 0.04 pH/min) (Fig. 4D,G). Primary microglia also exhibited a more alkaline pHi after 2 h OGD/60 min REOX. Inhibition of NHE-1 with HOE 642 or EIPA not only acidified the cell but also abolished the pHi recovery (Fig. 4F,G). Similar to M4T.4 cells, bafilomycin (1 μm) did not affect the OGD/REOX-mediated changes in pHi or pH regulation (7.11 ± 0.55 vs 7.14 ± 0.04, p > 0.05) (Fig. 4F,G). Moreover, no changes of basal pHi were observed in primary microglia in the presence of HCO3−/CO2 buffer (7.23 ± 0.02 vs 7.24 ± 0.02, p > 0.05).
Elevation of [Na+]i and [Ca2+]i in M4T.4 microglia after either LPS or OGD/REOX treatment
Overstimulation of NHE-1 activity will lead to intracellular Na+ overload and Ca2+ influx via the reversal mode of Na+/Ca2+ exchange (NCXrev) (Kintner et al., 2005; Luo et al., 2005). Changes of [Na+]i and [Ca2+]i were determined in M4T.4 microglia after LPS or OGD/REOX treatment. Basal [Na+]i in M4T.4 microglia was low (Fig. 5A, arrow). OGD/REOX resulted in an increase in [Na+]i (Fig. 5A, arrowhead). Figure 5B summarized OGD/REOX- or LPS-mediated elevation in [Na+]i (from a basal level of 12.4 ± 0.4 to 28.6 ± 1.2 or 33.1 ± 1.9 mm, respectively, p < 0.05). Inhibition of NHE-1 with HOE 642 significantly reduced the Na+ overload in M4T.4 microglia induced by either LPS or OGD/REOX (Fig. 5A,B).
Figure 5.
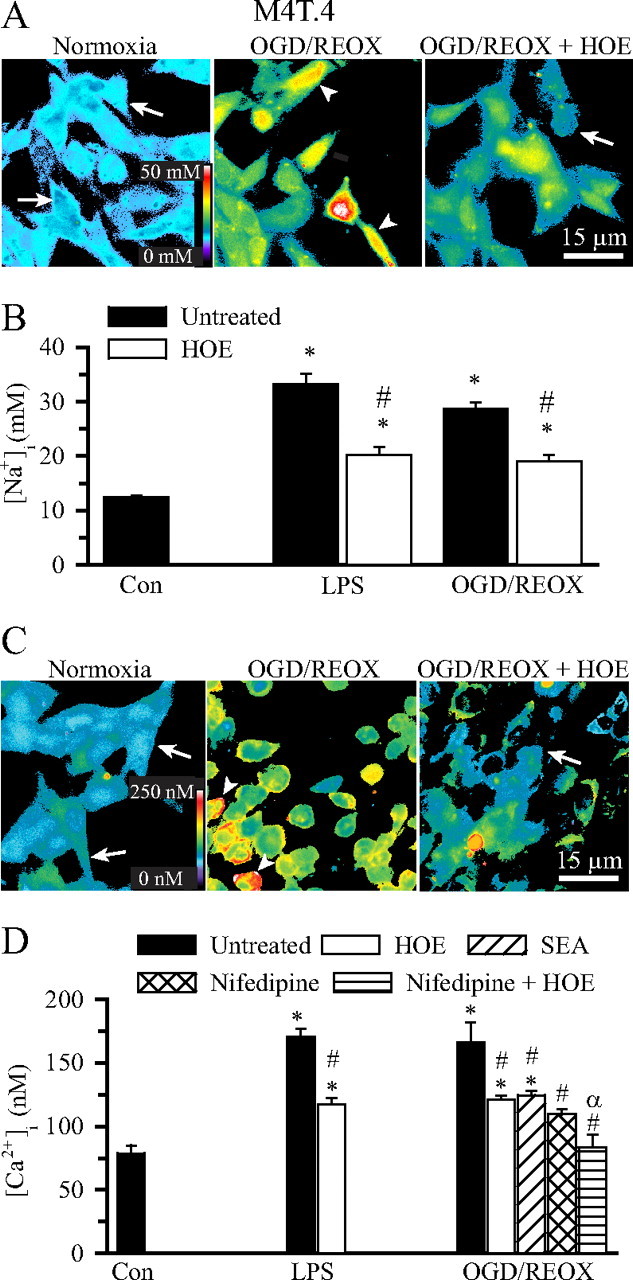
Elevation of [Na+]i and [Ca2+]i in activated M4T.4 microglia. A, Representative SBFI pseudocolored images of changes in [Na+]i in M4T.4 microglia under normoxia, 2 h OGD/60 min REOX, or 2 h OGD/60 min REOX plus HOE 642. HOE 642 (1.0 μm) was present only during 60 min REOX. Arrow, Low [Na+]i; arrowhead, elevated [Na+]i. B, Changes in [Na+]i after either 24 h LPS treatment (500 ng/ml) or 2 h OGD and 60 min REOX. Data are mean ± SEM. n = 3–7. *p < 0.05 versus control (Con). #p < 0.05 versus OGD/REOX. C, Representative fura-2 pseudocolored images of changes in [Ca2+]i in M4T.4 microglia. Arrow, Low [Ca2+]i; arrowhead, elevated [Ca2+]i. D, Changes in [Ca2+]i in M4T.4 microglia. Nifedipine (5 μm) or SEA0400 (1 μm) was present during 0–60 min REOX to inhibit L-type Ca2+ channel or the reverse-mode operation of Na+/Ca2+ exchange, respectively. Data are mean ± SEM. n = 4–7. *p < 0.05 versus control; #p < 0.05 versus OGD/REOX; αp < 0.05 versus OGD/REOX plus HOE 642.
We then examined whether activation of M4T.4 microglia triggered changes of [Ca2+]i. Control [Ca2+]i in M4T.4 microglia was 77 ± 7 nm (Fig. 5C,D). Either LPS treatment or OGD/REOX caused a significant increase in [Ca2+]i (170 ± 6 and 166 ± 16 nm, respectively, p < 0.05). Inhibition of NHE-1 activity with 1 μm HOE 642 during the LPS or REOX treatment significantly decreased the rise in [Ca2+]i (118 ± 5 nm in LPS, 121 ± 3 nm in OGD/REOX). The increase in [Ca2+]i after LPS treatment or OGD/REOX may result from a concurrent activation of NCXrev. To test this, NCXrev was inhibited by a potent and selective inhibitor SEA0400 (2-[4-[(2,5-difluorophenyl)methoxy] phenoxy]-5-ethoxyaniline). When NCXrev was inhibited with 1 μm SEA0400, the OGD/REOX-induced rise in [Ca2+]i was lower and similar to that in the presence of HOE 642 (Fig. 5C,D). When voltage-gated Ca2+ channels were inhibited with 5 μm nifedipine during REOX, [Ca2+]i was reduced to levels similar to HOE 642 treatment (110 ± 4 nm, p < 0.05). In the presence of both HOE 642 and nifedipine during REOX, [Ca2+]i was further decreased to the basal levels (83 ± 10 nm). Collectively, these data illustrate that stimulation of microglia with LPS or OGD/REOX triggered both intracellular Na+ and Ca2+ overload. NHE-1 activation contributes to the increase in [Na+]i, whereas activation of NCXrev and voltage-dependent Ca2+ channels collectively elevates [Ca2+]i.
Superoxide anion production in activated microglia
We further investigated (1) whether OGD/REOX leads to O2·− production via NOX and (2) whether it depends on NHE-1 function. First, changes in DHE signals were examined. As shown in Figure 6Aa, DHE signals were low in primary microglia under basal normoxic conditions (arrow). After 2 h OGD treatment, a few of the primary microglia exhibited increases in the nuclear DHE staining (arrowhead), whereas the remaining cells had a diffuse DHE staining pattern (Fig. 6Ab). Interestingly, a time-dependent increase in the nuclear DHE signals was detected at 60 min REOX (Fig. 6Ac, arrowhead). In contrast, when HOE 642 (1 μm) was present during 60 min REOX, the OGD/REOX-induced increase in the nuclear DHE signals was absent (Fig. 6Ad).
Figure 6.
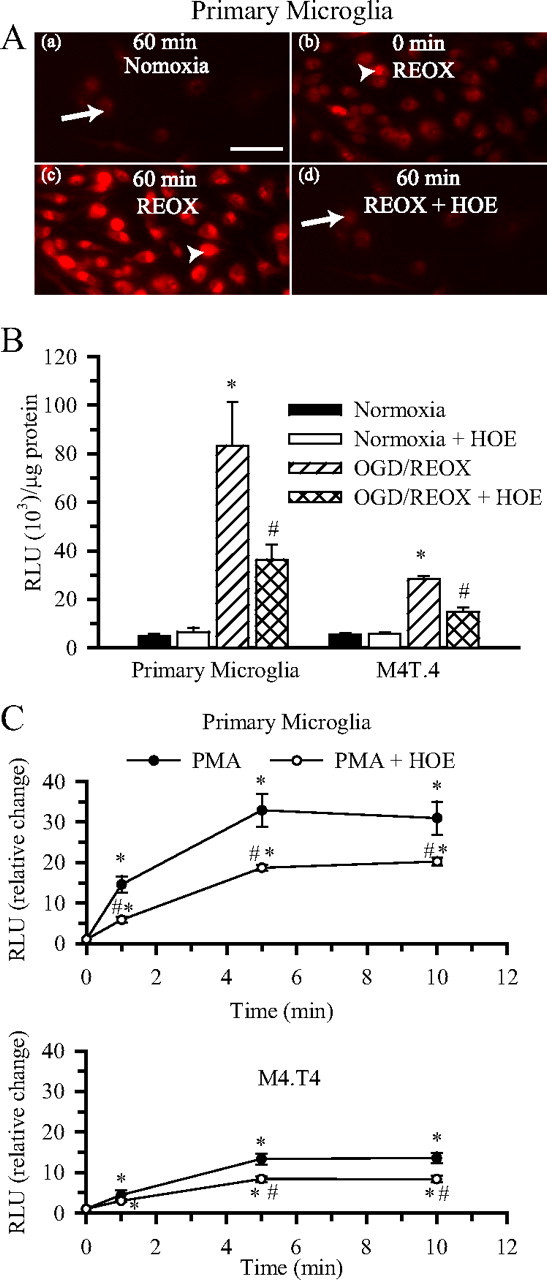
Role of NHE-1 in superoxide anion production in activated microglia. A, Changes in DHE staining in primary microglia at 60 min normoxia (a), 2 h OGD (b), 60 min REOX (c), or 60 min REOX plus 1.0 μm HOE 642 (d). Arrow, Diffused DHE staining; arrowhead, increased DHE staining primarily localized to the nucleus. All images were collected using identical acquisition parameters. Scale bar, 15 μm. B, Superoxide production was determined using the Diogenes kit under normoxic conditions or after 2 h OGD and 60 min REOX. HOE 642 (1.0 μm) was present only during REOX to selectively inhibit NHE-1 activity. RLU per microgram values were expressed. Data are mean ± SEM. n = 3. *p < 0.05 versus normoxia; #p < 0.05 versus OGD/REOX. C, PMA-mediated superoxide production was determined at 1, 5, and 10 min after stimulation with 100 nm PMA. In the HOE 642 experiments, 1.0 μm HOE 642 was added 20 min before and throughout the PMA exposure. RLU per micrograms per seconds values were normalized to the untreated values and expressed as relative change. Data are mean ± SEM. n = 3–6. *p < 0.05 versus 0 min; #p < 0.05 versus PMA alone.
To further evaluate NOX activity after OGD/REOX, we directly determined O2·− production using a chemiluminescence assay in primary microglia and M4T.4 cells. After 2 h OGD and 1 h REOX, O2·− production increased by ∼17-fold in primary microglia and ∼5-fold in M4T.4 cells (Fig. 6B). HOE 642 (1 μm) treatment during 1 h REOX reduced O2·− production by ∼50% in both the microglia cell line and the primary microglia.
As a positive control, we also stimulated primary microglia and M4T.4 cells with 100 nm PMA and monitored O2·− production within a 10 min period (Fig. 6C). PMA caused a rapid increase in O2·− production by 1 min in primary microglia and reached a plateau level at 5 min in the presence of PMA (32.9 ± 4.0 RLU/μg). By 10 min PMA treatment, O2·− increased by 31.0 ± 4.1-fold (p < 0.05). Interestingly, inhibition of NHE-1 with 1 μm HOE 642 during PMA stimulation reduced O2·− production by ∼35% at 10 min (Fig. 6C). In comparison, M4T.4 microglia exhibited less O2·− production in the presence of PMA (13.3 ± 1.3-fold increase at 10 min). However, this activation in O2·− production was also suppressed by inhibition of NHE-1 activity. Together, these data further support our view that blocking NHE-1 activity in microglia decreases NOX activity and O2·− production.
Induction of cytokines and effector molecules after LPS or OGD/REOX treatment
We next investigated whether inhibition of NHE-1 activity can reduce mRNA expression of proinflammatory cytokines, which are markers of microglial activation: IL-1β, TNF-α, IL-6, and NOS2. As shown in Figure 7, microglia treated with LPS (500 ng/ml) for 24 h triggered an ∼20-fold increase in IL-1β mRNA, approximately fivefold increase in IL-6 mRNA, approximately fivefold increase in TNF-α mRNA, and approximately sixfold increase in NOS2 mRNA expression. These results are similar to those observed previously with LPS stimulation of primary microglia cultures (Olson and Miller, 2004). With NHE-1 inhibition, the LPS-mediated elevation of these proinflammatory cytokine mRNAs was abolished. After the OGD/REOX treatment, microglial mRNA expression of IL-1β, TNF-α, IL-6, and NOS2 was significantly upregulated by approximately ninefold, approximately fourfold, approximately fourfold, and approximately twofold, respectively. Blocking NHE-1 activity with HOE 642 (1 μm) attenuated the OGD/REOX-mediated mRNA expression of IL-1β, TNF-α, IL-6, and NOS2 (Fig. 7). These data suggest that LPS and OGD/REOX treatments trigger microglial proinflammatory responses and NHE-1 function plays a role in this process.
Figure 7.
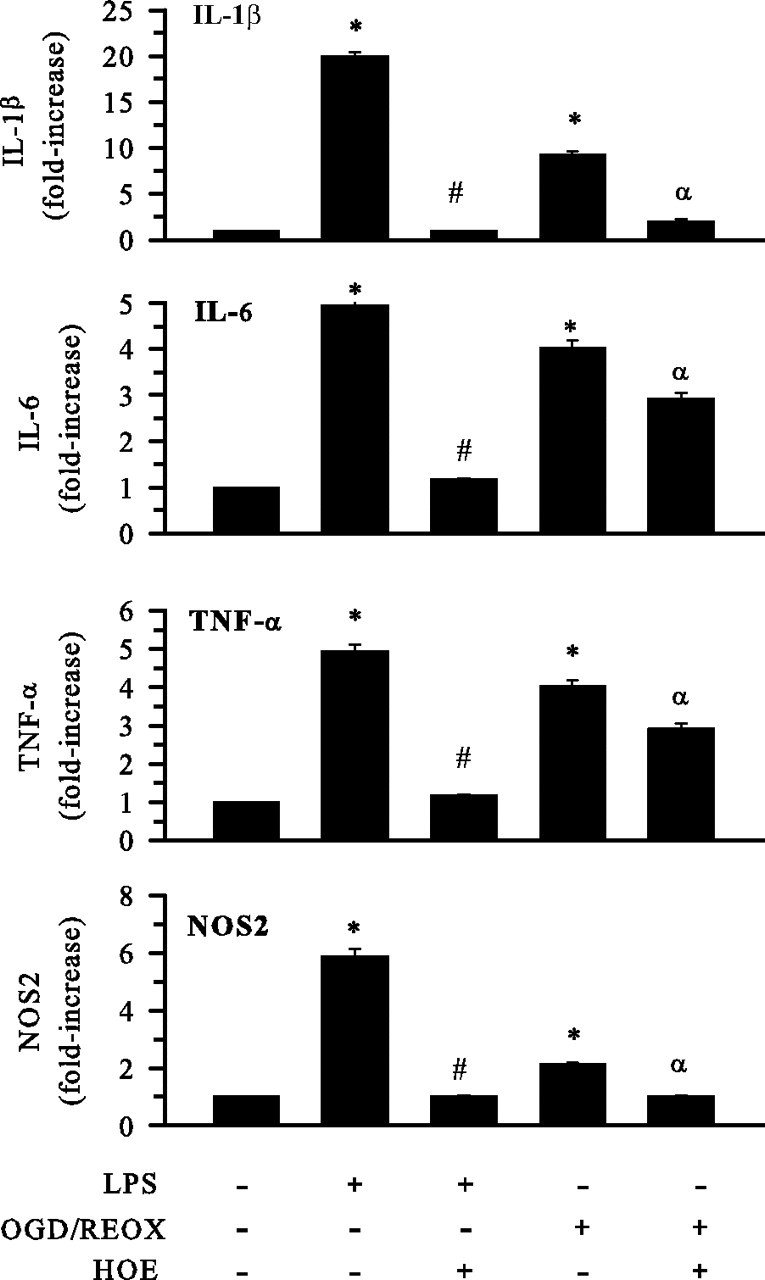
Inhibition of NHE-1 activity reduces cytokines and NOS2 mRNA levels in activated microglia. Expression of mRNA for innate immune cytokines and NOS2 was determined in M4T.4 cells after either 24 h LPS treatment (500 ng/ml) or 24 h REOX after 2 h OGD. HOE 642 at 1 μm was present during 24 h LPS or REOX treatment. Real-time PCR was conducted with primers specific for IL-1β, IL-6, TNF-α, or NOS2. The mRNA expression was measured in femtograms after normalization and based on a standard curve for each primer pair. Relative changes in mRNAs are shown. Data are mean ± SD. n = 3. *p < 0.05 versus normoxic control; #p < 0.05 versus LPS treatment; αp < 0.05 versus OGD/REOX.
Next, we investigated changes in the secretion of proinflammatory cytokines (IL-1β, IL-6, and TNF-α) in M4T.4 after stimulation with LPS or OGD/REOX (Fig. 8). LPS treatment of M4T.4 microglia (500 ng/ml for 24 h) increased IL-1β, IL-6, and TNF-α levels by approximately sevenfold, approximately threefold, and approximately threefold, respectively. OGD/REOX triggered an approximately eightfold increase in IL-1β level, approximately fourfold increase in IL-6 level, and approximately twofold increase in TNF-α level (Fig. 8). Similarly, primary microglia also exhibited LPS-mediated cytokine release (approximately twofold, approximately fivefold, and approximately twofold increased release of IL-1β, IL-6, and TNF-α, respectively). In primary microglia, OGD/REOX led to approximately threefold, approximately fivefold, and approximately threefold increase in generation of these cytokines, respectively (Fig. 9). Interestingly, blocking NHE-1 activity with HOE 642 (1 μm) significantly attenuated the OGD/REOX and LPS-mediated production of these proinflammatory cytokines in both M4T.4 (Fig. 8) and primary microglia (Fig. 9). Conversely, no changes were observed in the anti-inflammatory IL-10 expression after OGD/REOX and LPS treatments (data not shown).
Figure 8.
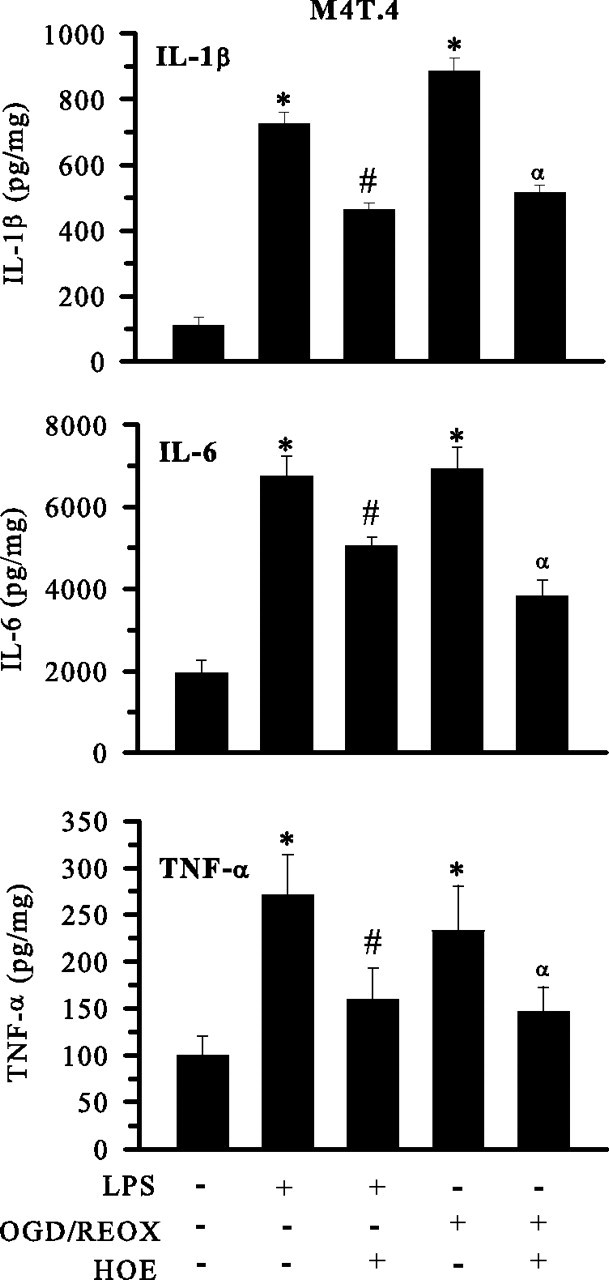
Inhibition of NHE-1 activity reduces cytokine release from activated M4T.4 microglia. Release of innate immune cytokines was determined in M4T.4 cells after either 24 h LPS treatment (500 ng/ml) or 24 h REOX after 2 h OGD. HOE 642 at 1 μm was present during 24 h LPS or REOX treatment. Levels of released cytokines are expressed in picograms per milligram protein. Data are mean ± SD. n = 3. *p < 0.05 versus normoxic control; #p < 0.05 versus LPS treatment; αp < 0.05 versus OGD/REOX.
Figure 9.
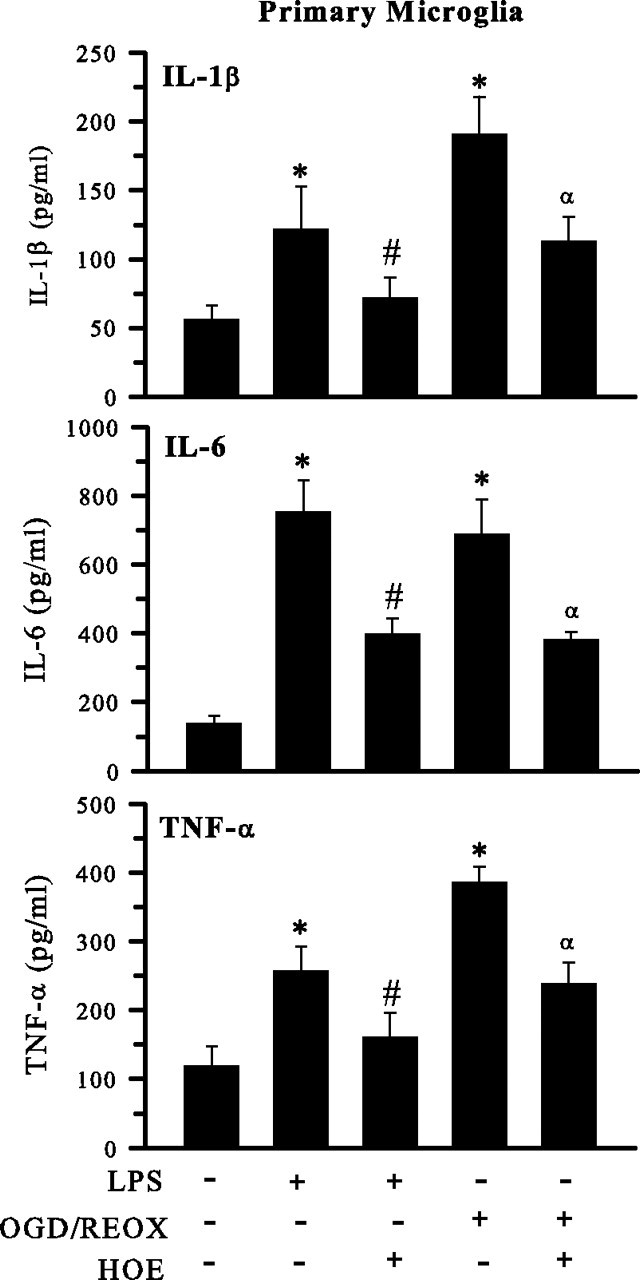
Inhibition of NHE-1 activity reduces cytokine release from activated primary microglia. Release of innate immune cytokines was determined in primary microglia cells after either 24 h LPS treatment (500 ng/ml) or 24 h REOX after 2 h OGD. HOE 642 at 1 μm was present during 24 h LPS or REOX treatment. Released cytokines are expressed in picograms per milligrams. Data are mean ± SD. n = 3. *p < 0.05 versus normoxic control; #p < 0.05 versus LPS treatment; αp < 0.05 versus OGD/REOX.
Discussion
The role of NHE-1 in steady-state pHi regulation of microglia
NHE-1 function is an important acid extrusion mechanism that regulates the pHi of cortical neurons, astrocytes, and macrophages (Swallow et al., 1993; Kintner et al., 2004; Luo et al., 2005). However, the role of NHE-1 in regulation of microglial pHi has not yet been defined. In this study, we detected abundant expression of NHE-1 protein in primary microglia and M4T.4 microglia under resting conditions. Moreover, blocking NHE-1 function with the most potent NHE-1 inhibitor HOE 642 significantly acidified primary microglia and M4T.4 microglia in either the presence or absence of CO2/HCO3−. Moreover, the pHi recovery capacity after the NH3/NH4+-mediated acidosis was abolished in primary microglia and M4T.4 cells in the presence of HOE 642. These results provide first-line evidence that NHE-1 plays a key role in maintaining resting pHi and extruding H+ after acidosis in microglia.
To our knowledge, there is only one report suggesting that Na+/H+ exchanger is involved in pHi recovery after intracellular acidosis in mouse primary microglia (Faff et al., 1996), using the nonselective NHE inhibitors amiloride or EIPA. These inhibitors may block other Na+-dependent transporters or channels (Murphy and Allen, 2009). HOE 642 at 1 μm selectively and specifically inhibit NHE-1 without affecting NHE-2, NHE-3, or NHE-5 (Scholz et al., 1995). The selectivity of NHE-1 inhibition by HOE 642 has been further established in NHE-1−/− neurons and NHE-1−/− astrocytes (Kintner et al., 2004; Luo et al., 2005).
Electrophysiological studies have demonstrated that microglia possess several ion channels such as K+, Na+, Ca2+, H+, and nonselective cationic channels (McLarnon et al., 1997). A vacuolar-type H+ ATPase has also been shown to regulate cytoplasmic pH in murine macrophages (Swallow et al., 1990; Murphy and Allen, 2009). In the current study, we observed that NHE-1 activity dominates in regulation of pHi in microglia in either the absence or presence of HCO3−. Other HCO3− transporters (such as Na+/ HCO3− cotransporters) play a minor role in pHi regulation.
Stimulation of NHE-1 activity during microglial activation
We further investigated the function of NHE-1 in microglia stimulated with LPS and hypoxic and ischemic insult (OGD/REOX). LPS activates the immune response and has been shown to activate microglia in both in vitro and in vivo animal models of inflammation-mediated neurodegeneration (Gao et al., 2002; Carvey et al., 2003). In the current study, the expression level of NHE-1 proteins was not altered in M4T.4 microglia after LPS stimulation. However, LPS triggered a significant alkaline shift in pHi (∼7.3) and ∼2.3-fold increase in pHi recovery rate. Blocking NHE-1 activity with HOE 642 not only acidified microglia but also abolished the H+ extrusion. These findings imply that activation of microglia with LPS concurrently stimulates NHE-1 activity to maintain H+ homeostasis.
A role for activated microglia in acute brain injuries, such as cerebral ischemia, has been proposed (Sugawara et al., 2002; Kauppinen et al., 2008; Tambuyzer et al., 2009). Nakajima and Kohsaka (2004) have shown that microglia are activated within minutes of cerebral vessel occlusion. However, the role of NHE-1 function in the activation of microglia after ischemia is unknown. In the current study, we found that microglia exhibited twofold to threefold increase in H+ extrusion rate after OGD/REOX. Interestingly, inhibition of NHE-1 activity abolished pHi recovery in these cells. These findings clearly illustrate that OGD/REOX treatment significantly enhanced NHE-1 activity in microglia to maintain pHi homeostasis. Neither the general NHE inhibitor EIPA nor the vacuolar-type ATPase H+ pump inhibitor bafilomycin had any effects on OGD/REOX-mediated pHi alkalization or pHi recovery. This suggests that the vacuolar-type ATPase H+ pump or other NHE isoforms are not involved in regulation of pHi in activated microglia.
We believe that the significance of an increased NHE-1 activity lies in sustaining NADPH oxidase activity in activated microglia. In the absence of a balancing charge movement, activation of NADPH oxidase activity would increase cytosolic H+ concentration and cause a rapid intracellular acidification and membrane depolarization (Fig. 10). NADPH oxidase activity is markedly sensitive to [H+]i. A pHi lower than 6.8 significantly renders NADPH oxidase activation and leads to impaired O2·− generation (Swallow et al., 1993). Thus, a concurrent stimulation of NHE-1-mediated H+ extrusion would prevent intracellular acidosis and provide an optimal pHi for a sustained NADPH oxidase function during microglial activation (Fig. 10).
Figure 10.

Proposed mechanisms underlying NHE-1 in promotion of microglial activation. In response to ischemia or LPS, brain microglia are activated to produce a “respiratory burst,” which generates ROS, in particular O2·− and peroxynitrite. During the respiratory burst, microglial NADPH oxidase, which converts the O2 into the O2·−, expels electrons across the cell membrane and accumulates H+ inside microglia. Therefore, activation of microglia is associated with a large burst of intracellular H+ generation. The H+ extrusion mechanisms are then required to regulate the optimal pHi and limit depolarization of the microglia to maintain the activity of the NADPH oxidase. This task could be accomplished in part by NHE-1, H+ conductance, or a vacuolar H+-ATPase (the latter two not shown). NHE1-mediated [Na+]i overload and subsequent activation of NCXrev elevate [Ca2+]i and enhance the p38 mitogen-activated protein kinase- and/or NF-κB-mediated inflammatory responses that cause the death of target cells.
Coupling of NHE-1 activation with NCXrev in activated microglia
Recent studies have established a critical role for NCXrev in regulation of intracellular Ca2+ and microglial activation under ischemic conditions (Hoffmann et al., 2003; Newell et al., 2007). It was shown recently that Na+-dependent Ca2+ influx through NCXrev is necessary for bradykinin-induced microglial motility (Ifuku et al., 2007). Interferon-γ and NO exposure lead to increased activity and enhanced expression of NCX-1 in microglia (Matsuda et al., 2006). Enhanced NCX-1 expression and NCXrev function have also been reported in microglia after OGD (Boscia et al., 2009). However, little is known about coupled function of NHE-1 and NCXrev in disruption of Na+ and Ca2+ homeostasis in microglia.
In the current study, we detected an ∼2.6-fold rise in [Na+]i in microglia when it was stimulated by LPS or an ∼2.3-fold rise by OGD/REOX treatment. Inhibition of NHE-1 activity reduced this intracellular Na+ overload, implying that Na+ influx was NHE-1 mediated. Moreover, LPS exposure or OGD/REOX treatment triggered an approximately twofold increase in [Ca2+]i in microglia. This Ca2+ overload partially resulted from coupled activation of NHE-1 and NCXrev, because inhibition of NHE-1 activity with 1 μm HOE 642 or blocking NCXrev with SEA0400 significantly attenuated the Ca2+ overload. Such a concerted function of NHE-1 and NCXrev has been reported in ischemic myocardium, astrocytes, and neurons (Kintner et al., 2004; Luo et al., 2005; Fantinelli et al., 2006). Together, the present study provides first-line evidence demonstrating the role of NHE-1 in triggering NCXrev and Ca2+ signaling in activated microglia.
The role of NHE-1 in superoxide anion production in activated microglia
Na+-dependent Ca2+ overload via NCXrev plays a crucial role in microglial activation and generation of ROS during anoxia and ischemia (Li et al., 2000; Brookes et al., 2004). ROS, including those produced by microglia, are involved in numerous neurodegenerative processes (Chan, 2001; Harrigan et al., 2008; Innamorato et al., 2009). The ROS production in the activated microglia is primarily via NOX. In the present study, we detected significantly increased O2·− production in microglia after LPS, OGD/REOX, and PMA; the latter is a robust NOX stimulator in microglia (Harrigan et al., 2008). Inhibition of NHE-1 activity attenuated the production of O2·− under these conditions. These findings further support our hypothesis that NHE-1 plays an important role in generation of O2·− through maintaining H+ homeostasis, thereby allowing for sustained NADPH oxidase complex activation in activated microglia (Fig. 10).
ROS can subsequently trigger a cascade of activation of cytotoxic proinflammatory cytokine transcription and production (Block and Hong, 2007; Innamorato et al., 2009). Our hypothesis is further strengthened by our findings that cytotoxic proinflammatory cytokine mRNA expression and protein secretion are elevated after either LPS stimulation or OGD/REOX. Interestingly, pharmacological inhibition of NHE-1 activity reduced proinflammatory cytokine expression and secretion. These findings clearly illustrate that NHE-1 is involved in the proinflammatory responses after microglial activation (Fig. 10).
In our study, LPS and OGD/REOX triggered many similar signaling events in the activated microglia. However, it remains to be determined whether the two stimuli activate the same upstream regulatory pathways, such as extracellular signal-regulated protein kinase, p38, and Jun-N-terminal kinase, as well as the nuclear translocation of nuclear factor-κB.
In summary, this study provides first-line evidence for a role of NHE-1 in microglial H+ homeostasis. A concurrent stimulation of NHE-1 activity and the NADPH oxidase occurred in microglia activated by LPS, PMA, or OGD/REOX. This elevated H+ extrusion mechanism prevented intracellular acidosis and sustained NADPH oxidase function. Moreover, the coupling of NHE-1 activation with NCXrev activated [Na+]i and [Ca2+]i-dependent signaling and promoted microglial respiratory burst and production of cytotoxic proinflammatory cytokines and NOS2. Thus, Na+/H+ exchange plays an important role in regulation of microglial function.
Footnotes
This work was supported in part by National Institutes of Health Grants RO1NS048216 and R01NS048216 (D.S.), P30 HD03352 (Waisman Center), and NS43802, NS45048, NS36736, and NS56118 (J.C.), Award 1UL1RR025011 from the Clinical and Translational Science Award Program of National Center for Research Resources/National Institutes of Health (P.F.), the China Scholarship Council Postgraduate Scholarship Program (Y.L.), and Chinese Natural Science Foundation Grant 30870794 (Y.G.). We thank Dr. J. Watters for her advice on microglia culturing.
References
- Bedard K, Krause KH. The NOX family of ROS-generating NADPH oxidases: physiology and pathophysiology. Physiol Rev. 2007;87:245–313. doi: 10.1152/physrev.00044.2005. [DOI] [PubMed] [Google Scholar]
- Block ML, Hong JS. Chronic microglial activation and progressive dopaminergic neurotoxicity. Biochem Soc Trans. 2007;35:1127–1132. doi: 10.1042/BST0351127. [DOI] [PubMed] [Google Scholar]
- Boscia F, Gala R, Pannaccione A, Secondo A, Scorziello A, Di Renzo G, Annunziato L. NCX1 expression and functional activity increase in microglia invading the infarct core. Stroke. 2009;40:3608–3617. doi: 10.1161/STROKEAHA.109.557439. [DOI] [PubMed] [Google Scholar]
- Boyarsky G, Ransom B, Schlue WR, Davis MB, Boron WF. Intracellular pH regulation in single cultured astrocytes from rat forebrain. Glia. 1993;8:241–248. doi: 10.1002/glia.440080404. [DOI] [PubMed] [Google Scholar]
- Brookes PS, Yoon Y, Robotham JL, Anders MW, Sheu SS. Calcium, ATP, and ROS: a mitochondrial love-hate triangle. Am J Physiol Cell Physiol. 2004;287:C817–C833. doi: 10.1152/ajpcell.00139.2004. [DOI] [PubMed] [Google Scholar]
- Carvey PM, Chang Q, Lipton JW, Ling Z. Prenatal exposure to the bacteriotoxin lipopolysaccharide leads to long-term losses of dopamine neurons in offspring: a potential, new model of Parkinson's disease. Front Biosci. 2003;8:s826–s837. doi: 10.2741/1158. [DOI] [PubMed] [Google Scholar]
- Chan PH. Reactive oxygen radicals in signaling and damage in the ischemic brain. J Cereb Blood Flow Metab. 2001;21:2–14. doi: 10.1097/00004647-200101000-00002. [DOI] [PubMed] [Google Scholar]
- Chen H, Song YS, Chan PH. Inhibition of NADPH oxidase is neuroprotective after ischemia-reperfusion. J Cereb Blood Flow Metab. 2009;29:1262–1272. doi: 10.1038/jcbfm.2009.47. [DOI] [PMC free article] [PubMed] [Google Scholar]
- De Vito P. The sodium/hydrogen exchanger: a possible mediator of immunity. Cell Immunol. 2006;240:69–85. doi: 10.1016/j.cellimm.2006.07.001. [DOI] [PubMed] [Google Scholar]
- Faff L, Ohlemeyer C, Kettenmann H. Intracellular pH regulation in cultured microglial cells from mouse brain. J Neurosci Res. 1996;46:294–304. doi: 10.1002/(SICI)1097-4547(19961101)46:3<294::AID-JNR2>3.0.CO;2-F. [DOI] [PubMed] [Google Scholar]
- Fantinelli JC, Cingolani HE, Mosca SM. Na+/H+ exchanger inhibition at the onset of reperfusion decreases myocardial infarct size: role of reactive oxygen species. Cardiovasc Pathol. 2006;15:179–184. doi: 10.1016/j.carpath.2006.04.005. [DOI] [PubMed] [Google Scholar]
- Gao HM, Jiang J, Wilson B, Zhang W, Hong JS, Liu B. Microglial activation-mediated delayed and progressive degeneration of rat nigral dopaminergic neurons: relevance to Parkinson's disease. J Neurochem. 2002;81:1285–1297. doi: 10.1046/j.1471-4159.2002.00928.x. [DOI] [PubMed] [Google Scholar]
- Hanisch UK, Kettenmann H. Microglia: active sensor and versatile effector cells in the normal and pathologic brain. Nat Neurosci. 2007;10:1387–1394. doi: 10.1038/nn1997. [DOI] [PubMed] [Google Scholar]
- Harrigan TJ, Abdullaev IF, Jourd'heuil D, Mongin AA. Activation of microglia with zymosan promotes excitatory amino acid release via volume-regulated anion channels: the role of NADPH oxidases. J Neurochem. 2008;106:2449–2462. doi: 10.1111/j.1471-4159.2008.05553.x. [DOI] [PMC free article] [PubMed] [Google Scholar]
- Heming TA, Bidani A. Na+-H+ exchange in resident alveolar macrophages: activation by osmotic cell shrinkage. J Leukoc Biol. 1995;57:609–616. doi: 10.1002/jlb.57.4.609. [DOI] [PubMed] [Google Scholar]
- Henderson LM, Chappell JB, Jones OT. Internal pH changes associated with the activity of NADPH oxidase of human neutrophils. Further evidence for the presence of an H+ conducting channel. Biochem J. 1988;251:563–567. doi: 10.1042/bj2510563. [DOI] [PMC free article] [PubMed] [Google Scholar]
- Hoffmann A, Kann O, Ohlemeyer C, Hanisch UK, Kettenmann H. Elevation of basal intracellular calcium as a central element in the activation of brain macrophages (microglia): suppression of receptor-evoked calcium signaling and control of release function. J Neurosci. 2003;23:4410–4419. doi: 10.1523/JNEUROSCI.23-11-04410.2003. [DOI] [PMC free article] [PubMed] [Google Scholar]
- Ifuku M, Färber K, Okuno Y, Yamakawa Y, Miyamoto T, Nolte C, Merrino VF, Kita S, Iwamoto T, Komuro I, Wang B, Cheung G, Ishikawa E, Ooboshi H, Bader M, Wada K, Kettenmann H, Noda M. Bradykinin-induced microglial migration mediated by B1-bradykinin receptors depends on Ca2+ influx via reverse-mode activity of the Na+/Ca2+ exchanger. J Neurosci. 2007;27:13065–13073. doi: 10.1523/JNEUROSCI.3467-07.2007. [DOI] [PMC free article] [PubMed] [Google Scholar]
- Innamorato NG, Lastres-Becker I, Cuadrado A. Role of microglial redox balance in modulation of neuroinflammation. Curr Opin Neurol. 2009;22:308–314. doi: 10.1097/WCO.0b013e32832a3225. [DOI] [PubMed] [Google Scholar]
- Kauppinen TM, Higashi Y, Suh SW, Escartin C, Nagasawa K, Swanson RA. Zinc triggers microglial activation. J Neurosci. 2008;28:5827–5835. doi: 10.1523/JNEUROSCI.1236-08.2008. [DOI] [PMC free article] [PubMed] [Google Scholar]
- Kintner DB, Su G, Lenart B, Ballard AJ, Meyer JW, Ng LL, Shull GE, Sun D. Increased tolerance to oxygen and glucose deprivation in astrocytes from Na+/H+ exchanger isoform 1 null mice. Am J Physiol Cell Physiol. 2004;287:C12–C21. doi: 10.1152/ajpcell.00560.2003. [DOI] [PubMed] [Google Scholar]
- Kintner DB, Look A, Shull GE, Sun D. Stimulation of astrocyte Na+/H+ exchange activity in response to in vitro ischemia depends in part on activation of ERK1/2. Am J Physiol Cell Physiol. 2005;289:C934–C945. doi: 10.1152/ajpcell.00092.2005. [DOI] [PMC free article] [PubMed] [Google Scholar]
- Lambeth JD, Krause KH, Clark RA. NOX enzymes as novel targets for drug development. Semin Immunopathol. 2008;30:339–363. doi: 10.1007/s00281-008-0123-6. [DOI] [PubMed] [Google Scholar]
- Lenart B, Kintner DB, Shull GE, Sun D. Na-K-Cl cotransporter-mediated intracellular Na+ accumulation affects Ca2+ signaling in astrocytes in an in vitro ischemic model. J Neurosci. 2004;24:9585–9597. doi: 10.1523/JNEUROSCI.2569-04.2004. [DOI] [PMC free article] [PubMed] [Google Scholar]
- Li S, Jiang Q, Stys PK. Important role of reverse Na+-Ca2+ exchange in spinal cord white matter injury at physiological temperature. J Neurophysiol. 2000;84:1116–1119. doi: 10.1152/jn.2000.84.2.1116. [DOI] [PubMed] [Google Scholar]
- Luo J, Chen H, Kintner DB, Shull GE, Sun D. Decreased neuronal death in Na+/H+ exchanger isoform 1-null mice after in vitro and in vivo ischemia. J Neurosci. 2005;25:11256–11268. doi: 10.1523/JNEUROSCI.3271-05.2005. [DOI] [PMC free article] [PubMed] [Google Scholar]
- Luo J, Kintner DB, Shull GE, Sun D. ERK1/2-p90RSK-mediated phosphorylation of Na+/H+ exchanger isoform 1. A role in ischemic neuronal death. J Biol Chem. 2007;282:28274–28284. doi: 10.1074/jbc.M702373200. [DOI] [PubMed] [Google Scholar]
- Ma E, Haddad GG. Expression and localization of Na+/H+ exchangers in rat central nervous system. Neuroscience. 1997;79:591–603. doi: 10.1016/s0306-4522(96)00674-4. [DOI] [PubMed] [Google Scholar]
- Matsuda T, Nagano T, Takemura M, Baba A. Topics on the Na+/Ca2+ exchanger: responses of Na+/Ca2+ exchanger to interferon-gamma and nitric oxide in cultured microglia. J Pharmacol Sci. 2006;102:22–26. doi: 10.1254/jphs.fmj06002x4. [DOI] [PubMed] [Google Scholar]
- McLarnon JG, Xu R, Lee YB, Kim SU. Ion channels of human microglia in culture. Neuroscience. 1997;78:1217–1228. doi: 10.1016/s0306-4522(96)00680-x. [DOI] [PubMed] [Google Scholar]
- Murphy E, Allen DG. Why did the NHE inhibitor clinical trials fail? J Mol Cell Cardiol. 2009;46:137–141. doi: 10.1016/j.yjmcc.2008.09.715. [DOI] [PMC free article] [PubMed] [Google Scholar]
- Nakajima K, Kohsaka S. Microglia: neuroprotective and neurotrophic cells in the central nervous system. Curr Drug Targets Cardiovasc Haematol Disord. 2004;4:65–84. doi: 10.2174/1568006043481284. [DOI] [PubMed] [Google Scholar]
- Neumann H, Kotter MR, Franklin RJ. Debris clearance by microglia: an essential link between degeneration and regeneration. Brain. 2009;132:288–295. doi: 10.1093/brain/awn109. [DOI] [PMC free article] [PubMed] [Google Scholar]
- Newell EW, Stanley EF, Schlichter LC. Reversed Na+/Ca2+ exchange contributes to Ca2+ influx and respiratory burst in microglia. Channels (Austin) 2007;1:366–376. doi: 10.4161/chan.5391. [DOI] [PubMed] [Google Scholar]
- Olson JK, Miller SD. Microglia initiate central nervous system innate and adaptive immune responses through multiple TLRs. J Immunol. 2004;173:3916–3924. doi: 10.4049/jimmunol.173.6.3916. [DOI] [PubMed] [Google Scholar]
- Olson JK, Zamvil SS, Miller SD. Efficient technique for immortalization of murine microglial cells relevant for studies in murine models of multiple sclerosis. J Neurosci Methods. 2003;128:33–43. doi: 10.1016/s0165-0270(03)00145-6. [DOI] [PubMed] [Google Scholar]
- Rotstein OD, Houston K, Grinstein S. Control of cytoplasmic pH by Na+/H+ exchange in rat peritoneal macrophages activated with phorbol ester. FEBS Lett. 1987;215:223–227. doi: 10.1016/0014-5793(87)80150-3. [DOI] [PubMed] [Google Scholar]
- Scholz W, Albus U, Counillon L, Gögelein H, Lang HJ, Linz W, Weichert A, Schölkens BA. Protective effects of HOE-642, a selective sodium-hydrogen exchange subtype 1 inhibitor, on cardiac ischaemia and reperfusion. Cardiovasc Res. 1995;29:260–268. [PubMed] [Google Scholar]
- Su G, Kintner DB, Sun D. Contribution of Na+-K+-Cl− cotransporter to high-[K+]o induced swelling and EAA release in astrocytes. Am J Physiol Cell Physiol. 2002;282:C1136–C1146. doi: 10.1152/ajpcell.00478.2001. [DOI] [PubMed] [Google Scholar]
- Sugawara T, Noshita N, Lewén A, Gasche Y, Ferrand-Drake M, Fujimura M, Morita-Fujimura Y, Chan PH. Overexpression of copper/zinc superoxide dismutase in transgenic rats protects vulnerable neurons against ischemic damage by blocking the mitochondrial pathway of caspase activation. J Neurosci. 2002;22:209–217. doi: 10.1523/JNEUROSCI.22-01-00209.2002. [DOI] [PMC free article] [PubMed] [Google Scholar]
- Swallow CJ, Grinstein S, Rotstein OD. A vacuolar type H+-ATPase regulates cytoplasmic pH in murine macrophages. J Biol Chem. 1990;265:7645–7654. [PubMed] [Google Scholar]
- Swallow CJ, Grinstein S, Sudsbury RA, Rotstein OD. Relative roles of Na+/H+ exchange and vacuolar-type H+ ATPases in regulating cytoplasmic pH and function in murine peritoneal macrophages. J Cell Physiol. 1993;157:453–460. doi: 10.1002/jcp.1041570304. [DOI] [PubMed] [Google Scholar]
- Tambuyzer BR, Ponsaerts P, Nouwen EJ. Microglia: gatekeepers of central nervous system immunology. J Leukoc Biol. 2009;85:352–370. doi: 10.1189/jlb.0608385. [DOI] [PubMed] [Google Scholar]
- Zhao H, Kalivendi S, Zhang H, Joseph J, Nithipatikom K, Vásquez-Vivar J, Kalyanaraman B. Superoxide reacts with hydroethidine but forms a fluorescent product that is distinctly different from ethidium: potential implications in intracellular fluorescence detection of superoxide. Free Radic Biol Med. 2003;34:1359–1368. doi: 10.1016/s0891-5849(03)00142-4. [DOI] [PubMed] [Google Scholar]