Abstract
Formation of the mitochondrial membrane potential (Δψ) depends on flux of respiratory substrates, ATP, ADP and Pi through voltage-dependent anion channels (VDAC). Since tubulin promotes single channel closure of VDAC, we hypothesized that tubulin is a dynamic regulator of Δψ. Δψ in cultured cancer cells was assessed by confocal microscopy of the potential-indicating fluorophore, tetramethylrhodamine methylester (TMRM). Microtubule destabilizers, rotenone, colchicine and nocodazole, and the microtubule stabilizer, paclitaxel, increased and decreased cellular free tubulin, respectively, and in parallel decreased and increased Δψ. Protein kinase A (PKA) activation by cAMP analogs and glycogen synthase kinase 3β (GSK-3β) inhibition decreased Δψ, whereas PKA inhibition hyperpolarized, consistent with reports that PKA and GSK-3β decrease and increase VDAC conductance, respectively. Plasma membrane potential assessed by DiBAC4(3) was not altered by any of the treatments. We propose that inhibition of VDAC by free tubulin limits mitochondrial metabolism in cancer cells.
Keywords: Colchicine, DiBAC4(3), glycogen synthase kinase-3β, HepG2 cells, microtubules, mitochondrial membrane potential, nocodazole, paclitaxel, protein kinase A, rotenone, TMRM, tubulin, VDAC, Warburg effect
INTRODUCTION
Malignant cancer cells typically display high rates of glycolysis even when fully oxygenated (1;2). In aerobic tissues, glycolysis contributes only 5% of cellular ATP production. In cancer cells, high glycolytic rates and net formation of pyruvate and lactate persist despite adequate oxidation, as confirmed in cancer patients by positron emission tomography of the glucose analog 18fluoro-2-deoxyglucose (3). Enhanced glycolysis in tumor cells accounting for 50 to 70% of ATP formation may be advantageous for rapid growing tumors exceeding their blood and oxygen supply (4). Furthermore, glycolysis although less efficient may still produce ATP faster than oxidative phosphorylation, an advantage to rapidly dividing cells, including strongly glycolytic embryonic and early fetal tissues (5). Additionally, byproducts and intermediates of glycolytic metabolism are precursors for anabolic biosynthesis (6). The Warburg phenomenon appears to be more than an epiphenomenon, since enhancement of oxidative phosphorylation and/or inhibition of glycolysis (e.g., dichloroacetic acid, 3-bromopyruvate) causes tumor cell death both in vitro and in vivo (4).
In mitochondria, transport of respiratory substrates, ATP, ADP, and phosphate across the mitochondrial inner membrane occurs through a variety of specific transporters. By contrast, metabolite exchange across the outer membrane occurs primarily through the voltage-dependent anion channel (VDAC) (7-9). VDAC is a highly conserved ~30 kDa protein that forms channels permeable to molecules up to ~5 kDa for nonelectrolytes in the fully open state (10;11). Each VDAC protein forms a barrel comprised of a transmembrane alpha helix and 13 or more transmembrane beta strands that enclose an aqueous channel of ~3 nm in internal diameter in the open state and 1.8 nm in the closed state (12;13).
VDAC shows both ion selectivity and voltage dependence. In the open state, selectivity favoring anions over cations is weak. Both positive and negative membrane potentials (±50 mV) close VDAC. It remains controversial if membrane potential regulates VDAC conductance in intact cells (14). Nonetheless, VDAC closure effectively blocks movement of most organic anions, including respiratory substrates and creatine phosphate, and prevents exchange of ADP and Pi for ATP during oxidative phosphorylation (15). Recently, VDAC closure was hypothesized to contribute to suppression of mitochondrial metabolism in the Warburg phenomenon (16).
Other factors regulate VDAC gating, including glutamate (17), NADH (18), VDAC modulator (19), G-actin (20), hexokinase (21-23) and Bcl2 family members (24). Protein kinases, including protein kinase A (PKA), glycogen synthase 3β (GSK3β) and protein kinase C epsilon (PKCε) are reported to phosphorylate VDAC (25-27). Purified VDAC1 is a substrate for PKA in vitro, and PKA phosphorylation of VDAC blocks or inhibits association of VDAC with proapoptotic proteins, such as Bax and tBid. Moreover, PKA-dependent VDAC phosphorylation decreases VDAC conductance (28). By contrast, GSK3β-mediated VDAC phosphorylation appears to promote channel opening and potentiate chemotherapy-induced cytotoxicity (25;29). VDAC closure has also been reported to occur after acute treatment of hepatocytes with ethanol (16;30).
Tubulin, the heterodimeric subunit of microtubules, binds to mitochondria specifically at VDAC (31;32). Nanomolar concentrations of dimeric tubulin close VDAC reconstituted into planar phospholipid membranes (33). Tubulin also decreases outer membrane permeability to adenine nucleotides in isolated brain mitochondria and in permeabilized synaptosomes and cardiac myocytes (33;34). These effects of tubulin are enhanced when VDAC is phosphorylated by PKA (35).
Here, we evaluated the role of tubulin in regulating mitochondrial function in intact HepG2 human hepatoma cells. Our results indicate that microtubule depolymerization with colchicine, nocodazole and rotenone leads to partial mitochondrial depolarization, whereas a decrease of free tubulin induced by paclitaxel promotes hyperpolarization. Additionally, the PKA agonists dibutyryl cAMP and 8-CPT-cAMP promote depolarization, whereas PKA inhibition by H89 causes hyperpolarization. By contrast, GSK-3β inhibition with SB216763, SB415286, or 1-azakenpaullone causes depolarization. Microtubule destabilization also causes mitochondrial depolarization in human A549 lung carcinoma and UM-SCC-1 head and neck cancer cells, whereas microtubule stabilization promotes mitochondrial hyperpolarization. In rat hepatocytes, microtubule depolymerization also depolarizes mitochondria, but microtubule stabilization does not hyperpolarize. These results are consistent with the conclusion that free tubulin and protein kinases dynamically regulate mitochondrial function in cancer cells but not in nontransformed primary cells, possibly by altering VDAC conductance.
MATERIALS AND METHODS
Cell culture
HepG2, A549 and UM-SCC-1 cells (ATCC, Manassas, VA) were grown in Eagle's minimum essential medium, F-12K Medium and Dulbecco's modified Eagle's medium (high glucose), respectively, supplemented with 10% fetal bovine serum, 100 units/ml penicillin and 100 μg/ml streptomycin in 5% CO2/air at 37°C. Cancer cells used for experiments were maintained in culture for less than three months. Confocal microscopy of cells cultured on glass bottom culture dishes (MatTek, Ashland, MA) for 48 h was performed in 5% CO2/air at 37°C either in modified Hank's balanced salt solution (HBSS) containing (in mM): NaCl 137, Na2HPO4 0.35, KCl 5.4, KH2PO4 1, MgSO4 0.81, Ca2Cl 0.95, glucose 5.5, NaHCO3 25 and HEPES 20, pH 7.4 or complete growth medium
Hepatocyte isolation and culture
Rat hepatocytes were isolated from overnight fasted male Sprague-Dawley rats (200-250 g) by collagenase digestion, as described previously (36). Cell viability exceeded 90%. Hepatocytes were cultured overnight in plates or glass bottom dishes coated with Type 1 rat tail collagen in Waymouth's MB 752/1 medium containing 27 mM NaHCO3, 2 mM L-glutamine, 10% fetal calf serum, 100 nM insulin, and 10 nM dexamethasone.
Loading of fluorescent probes
TMRM accumulates electrophoretically into mitochondria in response to the negative mitochondrial Δψ (37). Cells in HBSS or complete growth medium were loaded 30 min at 37°C with 200 nM of TMRM. After loading and washing, subsequent incubations were performed with 50 nM TMRM to maintain equilibrium distribution of the fluorophore (38). For simultaneous determination of plasma membrane and mitochondrial Δψ, HepG2 cells were co-loaded with 500 nM of bis-1,3-dibutylbarbituric acid-trimethine oxonol (DiBAC4(3)) and 200 nM TMRM for 30 min and examined without washing.
Laser scanning confocal microscopy
Cells were imaged with a Zeiss LSM 510 inverted laser scanning confocal microscope (Thornwood, NY) with a 63X 1.4 N.A. planapochromat oil immersion lens using 543-nm HeNe laser (0.5-1.5% full power) and 488-nm Ar laser (0.2-0.3% power) excitation, respectively. Emitted red fluorescence of TMRM was detected through a 560-nm long-pass filter and a one Airy unit diameter pinhole, and emitted green fluorescence of DiBAC4(3) was detected through a 500-530-nm barrier filter and 10.6 Airy unit pinhole. Focal planes for each field were selected that showed nuclei as black structures with regular borders without superimposed mitochondria.
Assessment of free and polymerized tubulin
Free and polymerized tubulin was assessed using a Microtubules/Tubulin In Vivo Assay Kit (Cytoskeleton, Denver, CO). Cells were homogenized in cell lysis and microtubule stabilization buffer containing (in mM): MgCl2 5, EGTA 1, GTP 0.1, ATP 1 and PIPES buffer 100; and (in %): glycerol 30, Nonidet-P40 0.1, Triton X-100 0.1, Tween-20 0.1, beta-mercapto-ethanol 0.1, antifoam 0.001, and BME 0.2, pH 7.4 with a protease inhibitor cocktail. Homogenates were centrifuged (100,000 g, 30 min, 37°C) to yield supernatants containing free tubulin and pellets containing microtubules, which were resuspended in cold 200 μM CaCl2.
Free tubulin and microtubule tubulin fractions were loaded on 4-12% Bis-Tris gels. Proteins were transferred using an iBlot Dry Blotting System (Invitrogen, Carlsbad, CA). Blots were blocked in 5% non-fat milk and probed with 1:1000 anti-tubulin monoclonal antibody (Cytoskeleton, Inc) for 1 h at room temperature. Immunoblots were detected by 1:3000 secondary antibodies conjugated to peroxidase (goat anti-mouse IgG.HRP: Sc-2005; Santa Cruz Biotechnology, Inc.) for 1 h at room temperature. Detection was performed using a chemiluminiscence kit (Supersignal Westpico Chemiluminiscent Substrate, Rockford, IL). Protein was quantified by the Bradford method (BIO-RAD, Hercules, CA).
Image analysis
TMRM and DiBAC4(3) fluorescence was quantified using Zeiss LSM (Carl Zeiss, GmBH) and Photoshop CS4 (Adobe Systems, San Jose, CA) software. Briefly, images were taken from cells grown to 70-80% confluency. For each preparation and treatment, a minimum of 4 random fields containing about 5 to 10 cells was selected for quantitative analysis. Images shown in the figures are representative of these fields. All cells from each field were outlined, and the mean intensity of fluorescence was determined by histogram analysis of the red or green channel, as appropriate. Background values were obtained from images collected while focusing within the coverslip and were subtracted from the mean cellular fluorescence of each field. Mean intensity of cellular fluorescence after background subtraction indicated relative cellular uptake of red-fluorescing TMRM or green-fluorescing DiBAC4(3). Control experiments were performed by treating the cells with the same concentration of vehicle used to deliver drugs. Otherwise, the experimental conditions were identical. A minimum of three independent experiments was used to make final calculations.
Statistics
Differences between groups were analyzed by the Student's t-test using p < 0.05 as the criterion of significance. Results were expressed as means ± SEM. Images are representative of three or more experiments.
RESULTS
HepG2 cells maintain mitochondrial Δψ through respiration or ATP hydrolysis
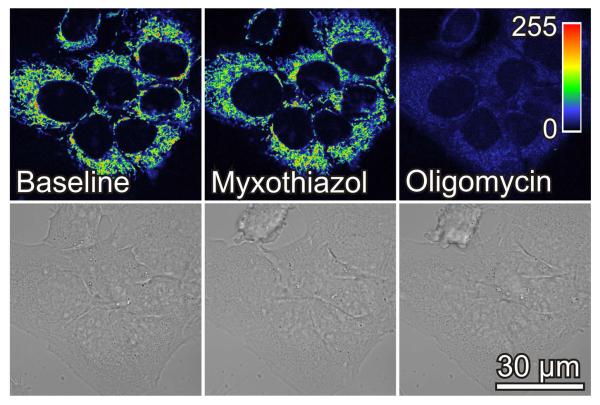
HepG2 cells at ~70% confluency were loaded with TMRM and imaged by confocal microscopy. Red fluorescence revealed round and filamentous mitochondria relatively densely packed throughout the cytoplasm (Fig. 1). Addition of myxothiazol (10 μM), a Complex III respiratory inhibitor, decreased TMRM fluorescence by 8% indicating a small drop of mitochondrial Δψ (Fig. 1). To test the hypothesis that ATP hydrolysis by the mitochondrial F1F0-ATP synthase operating in reverse was maintaining mitochondrial Δψ in the presence of myxothiazol, oligomycin (10 μg/ml), a specific F1-F0 ATP synthase inhibitor, was subsequently added. As expected, oligomycin in the presence of myxothiazol collapsed Δψ nearly completely (Fig. 1). Notably, changes of mitochondrial Δψ after myxothiazol plus oligomycin did not affect cell shape (Fig. 1). When oligomycin was added first, TMRM fluorescence increased by 93% and then was lost nearly completely after subsequent myxothiazol (data not shown). These results indicate that mitochondria of HepG2 cells are metabolically active and catalyzing Δψ formation and ATP synthesis driven by respiration and that ATP hydrolysis after respiratory inhibition can also sustain Δψ.
Fig. 1. Myxothiazol and oligomycin collapse mitochondrial membrane potential in HepG2 cells.
Cells in HBSS were loaded with TMRM, as described in MATERIALS AND METHODS. After collecting baseline images, myxothiazol (10 μM) was added, and another image was collected after 20 min. Oligomycin (10 μg/ml) was then added and additional images were collected after 30 min. In upper panels, image intensity is pseudocolored according to the reference bar. Lower panels are brightfield images.
Rotenone, colchicine and nocodazole decrease mitochondrial Δψ
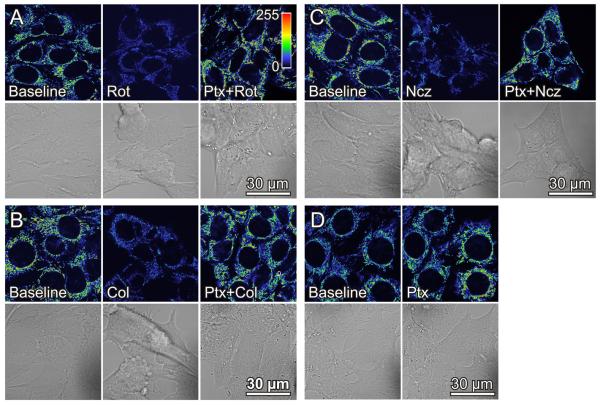
To further investigate the effect of respiratory inhibitors on mitochondrial Δψ, we exposed HepG2 cells to rotenone, an inhibitor of Complex I which like myxothiazol inhibits respiration and oxidative phosphorylation. Unexpectedly, rotenone decreased TMRM fluorescence by about 60% (Fig. 2A). The decrease of Δψ plateaued within 30 min and further changes after up to an hour did not occur (data not shown). In control experiments, mitochondrial Δψ remained unchanged for an hour after vehicle (dimethyl sulfoxide) (data not shown). Rotenone also caused cell rounding with partial and sometimes complete detachment of cells. Cell rounding after rotenone paralleled mitochondrial depolarization and did not occur after myxothiazol or vehicle (Fig. 2A, compare to Fig. 1, and data not shown).
Fig. 2. Rotenone, colchicine and nocodazole depolarize mitochondria in HepG2 cells.
HepG2 cells were loaded with TMRM, as described in Fig. 1. In A, baseline cells (left panel) were exposed to rotenone (Rot, 2 μM) for 30 min (center panel). Another dish of cells was pretreated with paclitaxel (Ptx, 10 μM) for 20 min before addition of rotenone (2 μM) (right panel). In B and C, cells were treated identically as in A, except colchicine (Col, 10 μM) and nocodazole (Ncz, 10 μM), respectively, were substituted for rotenone. In D, cells were treated with paclitaxel for 20 min. Note decrease of TMRM fluorescence and cell rounding after rotenone, colchicine and nocodazole. Paclitaxel causes TMRM fluorescence to increase and prevents the decrease of TMRM fluorescence and cell rounding after rotenone, colchicine and nocodazole.
Because previous studies show that rotenone depolymerizes microtubules and increases free tubulin in cells (39,40), we examined the effects of two structurally unrelated microtubule destabilizers, colchicine and nocodazole, on TMRM fluorescence and cell morphology. Colchicine (10 μM) decreased mitochondrial TMRM fluorescence by 60% and promoted cell rounding and detachment similar to rotenone (Fig. 2B). Nocodazole (10 μM) caused virtually identical changes (Fig. 2C). Thus, each of the structurally distinct microtubule destabilizers studied caused mitochondrial Δψ to decrease.
Microtubule stabilization by paclitaxel hyperpolarizes mitochondria and prevents the decrease of mitochondrial Δψ produced by rotenone, colchicine and nocodazole
To assess whether changes of Δψ were specifically dependent on free tubulin inside cells, we treated HepG2 cells with the microtubule stabilizer, paclitaxel (41). After paclitaxel (10 μM), TMRM fluorescence increased 60% within 30 min, and cell morphology was preserved (Fig. 2D). Moreover, paclitaxel prevented loss of mitochondrial TMRM fluorescence when cells were subsequently treated with rotenone, colchicine or nocodazole (Fig. 2A-C).
Mitochondrial depolarization/hyperpolarization follows the ratio of free to polymerized tubulin
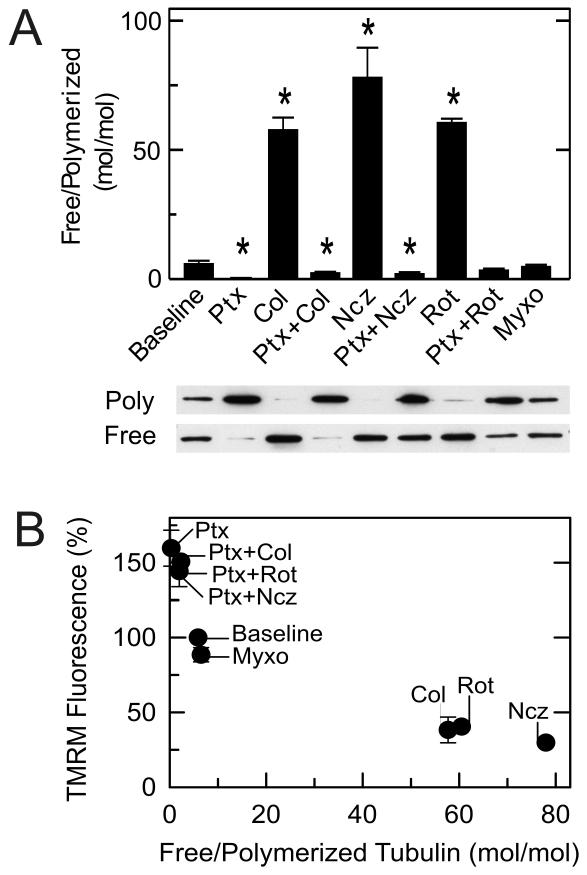
Changes of tubulin polymerization in HepG2 cells in response to various treatments were determined by Western blots. In untreated cells, the free to polymerized tubulin ratio was ~5 (Fig. 3A). After treatment with rotenone, colchicine and nocodazole, free to polymerized tubulin ratios increased to 60, 78 and 58, respectively. By contrast after paclitaxel, the ratio decreased to 0.3. Moreover, pretreatment with paclitaxel prevented microtubule depolymerization by rotenone, colchicine and nocodazole. Myxothiazol unlike rotenone caused almost no change of the free to polymerized tubulin ratio (Fig. 3A). These results compared to the results of Fig. 2A-D show a strong inverse correlation between the free to polymerized tubulin ratios and mitochondrial Δψ measured by TMRM fluorescence (Fig. 3B).
Fig. 3. Microtubule destabilization increases and microtubule stabilization decreases free tubulin.
Free tubulin and polymerized tubulin were isolated from HepG2 cells as described in MATERIALS AND METHODS. As indicated, HepG2 cells were treated with colchicine (10 μM), nocodazole (10 μM), and rotenone (2 μM) alone for 30 min or after pretreatment with paclitaxel (10 μM) for 20 min or with myxothiazol (2 μM) for 20 min. Free tubulin and polymerized tubulin were then assayed, as described in MATERIALS AND METHODS In A, immunoblots of polymerized (poly) and free tubulin are shown together with calculated free to polymerized tubulin ratios for each treatment. In B, free/polymerized tubulin ratios are plotted versus average TMRM fluorescence from experiments described in Fig. 2. Baseline corresponds to untreated cells. * p < 0.05.
Microtubule-depolymerizing agents do not change plasma membrane potential
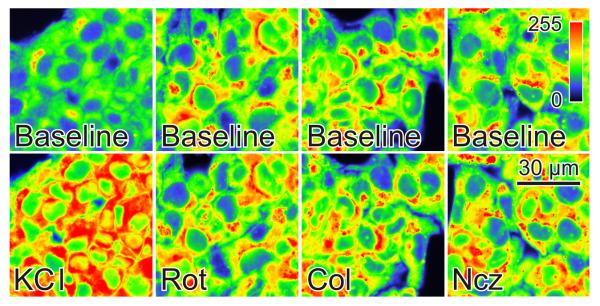
TMRM uptake into mitochondria is driven by both mitochondrial and plasma membrane Δψ. To exclude that plasma membrane depolarization was causing mitochondrial TMRM release after microtubule-depolymerizing agents, we measured plasma membrane Δψ with DiBAC4(3). DiBAC4(3) is an anionic fluorophore that intercalates into membranes enhancing fluorescence. Highly negative plasma membrane Δψ excludes DiBAC4(3) from cells, and fluorescence is low. By contrast plasma membrane depolarization promotes DiBAC4(3) uptake increasing fluorescence as evidenced by depolarization induced by high K+ (Fig. 4). DiBAC4(3) fluorescence remained unchanged after exposure of HepG2 cells to colchicine, nocodazole, and rotenone (Fig. 4). Thus, decreased plasma membrane potential cannot account for loss of TMRM fluorescence after exposure of HepG2 cells to microtubule-depolymerizing agents.
Fig. 4. Microtubule destabilizers do not modify plasma membrane potential.
Fluorescence of DiBAC4(3)-loaded HepG2 cells was measured as described in MATERIALS AND METHODS. As indicated, KCl (100 mM), rotenone (Rot, 2 μM), colchicine (Col, 10 μM) and nocodazole (Ncz, 10 μM), and images were collected after 30 min.
cAMP-dependent PKA activation decreases mitochondrial Δψ, whereas PKA inhibition increases Δψ
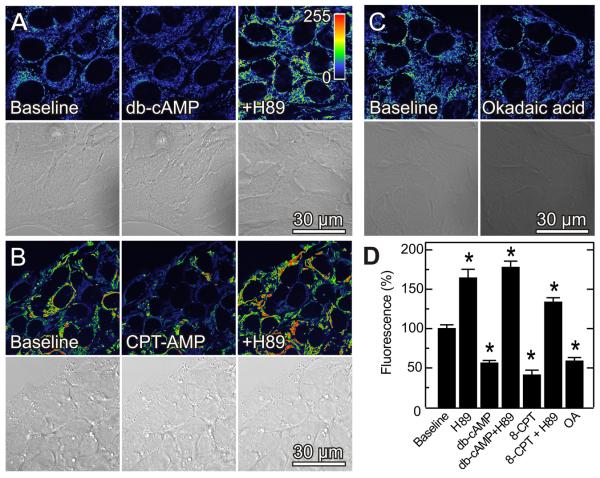
PKA phosphorylates VDAC, and conductance of VDAC phosphorylated by PKA is more sensitive to inhibition by tubulin (28;35). Accordingly, we assessed the effect on TMRM fluorescence of the PKA agonists, dibutyryl cAMP (1 mM) and 8-pCPT-cAMP (50 μM). Dibutyryl cAMP and 8-pCPT-cAMP decreased TMRM fluorescence by 45% and 41%, respectively, within 20 min without causing cell rounding or detachment (Fig. 5A, B and D). Okadaic acid, a phosphatase inhibitor that indirectly promotes protein phosphorylation, also decreased TMRM fluorescence by 50% (Fig. 5C and D). By contrast, H89 (1 μM) at a concentration that selectively blocks PKA (42;43) increased mitochondrial TMRM fluorescence by 71% (Fig. 5D). H89-treated cells remained hyperpolarized even after subsequent addition of cAMP analogs, showing that H89 blocked the cAMP-dependent effect (Fig. 5A, B and D). In addition to blocking depolarization by dibutyryl cAMP and 8-pCPT-cAMP, H89 also reversed mitochondrial depolarization when added after the cAMP analogs (data not shown). Inhibition and activation of PKA did not alter plasma membrane Δψ, since DiBAC4(3) fluorescence remained unchanged after exposure of cells to dibutyryl cAMP (1 mM), 8-pCPT-cAMP and H89 (Fig. S1). DiBAC4(3) fluorescence also remained unchanged after GSK-3β inhibition (see below) (Fig. S1).
Fig. 5. PKA activation and phosphatase inhibition decrease mitochondrial Δψ, whereas PKA inhibition increases mitochondrial Δψ.
TMRM-loaded HepG2 cells were imaged, as described in Fig. 1. As indicated in A, cells were imaged before (left panel) and 20 min after treatment with dibutyryl cAMP (db-cAMP, center panel) or after 20 min treatment with H89 (1 μM) followed by 20 min treatment with dibutyryl cAMP (right panel). In B, cells were treated identically as A with 30 min treatment with 8-CPT-cAMP (50 μM) substituting for dibutyryl cAMP. In C, cells were imaged before and 30 min after treatment with okadaic acid (100 nM). Panel D shows changes of fluorescence after various treatments in relation to untreated cells (Baseline). * p < 0.05.
Glycogen synthase kinase-3β inhibition decreases mitochondrial Δψ
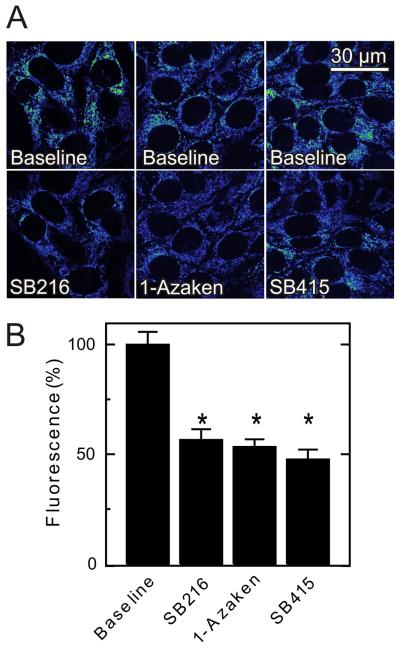
In contrast to PKA, GSK-3β is reported to promote VDAC opening (25). Accordingly, we evaluated the effect of the GSK-3β inhibitors, SB216763 (400 nM), 1-azakenpaullone (1 μM) and SB415286 (1 μM), on mitochondrial TMRM fluorescence in HepG2 cells (Fig. 6A). Each inhibitor caused a 45 to 55% decrease of TMRM fluorescence (Fig. 6B). These results are consistent with the conclusion that GSK-3β regulates mitochondrial Δψ oppositely to PKA.
Fig. 6. Glycogen synthase kinase-3β inhibitors decrease mitochondrial Δψ.
TMRM-loaded HepG2 cells were imaged, as described in Fig. 1. As indicated in A, SB216763 (SB216, 400 nM), 1-azakenpaullone (1-Azaken, 1 μM) and SB415286 (SB415, 1 μM) were added, and images were collected after 30 min. Average TMRM fluorescence after the various treatments is shown in B.
In complete growth medium, depolarization after nocodazole and dibutyryl-cAMP is diminished, whereas paclitaxel and PKA inhibition still induce hyperpolarization
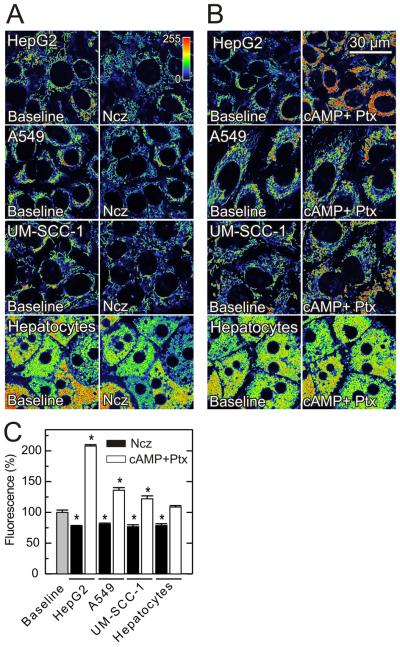
To assess the possibility that effects of free tubulin on mitochondrial Δψ are a consequence of cell incubation in serum-, amino acid- and growth factor-free HBSS, we evaluated the effect of microtubule destabilization/stabilization in HepG2 cells incubated in complete growth medium (Eagle's minimum essential medium with 10% fetal bovine serum). In complete growth medium, nocodazole decreased TMRM fluorescence (23%), although to a somewhat lesser extent than in HBSS (Fig. 7A and C). However, dibutyryl-cAMP had little effect on TMRM fluorescence (data not shown). By contrast, paclitaxel increased TMRM fluorescence by 108% over baseline even in the presence of dibutyryl-cAMP (Fig. 7B and C). Similarly, PKA inhibition by H89 increased TMRM fluorescence by 61% (Fig. S2). In control experiments, vehicle (dimethyl sulfoxide) did not change mitochondrial Δψ (Fig. S3). These findings indicate that free tubulin-dependent inhibition of mitochondrial Δψ formation in HepG2 cells occurs in both HBSS and complete growth medium.
Fig. 7. Effects of nocodazole, paclitaxel and dibutyryl-cAMP on mitochondrial Δψ in HepG2, A549, UM-SCC-1 cells and rat hepatocytes in complete growth medium.
TMRM-loaded cells were imaged as described in Fig. 1. In A, cells were imaged before and 30 min (HepG2, A549 and UM-SCC-1 cells) or 60 min (rat hepatocytes) after nocodazole (Ncz, 10 μM), as indicated. In B, images were collected as indicated, and cells were sequentially treated for 20 min with dibutyryl cAMP (1 mM) and 30 min with paclitaxel (30 μM). Average TMRM fluorescence after nocodazole and dibutyryl cAMP plus paclitaxel is shown in C.* p < 0.05.
Nocodazole and paclitaxel depolarize and hyperpolarize mitochondria in other cancer cell lines
After confirming that free tubulin dynamically modulates Δψ in HepG2 cells, we extended our study to A549 and UM-SCC-1 cancer cell lines incubated in their respective growth media. In the two cell lines, nocodazole decreased TMRM fluorescence by 19% and 23%, respectively (Fig. 7A and C), but dibutyryl-cAMP had virtually no effect (data not shown). By contrast, paclitaxel after db-cAMP pretreatment increased TMRM fluorescence by 36% and 22% respectively (Fig. 7B and C). Immunoblots confirmed the expected effects of nocodazole and paclitaxel on tubulin polymerization (Fig. S4).
Paclitaxel does not hyperpolarize mitochondria of primary hepatocytes
To determine whether free tubulin modulates mitochondrial Δψ in nontransformed cells, we repeated our studies in primary rat hepatocytes incubated in culture medium. Similar to cancer cell lines in growth medium, nocodazole decreased TMRM fluorescence of primary hepatocytes by 22%, and dibutyryl cAMP had little effect. However, in contrast to cancer cells, paclitaxel and H89 did not cause mitochondrial hyperpolarization in hepatocytes (Fig. 7A-C). The lack of response to paclitaxel may reflect higher polymerized tubulin and lower free tubulin in hepatocytes compared to the cancer cell lines studied (Fig. S4, see also Fig. 3). Thus, although tubulin depolymerization impaired mitochondrial Δψ formation in primary hepatocytes, increased tubulin polymerization with paclitaxel and PKA inhibition did not increase Δψ. These findings were consistent with the conclusion that free tubulin is not dynamically controlling mitochondrial Δψ in primary rat hepatocytes.
DISCUSSION
Cancer cells generate the bulk of their ATP by glycolysis even in the presence of oxygen, although mitochondria isolated from tumor cells are functional (44). In confirmation, our work showed that polarized mitochondria of HepG2, A549 and UM-SCC-1 cells took up the potential-indicating fluorophore, TMRM. Moreover, respiration and ATP hydrolysis were each individually sufficient to maintain mitochondrial polarization, since the combination of myxothiazol and oligomycin but neither agent alone, was required to depolarize mitochondria and release TMRM fluorescence from HepG2 cells consistent with expectations of chemiosmotic theory (Fig. 1).
Although myxothiazol alone did not depolarize HepG2 mitochondria, rotenone, another respiratory inhibitor, did depolarize and caused cell rounding (Fig. 2A). Rotenone, unlike myxothiazol, inhibits microtubule polymerization in addition to causing respiratory inhibition (39,40). To determine whether rotenone-induced mitochondrial depolarization was related to microtubule depolymerization, we destabilized microtubules with colchicine and nocodazole in HepG2 cells. Both colchicine and nocodazole caused cellular rounding and TMRM release to virtually the same extent as rotenone (Fig. 2B-C). By contrast, the microtubule-stabilizing agent, paclitaxel, increased TMRM uptake and prevented loss of TMRM fluorescence after rotenone, colchicine and nocodazole (Fig. 2A-C). Measurement of free and polymerized tubulin confirmed a very strong inverse relationship between free to polymerized tubulin ratios and mitochondrial Δψ (Fig. 3B).
Plasma membrane Δψ also drives TMRM uptake into cells increasing TMRM uptake into mitochondria. To determine whether fluctuations of plasma membrane Δψ changed TMRM fluorescence after microtubule destabilization/stabilization, we examined cells loaded with DiBAC4(3), a plasma membrane potential indicator. Neither rotenone, colchicine, nocodazole nor paclitaxel altered DiBAC4(3) fluorescence, although DiBAC4(3) fluorescence increased as expected after plasma membrane depolarization by high K+ (Fig. 4). Thus, microtubule destabilization/stabilization was not changing plasma membrane Δψ but was specifically altering mitochondrial Δψ.
Microtubules are involved in diverse cellular functions, including motility, maintenance of cell shape, cell division and organelle distribution (45). Microtubules form by side-to-side self-association of tubulin, a heterodimer of α-tubulin and β -tubulin (46). Specific interactions of microtubules with mitochondria mediate intracellular movement of mitochondria as, for example, during axoplasmic transport (31;32). Recent studies show that tubulin reversibly inhibits VDAC reconstituted into planar phospholipid membranes and decreases respiration in isolated mitochondria. This inhibition appears mediated by insertion of a negatively charged extended C-terminal tail of tubulin into the VDAC channel (33). Our findings showing that free tubulin regulates mitochondrial Δψ are consistent with the conclusion that free tubulin is also inhibiting VDAC in situ and regulating the supply of respiratory substrates and/or ATP required for mitochondrial polarization. Our data also suggest that tubulin is dynamically regulating VDAC in cancer cells, since an increase of free tubulin caused depolarization whereas a decrease caused hyperpolarization.
Previous studies indicate that PKA-mediated phosphorylation leads to VDAC closure, whereas GSK-3β activity promotes VDAC opening (25,28). Thus to further assess whether changes of VDAC activity were modulating mitochondrial polarization, we determined the effect of various kinase agonists and antagonists on mitochondrial TMRM uptake. Consistent with a role of VDAC in regulating mitochondrial Δψ in situ, PKA activation with two different cell permeant cAMP analogs decreased TMRM fluorescence in HepG2 cells incubated in HBSS, whereas H89, a highly specific PKA inhibitor, blocked and reversed the effect of the cAMP analogs hyperpolarizing mitochondria (Fig. 5 A-C). By contrast, three different inhibitors of GSK3β caused depolarization (Fig. 6 A-B). These results also support the conclusion that VDAC is regulating mitochondrial Δψ in cancer cells.
Our initial experiments were performed in HepG2 cells incubated in HBSS, a simple glucose-supplemented electrolyte solution. In complete growth medium, microtubule destabilization by nocodazole and microtubule stabilization with paclitaxel also depolarized and hyperpolarized mitochondria. However in contrast to incubation in HBSS, the response to nocodazole in growth medium was weaker and the response to paclitaxel enhanced (Fig. 3B and 7A-C). Moreover, cAMP did not depolarize mitochondria of HepG2 cells in complete growth medium (data not shown), whereas PKA inhibition with H89 induced similar hyperpolarization (Fig. 5D and S2). Similar changes occurred in A549 and UM-SCC-1 cancer cells in their respective growth media. The decreased response to cAMP in culture medium suggests that PKA may be in a higher activation state in culture medium than in HBSS. Nonetheless, other factors may regulate mitochondrial sensitivity to free tubulin in cancer cells incubated in complete medium. Overall, the results are consistent with the conclusion that mitochondrial suppression by free tubulin is greater in growth medium than HBSS.
In contrast to all cancer cell lines studied, free tubulin did not inhibit mitochondrial Δψ formation in primary rat hepatocytes. Although nocodazole depolarized mitochondria, paclitaxel did not hyperpolarize (Fig. 7A-C). Similarly, PKA inhibition with H89 did not hyperpolarize mitochondria in primary rat hepatocytes in marked contrast to the hyperpolarization that occurred in HepG2 cells (Fig. S2). Thus, suppression of mitochondrial function by free tubulin may be a unique characteristic of cancer cell metabolism. Lack of hyperpolarization after paclitaxel may be related to higher tubulin polymerization in hepatocytes compared to cancer cell lines (Fig. S4).
The present findings suggest that gating of VDAC by tubulin, PKA and GSK3β dynamically and globally regulates mitochondrial metabolism in cancer cells and that VDAC has a ‘governator’ function limiting mitochondrial metabolism in aerobic glycolysis (16). Similarly, VDAC gating to a more closed state may promote selective acetaldehyde oxidation in the livers of ethanol-treated livers and slow mitochondrial ATP hydrolysis and free radical release during hypoxia/reoxygenation and oxidative stress (16;47-49). In aerobic glycolysis (Warburg phenomenon), tumor cells prefer glycolysis over mitochondrial oxidative phosphorylation. Increased expression of glucose transporters and glycolytic enzymes help explain the enhancement of glycolysis, but the suppression of oxidative phosphorylation in cancer cells remains poorly understood. The present findings suggest that elevated levels of free tubulin in cancer cells augmented by PKA agonism are promoting VDAC closure thereby limiting mitochondrial exchange of respiratory substrates, ATP, ADP and phosphate. Thus, VDAC closure may account, at least in part, for suppression of mitochondrial metabolism of the Warburg phenomenon. By contrast in nontransformed rat hepatocytes, VDAC appears not to be rate-limiting for mitochondrial metabolism. An implication of this conclusion is that inhibitors of tubulin- and PKA-mediated VDAC closure might restore normal aerobic metabolism in cancer cells and suppress cancer cell proliferation. Future studies will be needed to determine how free tubulin affects other aspects of mitochondrial function and cellular metabolism, what VDAC isoforms underlie these effects, whether tubulin regulation occurs in vivo and the feasibility of using VDAC as a therapeutic target.
Supplementary Material
ACKNOWLEDGMENTS
This work was supported, in part, by Grants 2-R01 DK37034, 1 R01 DK073336 and 1 R01 DK070195 from the National Institutes of Health. Imaging facilities were supported, in part, by NIH Center Grant 1P30 CA138313. We thank Dr. Martin Brand for pointing out that rotenone is a microtubule-depolymerizing agent.
REFERENCES
- 1.Warburg O. Ueber den stoffwechsel der tumoren. Constable; London: 1930. [Google Scholar]
- 2.Gatenby RA, Gillies RJ. Why do cancers have high aerobic glycolysis? Nat Rev Cancer. 2004;4(11):891–9. doi: 10.1038/nrc1478. [DOI] [PubMed] [Google Scholar]
- 3.Gambhir SS. Molecular imaging of cancer with positron emission tomography. Nat Rev Cancer. 2002;2(9):683–93. doi: 10.1038/nrc882. [DOI] [PubMed] [Google Scholar]
- 4.Mathupala SP, Ko YH, Pedersen PL. Hexokinase-2 bound to mitochondria: cancer's stygian link to the “Warburg Effect” and a pivotal target for effective therapy. Semin Cancer Biol. 2009;19(1):17–24. doi: 10.1016/j.semcancer.2008.11.006. [DOI] [PMC free article] [PubMed] [Google Scholar]
- 5.Harvey AJ, Kind KL, Thompson JG. REDOX regulation of early embryo development. Reproduction. 2002;123(4):479–86. doi: 10.1530/rep.0.1230479. [DOI] [PubMed] [Google Scholar]
- 6.Vander Heiden MG, Cantley LC, Thompson CB. Understanding the Warburg effect: the metabolic requirements of cell proliferation. Science. 2009;324(5930):1029–33. doi: 10.1126/science.1160809. [DOI] [PMC free article] [PubMed] [Google Scholar]
- 7.Gellerich FN, Wagner M, Kapischke M, Wicker U, Brdiczka D. Effect of macromolecules on the regulation of the mitochondrial outer membrane pore and the activity of adenylate kinase in the inter-membrane space. Biochim Biophys Acta. 1993;1142(3):217–27. doi: 10.1016/0005-2728(93)90150-e. [DOI] [PubMed] [Google Scholar]
- 8.Hodge T, Colombini M. Regulation of metabolite flux through voltage-gating of VDAC channels. J Membr Biol. 1997;157(3):271–9. doi: 10.1007/s002329900235. [DOI] [PubMed] [Google Scholar]
- 9.Rostovtseva T, Colombini M. VDAC channels mediate and gate the flow of ATP: implications for the regulation of mitochondrial function. Biophys J. 1997;72(5):1954–62. doi: 10.1016/S0006-3495(97)78841-6. [DOI] [PMC free article] [PubMed] [Google Scholar]
- 10.Colombini M. Structure and mode of action of a voltage dependent anion-selective channel (VDAC) located in the outer mitochondrial membrane. Ann N Y Acad Sci. 1980;341:552–63. doi: 10.1111/j.1749-6632.1980.tb47198.x. [DOI] [PubMed] [Google Scholar]
- 11.Song J, Colombini M. Indications of a common folding pattern for VDAC channels from all sources. J Bioenerg Biomembr. 1996;28(2):153–61. doi: 10.1007/BF02110646. [DOI] [PubMed] [Google Scholar]
- 12.Mannella CA, Forte M, Colombini M. Toward the molecular structure of the mitochondrial channel, VDAC. J Bioenerg Biomembr. 1992;24(1):7–19. doi: 10.1007/BF00769525. [DOI] [PubMed] [Google Scholar]
- 13.Colombini M. Regulation of the mitochondrial outer membrane channel, VDAC. J Bioenerg Biomembr. 1987;19(4):309–20. doi: 10.1007/BF00768534. [DOI] [PubMed] [Google Scholar]
- 14.Tan W, Colombini M. VDAC closure increases calcium ion flux. Biochim Biophys Acta. 2007;1768(10):2510–5. doi: 10.1016/j.bbamem.2007.06.002. [DOI] [PMC free article] [PubMed] [Google Scholar]
- 15.Rostovtseva TK, Komarov A, Bezrukov SM, Colombini M. VDAC channels differentiate between natural metabolites and synthetic molecules. J Membr Biol. 2002;187(2):147–56. doi: 10.1007/s00232-001-0159-1. [DOI] [PubMed] [Google Scholar]
- 16.Lemasters JJ, Holmuhamedov E. Voltage-dependent anion channel (VDAC) as mitochondrial governator--thinking outside the box. Biochim Biophys Acta. 2006;1762(2):181–90. doi: 10.1016/j.bbadis.2005.10.006. [DOI] [PubMed] [Google Scholar]
- 17.Gincel D, Silberberg SD, Shoshan-Barmatz V. Modulation of the voltage-dependent anion channel (VDAC) by glutamate. J Bioenerg Biomembr. 2000;32(6):571–83. doi: 10.1023/a:1005670527340. [DOI] [PubMed] [Google Scholar]
- 18.Zizi M, Forte M, Blachly-Dyson E, Colombini M. NADH regulates the gating of VDAC, the mitochondrial outer membrane channel. J Biol Chem. 1994;269(3):1614–6. [PubMed] [Google Scholar]
- 19.Liu MY, Torgrimson A, Colombini M. Characterization and partial purification of the VDAC-channel-modulating protein from calf liver mitochondria. Biochim Biophys Acta. 1994;1185(2):203–12. doi: 10.1016/0005-2728(94)90211-9. [DOI] [PubMed] [Google Scholar]
- 20.Xu X, Forbes JG, Colombini M. Actin modulates the gating of Neurospora crassa VDAC. J Membr Biol. 2001;180(1):73–81. doi: 10.1007/s002320010060. [DOI] [PubMed] [Google Scholar]
- 21.Al Jamal JA. Involvement of porin N,N-dicyclohexylcarbodiimide-reactive domain in hexokinase binding to the outer mitochondrial membrane. Protein J. 2005;24(1):1–8. doi: 10.1007/s10930-004-0600-2. [DOI] [PubMed] [Google Scholar]
- 22.Nakashima RA, Paggi MG, Scott LJ, Pedersen PL. Purification and characterization of a bindable form of mitochondrial bound hexokinase from the highly glycolytic AS-30D rat hepatoma cell line. Cancer Res. 1988;48(4):913–9. [PubMed] [Google Scholar]
- 23.Azoulay-Zohar H, Israelson A, Abu-Hamad S, Shoshan-Barmatz V. In self-defence: hexokinase promotes voltage-dependent anion channel closure and prevents mitochondria-mediated apoptotic cell death. Biochem J. 2004;377(Pt 2):347–55. doi: 10.1042/BJ20031465. [DOI] [PMC free article] [PubMed] [Google Scholar]
- 24.Tsujimoto Y, Shimizu S. VDAC regulation by the Bcl-2 family of proteins. Cell Death Differ. 2000;7(12):1174–81. doi: 10.1038/sj.cdd.4400780. [DOI] [PubMed] [Google Scholar]
- 25.Das S, Wong R, Rajapakse N, Murphy E, Steenbergen C. Glycogen synthase kinase 3 inhibition slows mitochondrial adenine nucleotide transport and regulates voltage-dependent anion channel phosphorylation. Circ Res. 2008;103(9):983–91. doi: 10.1161/CIRCRESAHA.108.178970. [DOI] [PMC free article] [PubMed] [Google Scholar]
- 26.Rostovtseva TK, Antonsson B, Suzuki M, Youle RJ, Colombini M, Bezrukov SM. Bid, but not Bax, regulates VDAC channels. J Biol Chem. 2004;279(14):13575–83. doi: 10.1074/jbc.M310593200. [DOI] [PubMed] [Google Scholar]
- 27.Baines CP, Song CX, Zheng YT, Wang GW, Zhang J, Wang OL, et al. Protein kinase Cepsilon interacts with and inhibits the permeability transition pore in cardiac mitochondria. Circ Res. 2003;92(8):873–80. doi: 10.1161/01.RES.0000069215.36389.8D. [DOI] [PMC free article] [PubMed] [Google Scholar]
- 28.Bera AK, Ghosh S, Das S. Mitochondrial VDAC can be phosphorylated by cyclic AMP-dependent protein kinase. Biochem Biophys Res Commun. 1995;209(1):213–7. doi: 10.1006/bbrc.1995.1491. [DOI] [PubMed] [Google Scholar]
- 29.Pastorino JG, Hoek JB, Shulga N. Activation of glycogen synthase kinase 3beta disrupts the binding of hexokinase II to mitochondria by phosphorylating voltage-dependent anion channel and potentiates chemotherapy-induced cytotoxicity. Cancer Res. 2005;65(22):10545–54. doi: 10.1158/0008-5472.CAN-05-1925. [DOI] [PubMed] [Google Scholar]
- 30.Holmuhamedov E, Lemasters JJ. Ethanol exposure decreases mitochondrial outer membrane permeability in cultured rat hepatocytes. Arch Biochem Biophys. 2009;481(2):226–33. doi: 10.1016/j.abb.2008.10.036. [DOI] [PMC free article] [PubMed] [Google Scholar]
- 31.Bernier-Valentin F, Rousset B. Interaction of tubulin with rat liver mitochondria. J Biol Chem. 1982;257(12):7092–9. [PubMed] [Google Scholar]
- 32.Carre M, Andre N, Carles G, Borghi H, Brichese L, Briand C, et al. Tubulin is an inherent component of mitochondrial membranes that interacts with the voltage-dependent anion channel. J Biol Chem. 2002;277(37):33664–9. doi: 10.1074/jbc.M203834200. [DOI] [PubMed] [Google Scholar]
- 33.Rostovtseva TK, Sheldon KL, Hassanzadeh E, Monge C, Saks V, Bezrukov SM, et al. Tubulin binding blocks mitochondrial voltage-dependent anion channel and regulates respiration. Proc Natl Acad Sci U S A. 2008;105(48):18746–51. doi: 10.1073/pnas.0806303105. [DOI] [PMC free article] [PubMed] [Google Scholar]
- 34.Timohhina N, Guzun R, Tepp K, Monge C, Varikmaa M, Vija H, et al. Direct measurement of energy fluxes from mitochondria into cytoplasm in permeabilized cardiac cells in situ: some evidence for Mitochondrial Interactosome. J Bioenerg Biomembr. 2009;41(3):259–75. doi: 10.1007/s10863-009-9224-8. [DOI] [PubMed] [Google Scholar]
- 35.Rostovtseva TK. VDAC regulation by cytosolic proteins. Biophys J. 2009;96(Suppl.):7a. [Google Scholar]
- 36.Nieminen AL, Byrne AM, Herman B, Lemasters JJ. Mitochondrial permeability transition in hepatocytes induced by t-BuOOH: NAD(P)H and reactive oxygen species. Am J Physiol. 1997;272(4 Pt 1):C1286–C1294. doi: 10.1152/ajpcell.1997.272.4.C1286. [DOI] [PubMed] [Google Scholar]
- 37.Ehrenberg B, Montana V, Wei MD, Wuskell JP, Loew LM. Membrane potential can be determined in individual cells from the nernstian distribution of cationic dyes. Biophys J. 1988;53(5):785–94. doi: 10.1016/S0006-3495(88)83158-8. [DOI] [PMC free article] [PubMed] [Google Scholar]
- 38.Lemasters JJ, Ramshesh VK. Imaging of mitochondrial polarization and depolarization with cationic fluorophores. Methods Cell Biol. 2007;80:283–95. doi: 10.1016/S0091-679X(06)80014-2. 283-95. [DOI] [PubMed] [Google Scholar]
- 39.Brinkley BR, Barham SS, Barranco SC, Fuller GM. Rotenone inhibition of spindle microtubule assembly in mammalian cells. Exp Cell Res. 1974;85(1):41–6. doi: 10.1016/0014-4827(74)90210-9. [DOI] [PubMed] [Google Scholar]
- 40.Marshall LE, Himes RH. Rotenone inhibition of tubulin self-assembly. Biochim Biophys Acta. 1978;543(4):590–4. doi: 10.1016/0304-4165(78)90315-x. [DOI] [PubMed] [Google Scholar]
- 41.Horwitz SB. Mechanism of action of taxol. Trends Pharmacol Sci. 1992;13(4):134–6. doi: 10.1016/0165-6147(92)90048-b. [DOI] [PubMed] [Google Scholar]
- 42.Acin-Perez R, Salazar E, Kamenetsky M, Buck J, Levin LR, Manfredi G. Cyclic AMP produced inside mitochondria regulates oxidative phosphorylation. Cell Metab. 2009;9(3):265–76. doi: 10.1016/j.cmet.2009.01.012. [DOI] [PMC free article] [PubMed] [Google Scholar]
- 43.Davies SP, Reddy H, Caivano M, Cohen P. Specificity and mechanism of action of some commonly used protein kinase inhibitors. Biochem J. 2000;351(Pt 1):95–105. doi: 10.1042/0264-6021:3510095. [DOI] [PMC free article] [PubMed] [Google Scholar]
- 44.Pedersen PL. Warburg, me and Hexokinase 2: Multiple discoveries of key molecular events underlying one of cancers' most common phenotypes, the “Warburg Effect”, i.e., elevated glycolysis in the presence of oxygen. J Bioenerg Biomembr. 2007;39(3):211–22. doi: 10.1007/s10863-007-9094-x. [DOI] [PubMed] [Google Scholar]
- 45.Desai A, Mitchison TJ. Microtubule polymerization dynamics. Annu Rev Cell Dev Biol. 1997;13:83–117. doi: 10.1146/annurev.cellbio.13.1.83. [DOI] [PubMed] [Google Scholar]
- 46.Nogales E. Structural insights into microtubule function. Annu Rev Biochem. 2000;69:277–302. doi: 10.1146/annurev.biochem.69.1.277. [DOI] [PubMed] [Google Scholar]
- 47.Holmuhamedov E, Lemasters JJ. Ethanol exposure decreases mitochondrial outer membrane permeability in cultured rat hepatocytes. Arch Biochem Biophys. 2009;481(2):226–33. doi: 10.1016/j.abb.2008.10.036. [DOI] [PMC free article] [PubMed] [Google Scholar]
- 48.Steenbergen C, Das S, Su J, Wong R, Murphy E. Cardioprotection and altered mitochondrial adenine nucleotide transport. Basic Res Cardiol. 2009;104(2):149–56. doi: 10.1007/s00395-009-0002-x. [DOI] [PMC free article] [PubMed] [Google Scholar]
- 49.Tikunov A, Johnson CB, Pediaditakis P, Markevich N, Macdonald JM, Lemasters JJ, et al. Closure of VDAC causes oxidative stress and accelerates the Ca2+-induced mitochondrial permeability transition in rat liver mitochondria. Arch Biochem Biophys. 2010 doi: 10.1016/j.abb.2010.01.008. [DOI] [PMC free article] [PubMed] [Google Scholar]
Associated Data
This section collects any data citations, data availability statements, or supplementary materials included in this article.


