

Abstract
Objectives
Recent research suggests that older listeners may have difficulty processing information related to the fundamental frequency (F0) of voiced speech. In this study, the focus was on the mechanisms that may underlie this reduced ability. We examined whether increased age resulted in decreased ability to perceive F0 using fine structure cues provided by the harmonic structure of voiced speech sounds and/or cues provided by high-rate envelope fluctuations (periodicity).
Design
Younger listeners with normal hearing and older listeners with normal to near-normal hearing completed two tasks of F0 perception. In the first task (steady-state F0), the fundamental frequency difference limen (F0DL) was measured adaptively for synthetic vowel stimuli. In the second task (time-varying F0), listeners relied on variations in F0 to judge intonation of synthetic diphthongs. For both tasks, three processing conditions were created: 8-channel vocoding which preserved periodicity cues to F0; a simulated electroacoustic stimulation condition, which consisted of high-frequency vocoder processing combined with a low-pass filtered portion, and offered both periodicity and fine-structure cues to F0; and an unprocessed condition.
Results
F0 difference limens for steady-state vowel sounds and the ability to discern rising and falling intonations were significantly worse in the older subjects compared to the younger subjects. For both older and younger listeners scores were lowest for the vocoded condition, and there was no difference in scores between the unprocessed and electroacoustic simulation conditions.
Conclusions
Older listeners had difficulty using periodicity cues to obtain information related to talker fundamental frequency. However, performance was improved by combining periodicity cues with (low-frequency) acoustic information, and that strategy should be considered in individuals who are appropriate candidates for such processing. For cochlear implant candidates, that effect might be achieved by partial electrode insertion providing acoustic stimulation in the low frequencies; or by the combination of a traditional implant in one ear and a hearing aid in the opposite ear.
Effects of age on F0 discrimination and intonation perception in acoustic and simulated electro-acoustic hearing
Successful speech recognition involves the use of multiple cues, including spectral, temporal and prosodic information. Recently, there has been interest in the contributions of talker fundamental frequency (F0) to speech recognition. F0 refers to the rate of vocal fold vibration and is influenced by talker characteristics, such as age, sex and height (Bachorowski and Owren, 1999). F0 is important for understanding speech in competing backgrounds because it provides cues for talker separation (Brokx and Noteboom, 1982; Darwin and Hukin, 2000; Darwin, Brungart, and Simpson, 2003; Drullman and Bronkhorst, 2004). For speech in quiet, F0 can code some consonant characteristics such as plosive consonant voicing and aspiration (Haggard, Ambler, and Callow, 1970) as well as prosodic information including intonation and stress (Bachorowski and Owren, 1999; Bachorowski, 1999; Faulkner, Rosen, and Smith, 2000). For tonal languages, F0 also conveys lexical information (Kuo, Rosen, and Faulkner, 2008).
Because the ability to extract F0 cues in simple tasks is a prerequisite for their use in more complex tasks, this study is concerned with the contributions of F0 to speech recognition in quiet. A companion study (Arehart, Souza, Muralimanohar, and Miller, in press) explores use of F0 cues in competing backgrounds.
For listeners with normal hearing presented with unprocessed speech, research studies show that the dominant cues to F0 perception are the resolved lower-frequency harmonics (Houtsma and Smurzynski, 1990; Arehart, 1994; Oxenham, 2008), referred to here as fine structure. F0 can also be derived from the high-rate envelope fluctuations conveyed by higher-frequency unresolved harmonics, referred to here as periodicity (Oxenham, 2008). Stone et al. (2008) demonstrated that providing periodic cues to F0 improved sentence recognition in a competing speech task. However, recent work by Xu et al. (Xu, Thompson, and Pfingst, 2005; Xu and Zheng, 2007; Xu and Pfingst, 2008) suggested that periodic cues to F0 were most useful when other, more salient cues (specifically, spectral detail) were not available.
The ability to derive F0 from periodicity is of particular interest to cochlear implant wearers, for whom a high level of spectral detail is not possible under current device limitations. Cochlear implants bandpass filter the input signal, then extract and low-pass filter the envelope in each band. The resulting within-band envelope is compressed to accommodate the electrical dynamic range and used to modulate a train of rapid electrical pulses. Speech fine structure is not transmitted. This lack of fine structure leaves cochlear implant wearers at a disadvantage in situations which require tracking pitch variations, including music perception and segregation of multi-talker speech (see Wilson and Dorman, 2008 for a recent review).
Various signal-processing methods have been used to simulate the cues transmitted by cochlear implants for listeners with normal hearing who do not have the complex effects present in real cochlear implant wearers such as a reduced dynamic range and history of auditory deprivation. One common technique is vocoding, in which the envelope is extracted from each band of a filter bank, low-pass filtered, and used to modulate a sine or noise carrier. When the envelope cutoff is above the talker’s F0, amplitude fluctuations at the rate of the voice pitch of the talker will be present in the vocoded signal.
Chatterjee and Peng (Chatterjee and Peng, 2008; Peng, Lu, and Chatterjee, 2009) measured sensitivity to F0 change (intonation) in cochlear-implant wearers and in listeners with normal hearing presented with vocoded speech. The groups were presented with a spondee with artificially manipulated F0 contours. The ability to perceive intonation was significantly correlated (exponential function) with modulation frequency discrimination. The results from the normal-hearing subjects listening to four- and eight-band noise-vocoding were very similar to those of the cochlear-implant wearers, which supports noise-vocoding as an appropriate simulation of cochlear-implant intonation perception. Other authors (Whitmal, Poissant, Freyman, and Helfer, 2007; Souza and Rosen, 2009) have noted that noise-vocoded speech represents a better model for perception of F0 by cochlear implant wearers than sine-vocoded speech, because the noise vocoder eliminates fine-structure cues, whereas sine-vocoded speech contains spectral detail not available in a traditional cochlear implant.
Recently, some individuals with residual low-frequency hearing have received implants in which the electrode array extends only part-way into the cochlea. These individuals receive an electro-acoustic signal (EAS) (Gantz and Turner, 2003; Turner, Gantz, Vidal, Behrens, and Henry, 2004; Gstoettner et al., 2004) with low-frequency cues (including temporal fine-structure) delivered via the acoustic pathway, and high-frequency cues (including periodicity) delivered via the electric pathway. The improved perception of speech provided by EAS hearing compared to traditional implants has been attributed to several aspects of the low-frequency acoustic stimulus, including information about F0, the first formant, and voicing (Kong and Carlyon, 2007; Li and Loizou, 2008a; Brown and Bacon, 2009a).
In evaluating the benefits of EAS versus traditional implants, there has been little attention paid to the unique needs of older users. A recent clinical report (Gantz et al., 2009) suggests that older listeners may receive less benefit from EAS stimulation compared to younger listeners. There are also indications that older adults do not receive as much benefit from traditional cochlear implants as young adults, at least for less redundant acoustic stimuli such as rapid speech or speech in background noise (Sterkers et al., 2004). The present study is concerned with older listeners’ use of the various cues transmitted by EAS as well as traditional implants.
Because age typically covaries with duration of deafness, it is difficult to assess the contributions of age per se using only implant wearers. Use of vocoder simulations offers an opportunity to study use of periodicity and/or fine structure cues to F0 with age without the confounding effects of correlated variables such as age of implantation, duration of deafness, and co-morbid health issues.
The most basic assessment as to whether the ability to perceive F0 changes with age is to measure the F0 difference limen. However, some disagreement exists among the limited data available. Summers and Leek (1998) concluded that age had a minimal and statistically nonsignificant effect on F0DLs. In contrast, Vongpaisal and Pichora-Fuller (2007) found that F0DL increased significantly with age. It is possible that differences in subject selection led to different conclusions; both studies measured F0DL using synthetic vowels, but Vongpaisal and Pichora-Fuller tested 30 subjects with normal or near-normal hearing, while Summers and Leek measured effects of age within a smaller group of older subjects with hearing loss. Nonetheless, given the growing awareness of the importance of F0 to communication, it is important to resolve and expand upon that result.
It may also be the case that the benefit of having different F0s is most relevant when F0 is allowed to vary naturally (i.e., when prosodic cues are present). For example, Cullington and Zeng (2008) found that a child’s voice had a large masking effect, despite it having a distinctly different F0 than a (male) target voice. As another example, when listeners heard two talkers with different monotone pitches (i.e., different F0 but without F0 variation) F0 differences did not aid recognition (Darwin and Hukin, 2000). Li and Loizou (2008b) suggested that F0 information are most valuable when listeners can use them to glimpse the target signal through amplitude fluctuations in the competing signal. The importance—and the complexity--of F0 variation was recently demonstrated by Binns and Culling (2007) who showed that the speech recognition threshold (SRT) for a target talker in the presence of a competing talker was adversely affected when the F0 of a target talker was altered (inverted), but inverting the F0 contour of the interferer did not have a similar effect. Therefore it will be useful not just to measure ability to perceive F0 but also ability to follow F0 as it varies over time.
In the studies described above, subjects were typically younger listeners with normal hearing. Older listeners who have more difficulty detecting static changes in F0 (i.e., high F0DL) may also have difficulty tracking changes in F0 over time, as they might be required to do in realistic situations. The relationship between F0 processing of static and dynamic stimuli has not been studied in older adults. The present study considered the extent to which age-related degradations in F0 processing for steady-state and time-varying stimuli presented in quiet are due to a decreased ability to use fine structure cues provided by the harmonic structure of voiced speech sounds and/or cues provided by high-rate envelope fluctuations (periodicity). Two experimental tasks were included: F0 difference limen (F0DL) for synthetic (steady-state) vowels and ability to use dynamic F0 cues to detect change in intonation.
Methods
Participants
Two groups of participants were recruited for this study. All participants had at least near-normal hearing, defined as pure-tone thresholds of 25 dB HL or better (re: ANSI, 2006) at octave frequencies froms25 to 2 kHz, and 30 dB HL or better at 3 kHz. The older group consisted of 21 adults (16 female, 5 male) aged 66 to 82 years (mean age 70 years). The younger group consisted of 12 adults (8 female, 4 male) aged 20 to 37 years (mean age 24 years). Participants were tested monaurally. As shown in Figure 1, the audiometric thresholds for the listeners in the younger group were generally better than those of the listeners in the older group. To compensate for any differences in audibility between groups, frequency shaping (described below) was applied to all stimuli.
Figure 1.
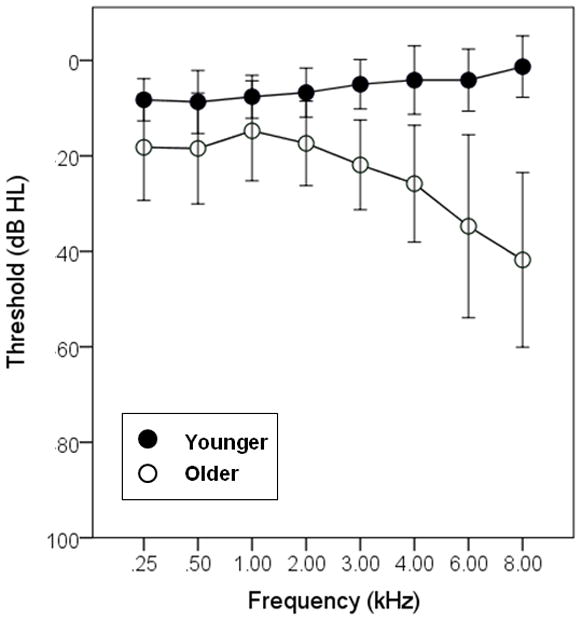
Mean hearing thresholds (in dB HL) for the younger and older listeners. Error bars show +/− one standard deviation about the mean.
All participants had normal middle ear immittance and peak pressure. Cognitive status was screened using the Mini-Mental State Exam (Folstein, Folstein, and McHugh, 1975), with inclusion criteria of a score of 26 or higher. All participants spoke English as their first or primary language. None had any prior hearing aid experience. All participants were paid for their participation. Data were collected at two locations, at University of Washington (UW) and at University of Colorado at Boulder (UC). All test procedures and equipment were the same at both locations.
Stimuli and Procedure
Fundamental frequency difference limen (F0DL)
The F0DL stimuli consisted of the vowel sound/ɝ/synthesized using Sensimetrics cascade formant software (Klatt, 1980) with a sampling rate of 20 kHz and a 16-bit quantization. The first three formants of the vowel were based on averages for adult males (Peterson and Barney, 1952). The specific values of the first five formants were as follows: F1 490 Hz; F2 1350 Hz; F3 1690 Hz; F4 3350 Hz; F5 3850 Hz. Tokens of the vowel sound were generated with F0 of 100 Hz + ΔF0, where ΔF0 ranged from 0 to 130 Hz, in 0.1 Hz increments. The vowels were 300 msec in duration, with 20 msec rise and fall times.
Intonation perception
The stimulus set included four diphthongs:/αʊ/,/eɪ/,/αɪ/and/oɪ/created by Green, Faulkner and Rosen (2002) and used in some of our previous work (Souza and Rosen, 2009). These 620-ms long tokens were created using a Klatt synthesizer in cascade mode (sample rate 20 kHz, parameters specified every 5 ms). The formant values were based on recordings of the diphthongs spoken by a male speaker. The F0 at the midpoint in time of each diphthong was 113 Hz. The ratio of start-to-end frequency varied in twelve equal logarithmic steps from 1:0.5 to 1:2.0. For example, for the 113 Hz midpoint, the F0 for the diphthong at one endpoint of the continuum changed from 80 Hz to 160 Hz (rising intonation) and at the other end of the continuum changed from 160 Hz to 80 Hz (falling intonation). Examples of a rising intonation, an ambiguous intonation and a falling intonation for the diphthong/eI/are shown by the spectrograms and F0 contours stimuli in Figure 2. Note that the spectrograms are very similar because they describe the diphthong that is produced, which is the same for all three intonations. The only change is the periodicity which is independently coded in the periodic amplitude modulations, and can be seen to become more closely spaced over time for the first intonation, remain constant for the second intonation, and become more widely spaced for the third. This difference is reflected in the change in F0 or intonation which is plotted in the lower panels of the figure.
Figure 2.
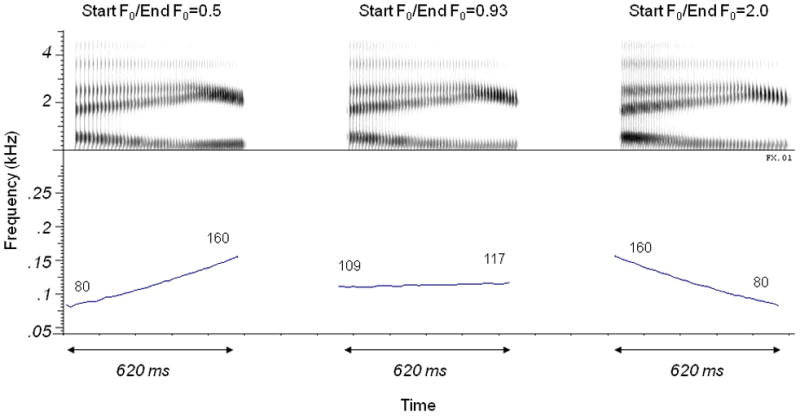
Spectrograms (top 3 panels) and F0 contours (lower 3 panels) for three examples of the dipthong/eI/. The stimulus on the left has a rising intonation, with F0 changing from 80 Hz to 160 Hz over the duration of the signal. The stimulus on the right has a falling intonation, with F0 changing from 160 Hz to 80 Hz over the duration of the signal. The stimulus shown in the center has little intonation, with F0 changing from 109 Hz to 117 Hz over the duration of the signal. Note that the set did not include truly “flat” signals in which F0 did not change at all.
Stimulus processing common to all stimuli
The input speech stimuli were presented to the subjects in three conditions. The first processing condition consisted of stimuli that were bandpass filtered between 80 Hz and 6 kHz using a 12th order elliptical filter. This set was not subjected to any further processing and is referred to here as unprocessed (UNP).
The second condition simulated a fully inserted cochlear implant, using an 8-channel noise-modulated vocoder (VOC). Because we wished to study older listeners’ use of periodicity, the noise vocoder was chosen as a model which would not provide fine-structure cues in the VOC condition (Souza and Rosen, 2009). In this condition, the speech stimuli were first bandpass filtered into 8 contiguous channels using third-order Butterworth filters between 80 Hz and 6 kHz. The cutoff frequencies of the filter bands (Table 1) were based on equal basilar-membrane distance (Greenwood, 1990). The envelopes of these band-limited signals were extracted by half-wave rectification followed by smoothing (low-pass filtering using a fourth order Butterworth filter with a 300 Hz cut-off). The 300 Hz cut-off was chosen to retain the F0 information. Each of the envelopes was applied to an independent noise carrier. The noise-excited signals were then filtered using the same bandpass filter as in the first step of the processing. The root mean square level of each channel was equalized to the level obtained from the initial bandpass filtering. The individual channels were then added together. The resulting signals were band-limited by low-pass filtering at 6 kHz using a 12th order elliptical filter.
Table 1.
Filter specifications for the cochlear implant and EAS simulations
| Cochlear Implant Simulation | EAS Simulation | |||||
|---|---|---|---|---|---|---|
| Channel | Lower Cut-off (Hz) | Center Frequency (Hz) | Upper Cut-off (Hz) | Lower Cut-off (Hz) | Center Frequency (Hz) | Upper Cut-off (Hz) |
| 1 | 80 | 135 | 202 | Low pass filtered Cut-off 611 Hz [corresponds to channels 1–3 of cochlear implant simulation] |
||
| 2 | 202 | 284 | 384 | |||
| 3 | 384 | 507 | 657 | |||
| 4 | 657 | 840 | 1065 | 657 | 840 | 1065 |
| 5 | 1065 | 1339 | 1675 | 1065 | 1339 | 1675 |
| 6 | 1675 | 2086 | 2589 | 1675 | 2086 | 2589 |
| 7 | 2589 | 3203 | 3955 | 2589 | 3203 | 3955 |
| 8 | 3955 | 4875 | 6000 | 3955 | 4875 | 6000 |
The third condition simulated an “electric plus acoustic system” (EAS). The input speech tokens were low-pass filtered using a 512-point Hamming-windowed linear-phase finite-impulse response filter. A cutoff of 611 Hz was chosen to avoid any gaps in the frequency range of information from which possible cues might be lost. To avoid phase distortion due to processing, the MATLAB “filtfilt” function was used. The normalized gain of the filter at cutoff was -6 dB. This low-pass section simulates any residual low frequency hearing in cochlear implant users. This output was combined with a parallel section that consisted of only the 4th – 8th channels of the vocoder simulation as discussed above. The low-pass unprocessed channels and the five high-channel vocoded channels were combined, while maintaining RMS levels obtained from the initial filtering of the vocoder processing.
A 20-ms raised cosine rise-fall shaping was applied to the stimuli in all three conditions. The signals were played out in the following way: Signals were sent from a custom MATLAB program to a Tucker-Davis Technologies (TDT; Alachua, FL) digital signal processor. Following digital-to-analog conversion, the signals were routed through a programmable attenuator before being delivered to the test ear of the listener with an ER2 insert earphone. The baseline level of presentation was 70 dB SPL. To accommodate the high-frequency threshold elevations of some of the older listeners and to minimize differences in audibility across groups, the 70 dB SPL stimuli were amplified using the National Acoustics Laboratories-Revised (NAL-R) linear prescriptive formula based on individual thresholds (Byrne and Dillon, 1986). The frequency-shaped amplification was implemented through offline digital filtering (via a linear-phase finite impulse response [FIR] filter). Stimuli were customized for each individual listener and were stored on a personal computer prior to being played out over the earphone. Listeners were able to register their responses with either a touch screen monitor or with a computer mouse. Testing typically required four hours, divided among one or two hour sessions.
Test procedure
Fundamental Frequency Discrimination
The purpose of this task was to measure the fundamental frequency difference limen (F0DL) for the UNP, VOC and EAS conditions. A two-interval forced-choice three-down one-up procedure with feedback was used to estimate the F0DL (Levitt, 1971). Each trial consisted of two 300-msec intervals, with one interval containing a standard vowel and the other interval containing a comparison vowel. The listener’s task was to choose the interval with the higher-pitched vowel. On each trial, the order of presentation of the standard and comparison intervals was randomized and the F0 of the standard (F0S) was randomly selected over a 20 Hz range (from 100 Hz to 120 Hz). This rove was implemented to limit the extent to which listeners based their discriminations on an internal reference of a specific F0 stimulus (c.f. Qin and Oxenham, 2006). The F0 of the comparison was F0S + ΔF0. The initial value of ΔF0 was 25 Hz. The value of ΔF0 was increased or decreased by a factor of 2 for the first two reversals of the adaptive procedure and by a factor of 1.26 for the last 10 reversals. For example, if the initial (randomly selected) F0S was 110 Hz, the listener would hear a vowel with F0 of 110 Hz, and a vowel with F0 of 135 Hz (ΔF0=25 Hz). If the listener responded correctly to three sequential trials, the ΔF0 would be reduced to decreased by a factor of 2, to 12.5 Hz. If the response was incorrect, the ΔF0 would be increased by a factor of 2, to 50 Hz. For each run, the F0DL estimate was based on the geometric mean of the last 10 reversals.
In preliminary testing where a single exemplar of each token was generated and used for all trials, listeners sometimes used subtle differences in the carrier noise as a basis for identifying that token in the VOC and EAS conditions. To prevent the use of such cues during the experimental trials, 16 vowel tokens were generated for each F0 using repeated runs of the vocoder simulation, and in each trial, the vowel stimulus was randomly selected from that set. To limit the use of intensity cues, the level of the vowels was also roved between +/− 1.5 dB on each trial.
Prior to testing, listeners received two types of practice on the discrimination task. First, participants were familiarized with the vowels by listening to blocks of 20 trials in each processing condition with a fixed ΔF0 of 25 Hz between the standard and comparison. If participants did not score 75% correct, the F0 difference between vowels was increased to 50 Hz, 75 Hz etc until the criterion was achieved. Second, participants completed a practice adaptive run for each of the three processing conditions. In the testing phase, participants completed a total of nine test blocks (3 processing conditions × 3 repetitions), with the order of the test conditions randomized for each listener. The final F0DLs reported here are based on the geometric mean of the three F0DL estimates obtained for each listener in each condition.
Intonation Perception
The purpose of this task was to measure the subject’s ability to perceive rising or falling intonation for the diphthong stimuli in the UNP, VOC and EAS conditions. On each trial, a single stimulus was presented and the participant was required to identify the intonation as either “rise” or “fall” in a 2-alternative forced-choice task. A block always consisted of 48 randomly ordered trials (the 4 diphthongs × 12 F0 steps). Participants heard two practice blocks before proceeding to four test blocks in each of the three processing conditions. Feedback was not given. Testing was usually completed in a single one- to two-hour session. Data are scored as the percent of “fall” responses at each F0 step with each data point based on 16 trials across four blocks.
Results
F0DL
Results for the F0DL task are shown in Figure 3 for each group. For each box, the central bar represents the median and the ends of the box the lower and upper quartiles. The whiskers show the minimum to maximum range. Older participants had larger F0DLs, particularly for the VOC stimuli. For example, for the UNP and EAS signals the older listeners could detect a 4 Hz difference, on average, compared to 2 Hz for the younger listeners. For the VOC stimuli, the older listeners required 28 Hz on average compared to 10 Hz for the younger listeners. The variability in F0DLs was also greater in the older group for all test conditions.
Figure 3.
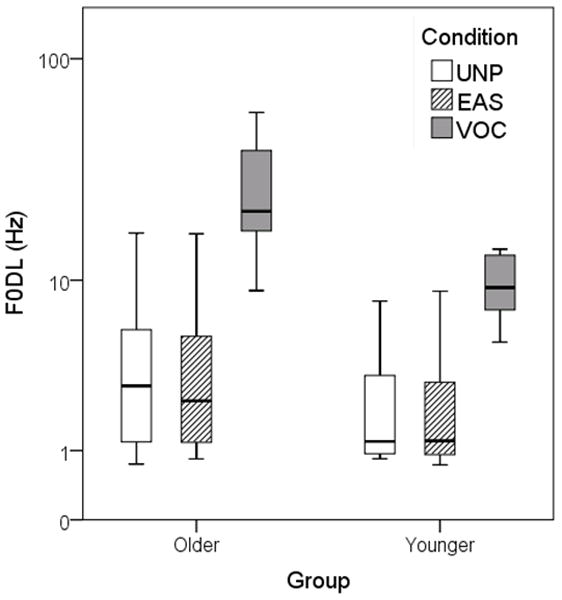
Results of F0DL task. The central bar in each box shows the median and the ends of the box show the lower and upper quartiles. The whiskers show the minimum to maximum range.
The F0DL data were analyzed using a two-way ANOVA1, with condition as the repeated-measures factor and age group as the between-subjects factor. We first looked for between-site differences by entering site into the analysis as a between subjects variable. There was no difference between sites (F1,29=.29, p=.597) nor any interaction between site and any other factor (p>.10 in each case). Accordingly, data were collapsed across site for the remaining analyses described here. The interaction between condition and group was not significant (F2,62=2.19, p=.142). The effect of group was significant, with poorer performance by the older listeners (F1,31=6.87, p=.013). There was also a significant effect of condition (F2,62=146.82, p<.001). The data were collapsed across group and Bonferroni-qualified post-hoc means comparisons indicated that VOC was worse than UNP (t32=−13.60, p<.001) and EAS (t32=−13.06, p<.001). There was no difference between EAS and UNP (t32=−.40, p=.684).
Intonation Perception
Results for the perception of intonation of the diphthong stimuli are shown in Figure 4. The abscissa shows the F0 ratio between the beginning and end of the stimulus from rising (0.5) to falling (2.0). The center point of the axis (1.0) indicates a flat F0 contour. The ordinate shows the proportion of trials in which the listener perceived that the signal had a falling intonation. For a subject and stimulus in which intonation could be easily perceived, we would expect the listener to identify an F0 ratio of 0.5 as falling 0% of the time; and F0 ratio of 2.0 as falling 100% of the time, and to be at chance (50%) for ratios about 1.0. Thus, a steeper slope indicates better perception of intonation and a shallower slope indicates that a participant had more difficulty identifying the direction of pitch change.
Figure 4.
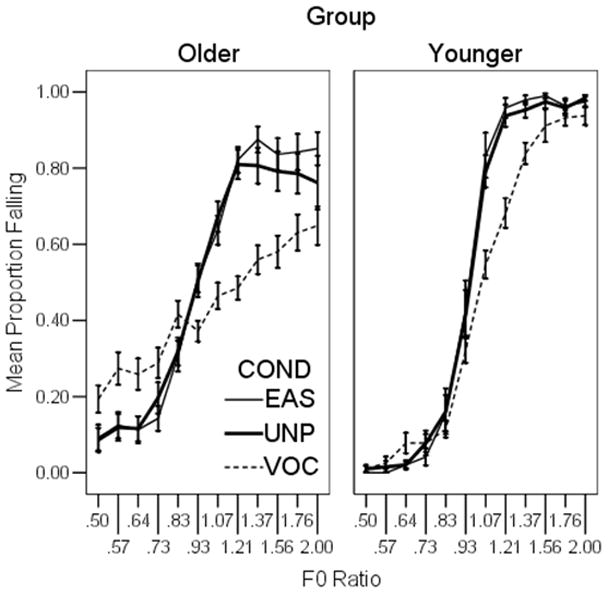
Results of the intonation perception task. The abscissa shows the F0 ratio between the beginning and end of the diphthong, ranging from rising (0.5) to falling (2.0). The ordinate shows the proportion of trials in which the listener perceived that the signal was had a falling intonation. Steeper slopes indicate better perception of intonation. Error bars show +/− one standard error about the mean. Results for the older listeners are shown in the left panel and for younger listeners in the right panel.
Shallower slopes were observed for the older listeners (left panel) compared to the younger listeners; and for the VOC stimuli (dashed line) compared to the UNP (heavy solid line) and EAS stimuli (light solid line). To quantify the slope of the function for each subject, the F0 ratio was log-transformed (base 10) and a logistic regression was applied. In a logistic regression, a slope of zero (null hypothesis) indicates that the F0 ratio has no influence on perception of intonation. A larger slope indicates a stronger relationship between F0 and perception of intonation. A separate regression was completed for each processing condition and center F0 for each subject. Chi squared tests indicated that none of the fits deviated significantly from the observed data. Slope estimates from the regression fits ranged from near zero for the relatively flat VOC functions to more than 20 for the steeper unprocessed functions.
As noted above, there was considerable variability among participants. All of the younger listeners perceived intonation, with most listeners showing very steep functions for the UNP and EAS stimuli, and shallower functions for the VOC stimuli. Among the older listeners, some individuals performed similarly to the younger listeners; that is, they had good intonation perception for the UNP and EAS stimuli, and slightly worse perception of intonation for the VOC stimuli. Other older participants had good intonation perception for the UNP and EAS stimuli, but were unable to perceive any intonation in the VOC stimuli (i.e., their functions for the vocoded stimuli were flat). There was no correlation between the performance of subjects in the older group and their hearing status, as defined by pure-tone average (p>.50 for each condition). Those data suggest a deficit in use of periodicity cues.
Recall that a slope of zero indicates that there is no relationship between F0 ratio and perception of intonation. One interpretation of such a slope is that the listener simply could not judge intonation on the basis of F0. However a slope of zero, particularly in the unprocessed condition where we would expect intonation cues to be most salient, also raises the possibility that the listener was unable to perform the task. Technically, this concern would apply only to slopes of zero and not to fractional positive slope values. However, there is some variability in the data, so we conservatively considered any listener with fractional slopes less than 1.0 in the unprocessed condition to be unable to perform the task. This was the case for three of the older subjects. Because it was unclear whether those subjects did not understand the task, or simply had minimal perception of intonation, their data were excluded from the group analysis and will be discussed separately.
For the remaining 30 subjects, the slope estimates were analyzed using a two-way Analysis of Variance (ANOVA), with condition as the repeated measures factor and age group as the between-subjects factor. To ensure that there were no differences between the UW and CU data, site was initially entered as a between-subjects variable. This analysis revealed a nonsignificant effect of site (F1,26=.11, p=.747); nor did site interact with any other variables (p>.10 in each case). Accordingly, the analyses were completed with data collapsed across site.
There was a non-significant interaction between condition and group (F2,56=.49, p=.566). The effect of group was significant, with poorer performance by the older listeners (F1,28=10.64, p=.003). There was a significant effect of condition (F2,56=35.43, p<.005). The data were collapsed across group and Bonferroni-qualified post-hoc means comparisons indicated that VOC was worse than UNP (t29=6.26, p<.005) and EAS (t29=7.22, p<.005). There was no difference between EAS and UNP (t29=−1.47, p=.154).
Relationship between F0DL and perception of intonation
Figure 5 shows the relationship between ability to detect differences in fundamental frequency (F0DL) and the ability to use dynamic F0 cues to determine intonation in each of the three processing conditions. On the x axis, a smaller number indicates the listener is more sensitive to small changes in F0. On the y axis, a larger slope indicates the listener is better able to judge rising versus falling intonation patterns. As we might expect, there is a relationship such that those listeners who have large F0DLs cannot use that information dynamically. Pearson product-moment correlations (with F0DLs log-transformed to normalize the distribution) were significant for the UNP (r=−.78, p<.005), EAS (r=−.77, p<.005) and VOC stimuli (r=−.72, p<.005). It was never the case that any listener had poorer F0DLs but good perception of intonation. Presumably, the ability to perceive static differences in F0 is a prerequisite for perceiving dynamic F0. However, a small F0DL does not always confer ability to perceive dynamic changes in F0. Instead, the listeners with good (small) F0DLs might or might not have good intonation perception. This suggests that perception of intonation requires some perceptual skill beyond F0 discrimination.
Figure 5.
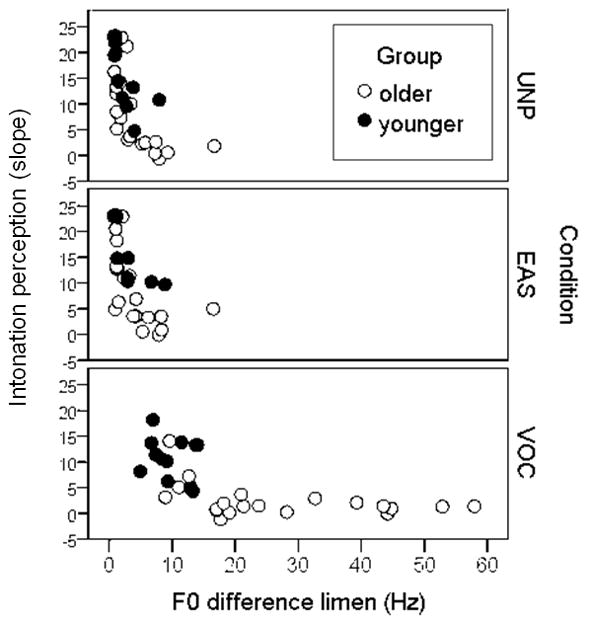
The slope of the intonation function is plotted as a function of F0DL. Each data point represents a single subject. For intonation, greater slopes indicate better perception of intonation. For F0DL, smaller numbers indicate better perception of F0 differences.
Discussion
Traditional cochlear implants are capable of providing envelope and periodicity cues, but not fine-structure cues. Partial-insertion implants which allow EAS stimulation are intended to convey fine-structure cues via low-frequency acoustic information. Some patients will be candidates for both types, and any treatment decision must consider the relative benefit of each type of device. We approached this from a cue-perception perspective, where older listeners discriminated signals which provided either periodicity (VOC) or periodicity and fine structure (EAS/UNP).
Age and F0DL
Results demonstrated that the ability to detect a change in fundamental frequency (F0DL) was impaired in older listeners with normal or near-normal hearing in all test conditions. Recall that there was some disagreement between two previous studies, one of which concluded that age resulted in higher F0DLs (Vongpaisal and Pichora-Fuller, 2007) and the other which did not (Summers and Leek, 1998). The conclusion of the current study is that age, even in the absence of significant acoustic threshold elevation, reduces the ability to discriminate F0 regardless of whether that information is conveyed via periodicity or periodicity plus fine structure. One feature of the current work is that signal audibility was considered in two ways: by selection of listeners with normal or near-normal hearing and by provision of appropriate gain-frequency shaping. This effort to assure audibility is an important point, because audibility deficits are easily corrected by appropriate amplification whereas non-audibility age-related differences are not, or may require more sophisticated processing methods to compensate for them.
Age and intonation
To our knowledge, these data are the first to characterize the ability of older subjects to use changes in F0 to obtain information about intonation in signals with varying levels of cue availability ranging from unlimited acoustic cues to periodicity-only cues. The use of synthetic signals meant that we could precisely control those cues and limit other sources of information. Our data showed that older listeners have poorer intonation perception for all of the signals tested.
Three older participants fell into a distinct pattern, in that they stated that they understood the task but were unable to perceive any intonation change for any of the stimuli. Those individuals were representative of the subject cohort in age (73, 73, and 66 years), in pure-tone average (10, 20, and 18 dB HL), and passed the cognitive screening. Their F0DLs were at the higher end of the range. For UNP and EAS, they ranged from 7–9 Hz (where the group mean was 3 Hz); and for VOC, they ranged from 18–44 Hz (where the group mean was 20 Hz). Although not definitive, their higher F0DLs suggest that poorer perception of pitch differences may have contributed to their inability to perform the intonation task.
For many of the older listeners, including the three just discussed, perception of intonation was quite poor. Do such individuals have more difficulty in realistic situations that involve intonation change? Some previous work found that older listeners were less able to use prosodic cues to determine talker emotion (Paulmann, Pell, and Kotz, 2008). To the extent that emotion is carried by F0, that work supports the present data and suggests another practical consequence of this deficit.
Although F0 is the primary cue to intonation, unprocessed sentences offer other cues to intonation such as word lengthening and syllable stress (Smith, 2002). In realistic situations then, even in the extreme case where an individual could not perceive intonation from F0, some prosodic cues may still be perceived.
One caveat is that the stimuli in this study were modeled on a male voice. Temporal cues to voice pitch are less effective as F0 increases above 200 Hz (Patterson, Johnson-Davies, and Milroy, 1978; Arehart and Burns, 1999; Green et al., 2002; Green, Faulkner, and Rosen, 2004; Qin and Oxenham, 2006; Laneau and Moonen, 2006; Chatterjee and Peng, 2008; Souza and Rosen, 2009). This occurs because sensitivity to modulation decreases with increasing modulation frequency (Grant, Summers, and Leek, 1998). Thus, periodic cues to voice pitch would be less available for most female voices.
Relating static and dynamic abilities
The listeners with the poorest F0DLs (most of whom were older) were also those who could not judge intonation. As we might reasonably expect, listeners who have some basic deficit in perception of F0 cannot then apply F0 to more complex or dynamic tasks. However, the listeners with good F0DLs showed a wide spread of ability to judge intonation, so accurate perception of intonation seems to require some ability beyond pitch perception. Similarly, the data of Chatterjee and Peng (Chatterjee and Peng, 2008) relating pitch discrimination to intonation perception were best fit with an exponential function, demonstrating that while temporal envelope pitch processing was necessary, it was not sufficient for intonation perception.
In a broader sense, we expect that older adults who score poorly on both F0DL and intonation perception will also be those who have the most difficulty using F0DL differences to assist in complex listening situations. These older adults may also experience the most difficulty in realistic situations likely to require the use of those cues, such as attending to one talker in the presence of a competing talker. In pilot data collected for the same subject cohort, we found that older listeners reported more difficulty in speech-on-speech situations than younger listeners, and that the degree of perceived difficulty was unrelated to pure-tone thresholds.
Underlying mechanisms
There was no significant interaction between age and condition for either task. Certainly, older adults have deficits in perceiving (or encoding or utilizing) periodicity, as evidenced by the age effect in the VOC condition in which periodicity was the only distinguishing cue. It is less clear whether age confers deficits in fine structure perception, as has been previously proposed (e.g., Vongpaisal and Pichora-Fuller, 2007). We consider two possibilities.
The first possibility is that older listeners have problems perceiving periodicity, but not fine structure. In this scenario, the age deficit in the UNP and EAS conditions reflects older listener’s inability either to perceive the embedded periodicity cues, or to integrate those cues with other acoustic information. Even when fine-structure cues are available periodicity has an additive benefit (Brown and Bacon, 2009b). Although speech recognition was not measured in the present study, the hypothesis that age impairs periodicity perception is in good agreement with our previous work (Souza, 2000; Souza and Kitch, 2001; Souza and Boike, 2006). For those data, age impaired perception of voicing, which would be expected to be derived mainly from periodicity cues in the signals used. That idea is also consistent with the limited empirical data available for older cochlear implant wearers, which suggests that success with traditional implants (which provide periodicity, but not fine structure) may decrease with age (Sterkers et al., 2004).
A second possibility is that age results in deficits in both periodicity and fine structure perception. Pichora-Fuller (Vongpaisal and Pichora-Fuller, 2007; Pichora-Fuller, Schneider, Macdonald, Pass, and Brown, 2007; Macdonald, Pichora-Fuller, and Schneider, 2010) has argued that aging results in a loss of neural synchrony which impairs perception of temporal fine structure. Because none of our signals provided only fine structure (i.e., periodicity was always present), we could not evaluate this directly. However, continued work on this issue is underway in our laboratories.
Clinical implications and mitigating factors
In summary, the data presented here can be considered at two levels. First, we can consider the effects of age on aspects of speech processing related to differences in voice pitch and perception of intonation. Results suggest that some, but not all older listeners, can extract information from periodicity cues. The variability across the older group is of clinical significance, because those patients who have more difficulty with such cues would be expected to have more difficulty in complex listening situations in everyday life. In turn, they may also need more counseling to ensure realistic expectations for communication; require assistive devices to improve signal-to-noise ratio; or benefit from attention to visual cues to supplement their auditory abilities.
Second, these findings have implications for use of traditional implants with older patients. There has been some discussion in the literature as to whether poorer performance by older individuals fit with traditional cochlear implants is due to advanced age per se, to duration of deafness, or to other factors unique to this population. In the present data set, older listeners performed more poorly than younger listeners given a simulated-cochlear implant signal, despite normal to near-normal hearing thresholds. While auditory deprivation may be an important factor in explaining reduced performance by older cochlear-implant candidates, auditory deprivation is not a plausible explanation for our older listeners even though they had slightly poorer hearing thresholds than the younger listeners.
Most of our older listeners could take advantage of low-frequency cues provided by a hybrid stimulus (i.e., scores improved between the VOC and EAS conditions). Thus, the data suggest that combining acoustic cues with periodicity cues is of benefit to older persons listening to speech in quiet, and should be considered in those individuals who are appropriate candidates. EAS hearing configurations can be achieved in two ways. The first includes partial electrode insertion providing electrical stimulation in the higher frequencies and acoustic stimulation in the same ear in the low frequencies. The second includes a traditional long-electrode in one ear and residual acoustic hearing (with a hearing aid) in the opposite ear. For older adults who are not able to travel to a specialized center for the short-electrode device, the bilateral configuration may offer similar benefits.
One caveat is that the present data are based on simulations. While simulations are a common approach which offers careful controls which help delineate the effects of peripheral threshold elevation versus higher-order processes, they cannot replace testing with older adults who have actual EAS devices. Listeners with EAS devices confront factors beyond those of our subject cohort, including duration of deafness, acclimatization to signal processing, and variations in listening experience. In addition, higher-level processing requirements for older adults listening with actual EAS devices may be greater than what our older listeners experienced, given that age-related deficits escalate when peripheral sensory cues are degraded and when the complexity of the listening task increases (Pichora-Fuller and Souza, 2003; Rossi-Katz and Arehart, 2009).
Acknowledgments
Work was supported by the National Institutes of Health (R01 DC006014) and by the Bloedel Hearing Research Center. The authors are grateful to Tim Green and Stuart Rosen for sharing their stimuli and computer programs, and to Melinda Anderson, Naomi Croghan and Alexandra Dykhouse for assistance in data collection.
Footnotes
For the following analyses, if Mauchley’s test indicated that the assumption of sphericity was violated results refer to the Greenhouse-Geisser values.
References
- Arehart K. Effects of harmonic content on complex-tone fundamental-frequency discrimination in hearing-impaired listeners. J Acoust Soc Am. 1994;95(3574) doi: 10.1121/1.409975. [DOI] [PubMed] [Google Scholar]
- Arehart K, Burns EM. A comparison of monotic and dichotic complex-tone pitch perception in listeners with hearing loss. J Acoust Soc Am. 1999;106(2):993–997. doi: 10.1121/1.427111. [DOI] [PubMed] [Google Scholar]
- Arehart K, Souza P, Muralimanohar R, Miller C. Effects of age on concurrent vowel perception in acoustic and simulated electro-acoustic hearing. Journal of Speech, Language and Hearing Research. doi: 10.1044/1092-4388(2010/09-0145). (in press) [DOI] [PMC free article] [PubMed] [Google Scholar]
- Bachorowski JA. Vocal expression and perception of emotion. Current Directions in Psychological Science. 1999;8(2):53–57. [Google Scholar]
- Bachorowski JA, Owren MJ. Acoustic correlates of talker sex and individual talker identity are present in a short vowel segment produced in running speech. J Acoust Soc Am. 1999;106(2):1054–1063. doi: 10.1121/1.427115. [DOI] [PubMed] [Google Scholar]
- Binns C, Culling JF. The role of fundamental frequency contours in the perception of speech against interfering speech. J Acoust Soc Am. 2007;122(3):1765. doi: 10.1121/1.2751394. [DOI] [PubMed] [Google Scholar]
- Brokx JP, Noteboom SG. Intonation and the perceptual segregation of competing voices. Journal of Phonetics. 1982;10:23–36. [Google Scholar]
- Brown CA, Bacon SP. Achieving Electric-Acoustic Benefit with a Modulated Tone. Ear and Hearing. 2009a;30(5):489–493. doi: 10.1097/AUD.0b013e3181ab2b87. [DOI] [PMC free article] [PubMed] [Google Scholar]
- Brown CA, Bacon SP. Low-frequency speech cues and simulated electric-acoustic hearing. J Acoust Soc Am. 2009b;125(3):1658–1665. doi: 10.1121/1.3068441. [DOI] [PMC free article] [PubMed] [Google Scholar]
- Byrne D, Dillon H. The National Acoustic Laboratories’ (NAL) new procedure for selecting the gain and frequency response of a hearing aid. Ear and Hearing. 1986;7(4):257–265. doi: 10.1097/00003446-198608000-00007. [DOI] [PubMed] [Google Scholar]
- Chatterjee M, Peng SC. Processing F0 with cochlear implants: Modulation frequency discrimination and speech intonation recognition. Hear Res. 2008;235(1–2):143–156. doi: 10.1016/j.heares.2007.11.004. [DOI] [PMC free article] [PubMed] [Google Scholar]
- Cullington HE, Zeng FG. Speech recognition with varying numbers and types of competing talkers by normal-hearing, cochlear-implant, and implant simulation subjects. J Acoust Soc Am. 2008;123(1):450–461. doi: 10.1121/1.2805617. [DOI] [PubMed] [Google Scholar]
- Darwin CJ, Brungart DS, Simpson BD. Effects of fundamental frequency and vocal-tract length changes on attention to one of two simultaneous talkers. J Acoust Soc Am. 2003;114(5):2913–2922. doi: 10.1121/1.1616924. [DOI] [PubMed] [Google Scholar]
- Darwin CJ, Hukin RW. Effectiveness of spatial cues, prosody and talker characteristics in selective attention. J Acoust Soc Am. 2000;107(2):970–977. doi: 10.1121/1.428278. [DOI] [PubMed] [Google Scholar]
- Drullman R, Bronkhorst AW. Speech perception and talker segregation: effects of level, pitch, and tactile support with multiple simultaneous talkers. J Acoust Soc Am. 2004;116(5):3090–3098. doi: 10.1121/1.1802535. [DOI] [PubMed] [Google Scholar]
- Faulkner A, Rosen S, Smith C. Effects of the salience of pitch and periodicity information on the intelligibility of four-channel vocoded speech: implications for cochlear implants. J Acoust Soc Am. 2000;108(4):1877–1887. doi: 10.1121/1.1310667. [DOI] [PubMed] [Google Scholar]
- Folstein MF, Folstein SE, McHugh PR. “Mini-mental state”. A practical method for grading the cognitive state of patients for the clinician. Journal of Psychiatric Research. 1975;12(3):189–198. doi: 10.1016/0022-3956(75)90026-6. [DOI] [PubMed] [Google Scholar]
- Gantz BJ, Hansen MR, Turner CW, Oleson JJ, Reiss LA, Parkinson AJ. Hybrid 10 clinical trial: preliminary results. Audiology and Neurootology. 2009;14(Suppl 1):32–38. doi: 10.1159/000206493. [DOI] [PMC free article] [PubMed] [Google Scholar]
- Gantz BJ, Turner CW. Combining acoustic and electrical hearing. Laryngoscope. 2003;113(10):1726–1730. doi: 10.1097/00005537-200310000-00012. [DOI] [PubMed] [Google Scholar]
- Grant KW, Summers V, Leek MR. Modulation rate detection and discrimination by normal-hearing and hearing-impaired listeners. J Acoust Soc Am. 1998;104(2 Pt 1):1051–1060. doi: 10.1121/1.423323. [DOI] [PubMed] [Google Scholar]
- Green T, Faulkner A, Rosen S. Spectral and temporal cues to pitch in noise-excited vocoder simulations of continuous-interleaved-sampling cochlear implants. Journal of the Acoustical Society of America. 2002;112(5):2155–2164. doi: 10.1121/1.1506688. [DOI] [PubMed] [Google Scholar]
- Green T, Faulkner A, Rosen S. Enhancing temporal cues to voice pitch in continuous interleaved sampling cochlear implants. J Acoust Soc Am. 2004;116(4 Pt 1):2298–2310. doi: 10.1121/1.1785611. [DOI] [PubMed] [Google Scholar]
- Greenwood DD. A cochlear frequency-position function for several species-29 years later. J Acoust Soc Am. 1990;87(6):2592–2605. doi: 10.1121/1.399052. [DOI] [PubMed] [Google Scholar]
- Gstoettner W, Kiefer J, Baumgartner WD, Pok S, Peters S, Adunka O. Hearing preservation in cochlear implantation for electric acoustic stimulation. Acta Otolaryngol. 2004;124(4):348–352. doi: 10.1080/00016480410016432. [DOI] [PubMed] [Google Scholar]
- Haggard M, Ambler S, Callow M. Pitch as a voicing cue. J Acoust Soc Am. 1970;47(2):613–617. doi: 10.1121/1.1911936. [DOI] [PubMed] [Google Scholar]
- Houtsma AJ, Smurzynski J. Pitch identification and discrimination for complex tones with many harmonics. J Acoust Soc Am. 1990;87(1):304–310. [Google Scholar]
- Klatt D. Software for a cascade/parallel formant synthesizer. J Acoust Soc Am. 1980;67:13–33. [Google Scholar]
- Kong YY, Carlyon RP. Improved speech recognition in noise in simulated binaurally combined acoustic and electric stimulation. J Acoust Soc Am. 2007;121(6):3717–3727. doi: 10.1121/1.2717408. [DOI] [PubMed] [Google Scholar]
- Kuo YC, Rosen S, Faulkner A. Acoustic cues to tonal contrasts in Mandarin: implications for cochlear implants. J Acoust Soc Am. 2008;123(5):2815. doi: 10.1121/1.2896755. [DOI] [PubMed] [Google Scholar]
- Laneau J, Moonen M. Factors affecting the use of noise-band vocoders as acoustic models for pitch perception in cochlear implants. Journal of the Acoustical Society of America. 2006;119(1):491–506. doi: 10.1121/1.2133391. [DOI] [PubMed] [Google Scholar]
- Levitt H. Transformed up-down methods in psychoacoustics. J Acoust Soc Am. 1971;49(2):467. [PubMed] [Google Scholar]
- Li N, Loizou PD. Factors influencing glimpsing of speech in noise. J Acoust Soc Am. 2008a;122(2):1165–1172. doi: 10.1121/1.2749454. [DOI] [PMC free article] [PubMed] [Google Scholar]
- Li N, Loizou PD. A glimpsing account for the benefit of simulated combined acoustic and electric hearing. J Acoust Soc Am. 2008b;123(4):2287–2294. doi: 10.1121/1.2839013. [DOI] [PMC free article] [PubMed] [Google Scholar]
- Macdonald EN, Pichora-Fuller K, Schneider BA. Effects on speech intelligibility of temporal jittering and spectral smearing of the high-frequency components of speech. Hear Res. 2010 doi: 10.1016/j.heares.2010.01.005. [DOI] [PubMed] [Google Scholar]
- Oxenham AJ. Pitch perception and auditory stream segregation: Implications for hearing loss and cochlear implants. Trends in Amplification. 2008;12:316–331. doi: 10.1177/1084713808325881. [DOI] [PMC free article] [PubMed] [Google Scholar]
- Patterson RD, Johnson-Davies D, Milroy R. Amplitude-modulated noise: the detection of modulation versus the detection of modulation rate. J Acoust Soc Am. 1978;63(6):1904–1911. doi: 10.1121/1.381931. [DOI] [PubMed] [Google Scholar]
- Paulmann S, Pell MD, Kotz SA. How aging affects the recognition of emotional speech. Brain and Language. 2008;104(3):262–269. doi: 10.1016/j.bandl.2007.03.002. [DOI] [PubMed] [Google Scholar]
- Peng SC, Lu N, Chatterjee M. Effects of cooperating and conflicting cues on speech intonation recognition by cochlear implant users and normal hearing listeners. Audiology and Neurootology. 2009;14(5):327–337. doi: 10.1159/000212112. [DOI] [PMC free article] [PubMed] [Google Scholar]
- Peterson G, Barney H. Control methods used in a study of the vowels. J Acoust Soc Am. 1952;24:175–184. [Google Scholar]
- Pichora-Fuller K, Schneider BA, Macdonald EN, Pass HE, Brown S. Temporal jitter disrupts speech intelligibility: a simulation of auditory aging. Hear Res. 2007;223(1–2):114–121. doi: 10.1016/j.heares.2006.10.009. [DOI] [PubMed] [Google Scholar]
- Pichora-Fuller K, Souza P. Effects of aging on auditory processing of speech. International Journal of Audiology. 2003;42(Suppl 2):2S11–12S16. [PubMed] [Google Scholar]
- Qin MK, Oxenham AJ. Effects of introducing unprocessed low-frequency information on the reception of envelope-vocoder processed speech. J Acoust Soc Am. 2006;119(4):2417–2426. doi: 10.1121/1.2178719. [DOI] [PubMed] [Google Scholar]
- Rossi-Katz J, Arehart K. Message and talker identification in older adults: effects of task, distinctiveness of the talkers’ voices and meaningfulness of the competing message. J Speech Lang Hear Res. 2009;52(2):435–453. doi: 10.1044/1092-4388(2008/07-0243). [DOI] [PubMed] [Google Scholar]
- Smith CL. Prosodic finality and sentence type in French. Lang Speech. 2002;45(Pt 2):141–178. doi: 10.1177/00238309020450020301. [DOI] [PubMed] [Google Scholar]
- Souza P. Older listeners’ use of temporal cues altered by compression amplification. J Speech Lang Hear Res. 2000;43(3):661–674. doi: 10.1044/jslhr.4303.661. [DOI] [PubMed] [Google Scholar]
- Souza P, Boike KT. Combining temporal-envelope cues across channels: effects of age and hearing loss. Journal of Speech, Language and Hearing Research. 2006;49(1):138–149. doi: 10.1044/1092-4388(2006/011). [DOI] [PubMed] [Google Scholar]
- Souza P, Kitch V. The contribution of amplitude envelope cues to sentence identification in young and aged listeners. Ear Hear. 2001;22(2):112–119. doi: 10.1097/00003446-200104000-00004. [DOI] [PubMed] [Google Scholar]
- Souza P, Rosen S. Effects of envelope bandwidth on the intelligibility of sine- and noise-vocoded speech. J Acoust Soc Am. 2009;126(2):792–805. doi: 10.1121/1.3158835. [DOI] [PMC free article] [PubMed] [Google Scholar]
- Sterkers O, Mosnier I, Ambert-Dahan E, Herelle-Dupuy E, Borzorg-Grayeli A, Bouccara D. Cochlear implants in elderly people: Preliminary results. Acta Otolaryngol Suppl. 2004;552:64–67. [PubMed] [Google Scholar]
- Summers V, Leek MR. F0 processing and the separation of competing speech signals by listeners with normal hearing and with hearing loss. Journal of Speech, Language and Hearing Research. 1998;41:1294–1306. doi: 10.1044/jslhr.4106.1294. [DOI] [PubMed] [Google Scholar]
- Turner CW, Gantz BJ, Vidal C, Behrens A, Henry BA. Speech recognition in noise for cochlear implant listeners: benefits of residual acoustic hearing. J Acoust Soc Am. 2004;115(4):1729–1735. doi: 10.1121/1.1687425. [DOI] [PubMed] [Google Scholar]
- Vongpaisal T, Pichora-Fuller K. Effect of age on F0 difference limen and concurrent vowel identification. Journal of Speech, Language and Hearing Research. 2007;50:1139–1156. doi: 10.1044/1092-4388(2007/079). [DOI] [PubMed] [Google Scholar]
- Whitmal NA, Poissant SF, Freyman RL, Helfer KS. Speech intelligibility in cochlear implant simulations: Effects of carrier type, interfering noise, and subject experience. Journal of the Acoustical Society of America. 2007;122(4):2376–2388. doi: 10.1121/1.2773993. [DOI] [PubMed] [Google Scholar]
- Wilson BS, Dorman MF. Cochlear implants: a remarkable past and a brilliant future. Hear Res. 2008;242(1–2):3–21. doi: 10.1016/j.heares.2008.06.005. [DOI] [PMC free article] [PubMed] [Google Scholar]
- Xu L, Pfingst BE. Spectral and temporal cues for speech recognition: implications for auditory prostheses. Hear Res. 2008;242(1–2):132–140. doi: 10.1016/j.heares.2007.12.010. [DOI] [PMC free article] [PubMed] [Google Scholar]
- Xu L, Thompson CS, Pfingst BE. Relative contributions of spectral and temporal cues for phoneme recognition. J Acoust Soc Am. 2005;117(5):3255–3267. doi: 10.1121/1.1886405. [DOI] [PMC free article] [PubMed] [Google Scholar]
- Xu L, Zheng Y. Spectral and temporal cues for phoneme recognition in noise. J Acoust Soc Am. 2007;122(3):1758. doi: 10.1121/1.2767000. [DOI] [PubMed] [Google Scholar]