

Abstract
Background
Metastases formation depends on the ability of tumor cells to invade basement membranes in a process involving enzymes capable of degrading extracellular matrix components.
Purpose
To examine the expression of heparanase in oral carcinomas and correlate its staining extent, intensity and cellular localization with patient’s outcome.
Results
Quantitative real-time PCR revealed over 4-fold increase in heparanase levels in oral carcinomas compared with adjacent normal tissue. Normal oral epithelium was found negative for heparanase, while all oral carcinomas stained positively for heparanase. Heparanase staining was associated with Ki67 staining, a measure of cell proliferation. Notably, while cytoplasmic localization of heparanase was associated with high grade carcinomas, nuclear localization of the enzyme was found primarily in low grade, well differentiated tumors, and in all oral verrucous carcinomas.
Conclusion
Expression level and cellular localization of heparanase could serve as an important diagnostic marker in oral cancer patients.
Keywords: heparanase, staining, localization, nuclear, verrucous carcinoma
Introduction
Head & neck cancer accounts for about 5% of all cancers 1, 2. Oral cancer accounts for roughly 30% of all head & neck cancers exhibiting high mortality which, despite progress in treatment, have not improved dramatically over the last three decades. Depending on the tumor site, the 5 year survival rate of oral squamous cell carcinoma (SCC) patients ranges from 30-80% 3 (61% for years 1999-2005) 1. Thus, novel therapeutic modalities are needed to improve the prognosis for patients with advanced oral cancer. The etiology of oral cancer is multifactorial, and no single clearly recognizable cause has been characterized.
Heparanase is an endoglycosidase that specifically cleaves heparan sulfate (HS) side chains of HS proteoglycans 4-6, a major constituent of the extracellular matrix (ECM). Traditionally, heparanase activity was correlated with the metastatic potential of tumor-derived cells, attributed to enhanced cell dissemination as a consequence of HS cleavage and remodeling of the ECM barrier 7, 8. Similarly, heparanase activity was implicated in cell dissemination associated with inflammation and angiogenesis 5. In recent studies, heparanase induction was noted in increasing number of hematological and solid tumors including carcinomas of the head and neck 9-11, conferring an invasive phenotype 12-14 and positioning heparanase as a potential target for anti-cancer drug development 13, 15-17. Additionally, there is growing evidence that heparanase can up regulate the expression of genes associated with aggressive tumor behavior. These include VEGF, MMP-9, uPA/uPAR and tissue factor and likely others yet to be discovered 18-20. Elevated levels of heparanase are detected in the urine and plasma of cancer patients 21-23. Moreover, enhanced heparanase expression correlates with metastatic potential, tumor vascularity and reduced postoperative survival of cancer patients 12-14. The role of heparanase in tumorigenesis is further supported by findings that heparanase inhibitors 13, 15, 24 and gene silencing 25, 26 can inhibit tumor growth and metastasis.
The present study was undertaken to investigate the expression, cellular localization and clinical significance of heparanase in oral squamous carcinoma. We report that heparanase is over expressed in the vast majority of oral carcinomas, associating with tumor differentiation level and inversely correlating with patient’s survival. Furthermore, we investigated and compared between two types of oral carcinomas, squamous cell carcinoma and verrucous carcinoma which represents a non-metastasizing, well differentiated tumor. While cytoplasmic localization of heparanase was associated with high grade carcinomas, nuclear localization of the enzyme was found primarily in low grade, well differentiated tumors. Altogether, our study could assist in the diagnosis and prognosis of oral cancer patients and promote the incorporation of heparanase inhibitors into therapeutic regimens for oral cancer.
Materials and Methods
Patients
The study included archival paraffin embedded pathological biopsy specimens that were retrospectively collected from 50 oral cancer patients. The study cohort included 8 cases of verrucous carcinoma (Fig. 2C d, e) and 42 cases of SCC (Fig. 2C g, h); 15 lip SCC, and 27 intra-oral SCC. One verrucous carcinoma case was diagnosed as ’hybrid’ (i.e., included a combination of verrucous carcinoma and SCC), while all the rest were diagnosed as ‘pure’ verrucous carcinomas. Patients were diagnosed and treated at the Department of Oral and Maxillofacial Surgery, Rambam Health Care Campus, Haifa, Israel. Inclusion criteria were oral carcinoma patients that were treated surgically according to standard procedures consisting of wide local surgical resection, with or without prophylactic neck dissection. Only patients with a confirmed diagnosis of oral/lip carcinoma, complete clinical and pathological record, and sufficient amount of paraffin embedded material were included in the study. A written informed consent was obtained from each patient before surgery, and the study was approved by the Institutional Ethics Committee, in accordance with the Helsinki guideline. Fresh biopsies were collected after Helsinki approval was issued and informed consent form was signed.
Figure 2.
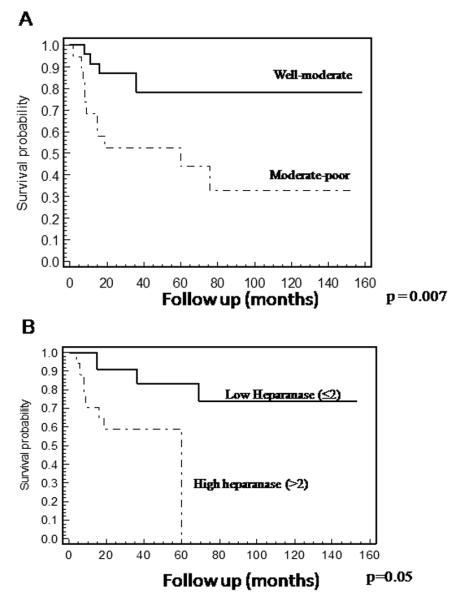
Patients’ survival. A. Overall survival curves of patients with oral cancer stratified by the tumor level of differentiation. Kaplan-Meier survival analysis revealed poor survival of patients with moderate-poorly differentiated tumors compared to those with well-moderate differentiated tumors. As expected, patients diagnosed with moderate-poorly differentiated tumors had a significantly poor prognosis (p=0.0072, Log-Rank) as compared to well-moderate differentiated tumors. Verrucous carcinomas were graded as well differentiated carcinomas. B. Overall survival curves of patients with oral cancer stratified by heparanase staining extent. Kaplan-Meier survival analysis revealed poor survival of patients expressing high levels of heparanase (>2). All patients exhibiting high heparanase staining (+3) died at the end of follow-up (median survival time 59.9 months, p = 0.0056, Log-Rank), while 74% of the patients exhibiting low heparanase staining (≤2), were still alive at the end of the follow-up period (median survival time not reached).
Real-time PCR
Fresh biopsies were collected from tumor lesions and adjacent normal-looking control tissue and total RNA was isolated with TRI Reagent according to the manufacturer’s (Sigma, St. Louis, MO) instructions. Half of the normal-looking tissues were sent for pathological analysis to confirm no evidence of malignancy or pre-malignancy. The second half was used as control. Real-time quantitative PCR analysis was carried out essentially as described 27. Briefly, the PCR reaction mix (20 μl) was composed of 10 μl of QPCR primer and probe labeled with 6FAM dye (Taqman, Applied Biosystems, Carlsbad, CA), 5 μl diluted cDNA (1:10), and 0.3 μM of each primer (final concentration). Large ribosomal protein (RPLPO) primers (Applied Biosystems) were used as a reference gene for total RNA normalization. The sense and antisense primers used for quantitative amplification of heparanase were: forward GGACTTGCACGACTAA, reverse CCGTACGTCAATTGAC.
Immunohistochemistry
Staining of formalin-fixed, paraffin-embedded 5 micron sections was performed essentially as described 10, 28-30. Briefly, slides were deparaffinized with xylene, rehydrated and endogenous peroxidase was quenched using 3% hydrogen peroxide in methanol. Slides were then subjected to antigen retrieval by boiling (20 min) in citrate buffer, pH 6, blocked with 10% normal goat serum and incubated with the primary antibodies [anti-heparanase 733 polyclonal antibody diluted 1:100, or anti-Ki67 monoclonal antibody (MIB-1; Dako)]. Anti-heparanase antibody (733) was raised in rabbits against a 15 amino acid peptide that maps at the N-terminus of the 50 kDa heparanase subunit and preferentially recognizes the active 8+50 kDa heterodimer vs. the 65 kDa latent proenzyme 31. Slides were then extensively washed with PBS containing 0.01% Triton-100 and incubated with a secondary reagent according to the manufacturer’s (Envision kit, Dako, Glostrup, Denmark) instructions. Following additional washes, color was developed with the AEC reagent (Sigma), sections were counterstained with hematoxylin and mounted, as described 28, 30. Slides were examined and scored by two expert pathologists blinded to the clinical data. The staining intensity and extent scores were assigned according to the following categories. Intensity: +1 = weak staining, +2 = moderate staining, +3= high staining intensity. Extent: +1 = staining of less than 15% of the cells, +2 = 15-50% of the cells, +3> 50% of the cells. Cellular localization of staining (cytoplasmic vs. nuclear) was also recorded. Specimens that were similarly incubated with pre-immune serum, or without the primary antibody, yielded no detectable staining.
Statistical analysis
Association between category groups was tested using the Chi-square or the Fisher exact test. Univariate association with survival and cause-specific survival were evaluated by Kaplan-Meier curves and tested using Log-Rank test. For the multivariate analysis of survival, the Cox’s proportional hazard test was used to detect independent parameters that affect patient survival and to estimate relevant odds ratio (OR) with 95% confidence interval. For statistical analyses, cases exhibiting low (+1 and +2) staining intensity and extent were combined and compared with cases diagnosed to bear high levels (+3) of heparanase. Two-tailed p values of 0.05 or less were considered to be statistically significant. The SPSS 16.0 software for windows (SPSS Inc. Chicago, Il) was used for the statistical analyses.
Results
In order to examine the expression levels of heparanase by oral carcinoma, we employed quantitative real-time PCR analysis. Total RNA was isolated from fresh biopsies obtained from the carcinoma lesions and from adjacent normal tissue, and heparanase expression was evaluated. Heparanase levels were increased 4.7-fold in average in the carcinoma lesion compared with adjacent normal tissue (Fig. 1A, p=0.03). A similar increase in heparanase levels was observed in oral carcinomas compared with benign oral lesions (including pre-malignant hyperplasia or hyperkeratosis and friction induced oral fibroma, Fig. 1B, p=0.04). Notably, no significant elevation in heparanase levels was observed between normal tissue adjacent to the carcinoma and benign tumors (p=0.14, not shown).
Figure 1.

Heparanase expression by oral cancer. A-B. Real-time PCR. A. Total RNA was isolated from fresh biopsies obtained from oral carcinoma lesions (■) and adjacent normal-looking control tissue (□). Heparanase expression was determined by real-time PCR analysis as described under ’Material and Methods’ and presented as fold-increase (±SE) in the carcinomas compared with control adjacent tissue set arbitrarily to a value of 1. B. Total RNA was isolated from benign (□) and malignant SCC (■) and heparanase expression was determined as above. C. Immunohistochemical analysis. Formalin-fixed, paraffin-embedded 5 μm sections of well-moderate SCC were subjected to immunostaining as described under ‘Materials and Methods’. Shown, are representative photomicrographs of heparanase staining diagnosed as low (+1, a), moderate (+2, b) and strong (+3, c) staining intensity. d-i. Staining localization. Nuclear staining, mostly seen in oral verrucous carcinoma, is shown in (f), while cytoplasmic localization prevails in SCC (i). Hematoxilin/eosin staining of verrucous carcinoma is shown in (d, e). These lesions are characterized by hyperkeratosis with a verruciform surface, wide and elongated rete ridges, and minimal cytological atypia. Hematoxilin/eosin staining of SCC is shown in (g, h). No detectable staining was noticed in control sections incubated with preimmune serum instead of the primary antibodies. Original magnification: A-C, F, I × 200; D, G × 50; E, H × 100.
In order to further investigate the expression levels and clinical significance of heparanase in oral carcinoma, a retrospective immunohistochemical study was performed including 50 oral cancer patients (34 males and 16 females). Clinical description of patients is presented in Table 1. Median age at diagnosis was 69.2 ± 8 years; the mean follow-up was 49.6 ± 9.2 months for the entire study and 63.45 ± 12.1 months for patients who are still alive. Lower lip and buccal carcinoma were the predominant sites (30% each), followed by carcinomas of the tongue, maxilla and floor of mouth (Table 1). Most patients had early disease, as indicated by the T (primary tumor) and N (nodal metastasis) staging criteria (Table 1).
Table 1.
Clinical description of patients
| Parameter | Patients [n (%)] |
|---|---|
| Site of tumor | |
| Lip (lower) | 15 (30) |
| Flore of mouse | 5 (10) |
| Buccal mucosa | 15 (30) |
| maxilla | 6 (12) |
| tongue | 7 (14) |
| other | 2 (4) |
| T stage | |
| T0-2 | 41 (82) |
| T3 | 9 (18) |
| T4 | 0 |
| N stage | |
| N0 | 41 (82) |
| N1 | 4 (8) |
| N2 | 5 (10) |
| N3-4 | 0 |
| Tumor differentiation | |
| Well | 25 (50) |
| Well-moderate | 3 (6) |
| moderate | 15 (30) |
| Moderate-poor | 5 (10) |
| poor | 2 (4) |
Expression of heparanase by oral carcinomas
All of the oral cancer biopsies were stained positively for heparanase, and were categorized according to the intensity and extent of staining. Weak heparanase staining (+1) (Fig. 1C, a) was detected in 20% (10/50) of the biopsies, moderate staining (+2) (Fig. 1C, b) was detected in 36% of the biopsies (18/50), and 44% (22/50) of the specimens exhibited a strong staining intensity for heparanase (+3) (Fig. 1C, c). Low heparanase extent (+1, staining of less than 15% of the cells) was detected in 20% (10/50) of the biopsies, moderate extent (+2, 15-50% of the cells) in 38% (19/50) of the biopsies, and high heparanase extent (+3, > 50% of the cells) was observed in 42% (21/50) of the biopsy specimens.
Heparanase staining intensity was found to be associated with the tumor level of differentiation (Table 2). Hence, low heparanase staining was found in 94% of the tumors diagnosed as well-moderate differentiation, whereas strong staining of heparanase was detected in 32% of the cases diagnosed as moderate-poorly differentiated tumors (Table 2; p=0.01). A similar correlation was found for the staining extent parameter (Table 2, p=0.01). This is emphasized given the correlation established between tumor differentiation level and the survival rate of oral carcinoma patients (Fig. 2A). Hence, patients exhibiting moderate-poorly differentiated carcinomas had poor prognosis compared with patients bearing well-moderate differentiation tumors (p=0.007; Fig. 2A).
Table 2.
Correlation between heparanase levels, cellular localization and tumor differentiation.
| Differentiation levels (%) | Total | P (Chi square) | ||
|---|---|---|---|---|
| Well-moderate | Moderate-poor | |||
| Heparanase intensity | ||||
| ≤2 | 32 (94) | 2 (6) | 34 | 0.01 |
| >2 | 11 (68) | 5 (32) | 16 | |
| Total | 43 | 7 | 50 | |
| Heparanase extent | ||||
| ≤2 | 28 (96) | 1 (4) | 29 | 0.01 |
| >2 | 15 (71) | 6 (29) | 21 | |
| Total | 43 | 7 | 50 | |
|
Heparanase
localization |
||||
| Cytoplasm | 11 (37) | 19 (63) | 30 | 0.0007 |
| Nucleus | 17 (85) | 3 (15) | 20 | |
| Total | 28 | 22 | 50 | |
Notably, high heparanase staining extent (>2) was associated with poor survival (p=0.005). We found that 74% of the patients exhibiting low staining extent of heparanase (≤2) were still alive at the end of the follow-up period, as opposed to the high heparanase staining group (>2) in which none of the patients survived by the end of the follow-up (Fig. 2B), suggesting that heparanase plays a role in oral cancer progression and patient’s outcome.
Cellular localization of heparanase associates with tumor grade and type
Careful examination of the immunostaining revealed a distinct cellular localization pattern of heparanase. In addition to the more commonly observed cytoplasmic staining (Fig. 2C, c), heparanase was noted also to assume nuclear localization (Fig. 2C, f). Heparanase cellular localization was significantly associated with the tumor level of differentiation (p=0.0007, Table 2). Accordingly, cytoplasmic localization prevailed in patients with moderate-poorly differentiated carcinomas (63%; Table 2), whereas nuclear localization of heparanase was observed in 85% of the patients with well-moderately differentiated carcinomas (Table 2). Nuclear localization of heparanase was also significantly associated with the tumor type. Notably, in all the biopsies diagnosed with oral verrucous carcinoma (Fig. 2C, d, e) heparanase staining was detected in the cell nucleus (Fig. 2C, f). In contrast, only 29% of the squamous cell carcinoma (SCC) biopsies exhibited nuclear localization of heparanase (p=0.001).
Heparanase staining and cellular localization correlate with Ki67 levels
In order to further reveal the significance of heparanase in oral carcinoma, heparanase staining and cellular localization was examined in relation to Ki67 as a measure for cell proliferation. Ki67 staining extent was found to be associated with tumor size. High extent of Ki67 staining (>2) was more frequent in large tumors (10/18, 56%) compared to low Ki67 staining extent (≤2) which was observed in 88% of the small tumors (28/32; Table 3; p=0.001), providing a clinical relevance for this parameter. Importantly, a significant association was found between the extent of Ki67 staining and heparanase cellular localization (p=0.03; Table 3). Clearly, cytoplasmic localization of heparanase was associated with high Ki67 extent, while nuclear heparanase correlated with low (≤2) Ki67 extent (Table 3), in agreement with favorable outcome of patients exhibiting nuclear localization of heparanase 10, 32.
Table 3.
Ki67 staining extent correlates with tumor size and heparanase cellular localization.
| Heparanase localization (%) | p | Tumor size (%) | p | |||
|---|---|---|---|---|---|---|
| Ki67 extent | Cyto. | Nuclear | 0.03 | <2.5 cm | >2.5 cm | 0.001 |
| <2 | 20 (51) | 19 (49) | 28 (88) | 4 (12) | ||
| >2 | 10 (90) | 1 (10) | 8 (44) | 10 (56) | ||
| Total | 30 | 20 | 36 | 14 | ||
Multivariate analysis was performed for demographic and pathological variables. The most significant factor affecting patients’ survival was the tumor level of differentiation (p=0.004, Hazard Ratio 5.2). When heparanase extent parameter was included, this variable was found to be the most significant and independent predictor of survival in oral cancer patients (p=0.02, Hazard Ratio=5.7). When only well-moderate differentiated carcinomas were included in the statistical analysis, we found that the survival rate of patients diagnosed to bear weak heparanase staining (≤2) was 76% while none of the patients that stained strongly (>2) for heparanase survived. Although this difference is clinically important, it was not found to be statistically significant (p = 0.1), likely due to the low number of cases in each group. Nevertheless, it suggests that heparanase expression is a critical determinant for survival of oral cancer patients.
Discussion
Apart of specific cell types (i.e., cytothtrophoblasts, keratinocytes, platelets, activated cells of the immune system), heparanase is hardly detected in normal epithelium 12. Applying real-time PCR (Fig. 1A, B) and immunohistochemical (Fig. 1C) analyses, the present study strongly supports previous reports documenting a significant increase in heparanase expression in various carcinomas and hematological malignancies 12-14, 24, 33. Notably, high levels of heparanase correlated with Ki67 staining extent (Table 3) and inversely correlated with the survival rates of oral cancer patients (Fig. 2B), depicting the clinical relevance of heparanase in oral cancer and positioning heparanase as a valid drug target. Recent studies performed on cultured cells and biopsy specimens, including head & neck carcinoma 10, indicated that heparanase also assumes nuclear localization. Nuclear localization of heparanase was demonstrated by cell fractionation, immunostaining and immunoblot analyses of cultured cells 34 and in tumor biopsies 32, 35. Notably, nuclear localization of heparanase correlated with sustained cellular differentiation and a favorable outcome in patients with esophageal 35, 36 and head & neck 10 carcinomas, and, as demonstrated here, for oral carcinoma (Table 2). Heparanase levels and cellular localization correlated with both the tumor level of differentiation (Table 2) and tumor type (verrucous vs. SCC). In the non-metastasizing verrucous carcinoma, heparanase exhibited nuclear localization (Fig. 2C f) in all cases, as opposed to SCC which expressed the heparanase protein in the cell cytoplasm in 71% of the biopsy specimens. While a role for nuclear heparanase in the regulation of gene expression and cell differentiation was suggested both in vitro and in vivo 32, 35-37, the mode of its translocation into the nucleus and the associated effect on gene expression, have not been elucidated. Transfection of MCF-7 breast carcinoma cells with a plasmid vector that targets heparanase exclusively into the nucleus induced the appearance of lipid droplets typical of differentiated mammary epithelial cells 37. This and other results further substantiate a role of heparanase in cellular differentiation, as also suggested by the presently observed preferential nuclear localization of heparanase in well differentiated vs. poorly differentiated SCC (Table 2). Heparanase was noted to translocate from the cytoplasm to the nucleus during esophageal cell differentiation, correlating with induction of keratinocyte differentiation markers such as p27 and involucrin. p27 and involucrin induction was significantly reduced upon inhibition of heparanase enzymatic activity 36, suggesting that HS degradation by heparanase directly affects gene expression, in agreement with previous studies demonstrating nuclear localization of HS 38, 39. Notably, appreciable degradation of heparan sulfate takes place at nearly physiological pH (i.e., pH 6.8-7.0) 40, well above the pH optimum of heparanase. Thus, the enzyme is capable of degrading HS in the nucleus, as in fact suggested by our studies with nuclear preparations (34; and data not shown).
HS has been associated with several functional roles within the nucleus, including suppression of gene transcription via inhibition of topoisomerase I and HAT activity 41, 42. HATs regulate gene expression by catalyzing acetylation of the N-terminus region of histones, thereby modifying chromatin structure in a manner that facilitates transcriptional activation 43. Decreased nuclear syndecan-1 following up-regulation of heparanase expression was recently reported 44, possibly leading to increased histone acetylation with an associated induction of gene transcription. It should be noted that both heparanase and syndecan-1 lack a characteristic nuclear localization signal 45 and thus may require a binding partner to shuttle into the nucleus. It has been recently speculated that heparanase acts as a master regulator of the aggressive tumor phenotype 19, 27. This is apparently accomplished via heparanase effects on multiple cell functions including gene expression. It is conceivable that heparanase regulation of gene expression may be related to its ability to inhibit accumulation of HSPGs within the nucleus 44. Thus, strategies to enhance nuclear HS levels may prove effective in blocking at least some of the heparanase-mediated effects that promote tumor growth and metastasis 44. Cell lines originating from verrucous carcinoma may serve as a good model system to study nuclear translocation of heparanase and its consequences in term of gene transcription and cellular differentiation.
Taken together, heparanase expression is induced in oral cancer as revealed by real-time PCR and immunohitochemical analyses. Immunohistochemical analysis identifies heparanase levels critical for oral cancer patients’ survival, likely due to enhanced Ki67 labeling as indicative of cell proliferation. Furthermore, by multivariate analysis, heparanase staining extent was found to be the most significant and independent predictor of survival in oral cancer. Heparanase levels and cellular localization may aid in the diagnosis of oral cancer patients, while heparanase inhibitors are hoped to advance future therapeutic modalities for cancer patients.
Acknowledgment
This work was supported by grants from the Israel Science Foundation (grant 549/06); National Cancer Institute (RO1-CA106456); and the Israel Cancer Fund (ICRF). I. Vlodavsky is a Research Professor of the ICRF. Y. Leiser is supported by the Israel Cancer Association and the Itay Sharon Rambam Atidim Fund for Academic Excellence.
Footnotes
The authors declare no conflict of interest
References
- 1.Horner MJRLKM, Neyman N, Aminou R, Howlader N, Altekruse SF, Feuer EJ, Huang L, Mariotto A, Miller BA, Lewis DR, Eisner MP, Stinchcomb DG, Edwards BK. SEER Cancer Statistics Review. National Cancer Institute. :1975–2006. [Google Scholar]
- 2.Cancer AJCo. AJCC Cancer Staging Manual. 5th Ed Lippincott-Raven; Philadelphia, PA: 1998. Lip and oral cavity. [Google Scholar]
- 3.Sargeran K, Murtomaa H, Safavi SM, Vehkalahti MM, Teronen O. Survival after diagnosis of cancer of the oral cavity. The British J Oral & Maxillofacial Sur. 2008;46:187–191. doi: 10.1016/j.bjoms.2007.11.004. [DOI] [PubMed] [Google Scholar]
- 4.Dempsey LA, Brunn GJ, Platt JL. Heparanase, a potential regulator of cell-matrix interactions. Trends Biochem Sci. 2000;25:349–351. doi: 10.1016/s0968-0004(00)01619-4. [DOI] [PubMed] [Google Scholar]
- 5.Parish CR, Freeman C, Hulett MD. Heparanase: a key enzyme involved in cell invasion. Biochim Biophys Acta. 2001;1471:M99–108. doi: 10.1016/s0304-419x(01)00017-8. [DOI] [PubMed] [Google Scholar]
- 6.Vlodavsky I, Friedmann Y. Molecular properties and involvement of heparanase in cancer metastasis and angiogenesis. J Clin Invest. 2001;108:341–347. doi: 10.1172/JCI13662. [DOI] [PMC free article] [PubMed] [Google Scholar]
- 7.Bernfield M, Gotte M, Park PW, et al. Functions of cell surface heparan sulfate proteoglycans. Annu Rev Biochem. 1999;68:729–777. doi: 10.1146/annurev.biochem.68.1.729. [DOI] [PubMed] [Google Scholar]
- 8.Iozzo RV. Basement membrane proteoglycans: from cellar to ceiling. Nat Rev Mol Cell Biol. 2005;6:646–656. doi: 10.1038/nrm1702. [DOI] [PubMed] [Google Scholar]
- 9.Ben-Izhak O, Kaplan-Cohen V, Ilan N, Gan S, Vlodavsky I, Nagler R. Heparanase expression in malignant salivary gland tumors inversely correlates with long-term survival. Neoplasia. 2006;8:879–884. doi: 10.1593/neo.06382. [DOI] [PMC free article] [PubMed] [Google Scholar]
- 10.Doweck I, Kaplan-Cohen V, Naroditsky I, Sabo E, Ilan N, Vlodavsky I. Heparanase localization and expression by head and neck cancer: correlation with tumor progression and patient survival. Neoplasia. 2006;8:1055–1061. doi: 10.1593/neo.06577. [DOI] [PMC free article] [PubMed] [Google Scholar]
- 11.Nagler R, Ben-Izhak O, Cohen-Kaplan V, et al. Heparanase up-regulation in tongue cancer: tissue and saliva analysis. Cancer. 2007;110:2732–2739. doi: 10.1002/cncr.23095. [DOI] [PubMed] [Google Scholar]
- 12.Ilan N, Elkin M, Vlodavsky I. Regulation, function and clinical significance of heparanase in cancer metastasis and angiogenesis. Int J Biochem Cell Biol. 2006;38:2018–2039. doi: 10.1016/j.biocel.2006.06.004. [DOI] [PubMed] [Google Scholar]
- 13.Vlodavsky I, Ilan N, Naggi A, Casu B. Heparanase: structure, biological functions, and inhibition by heparin-derived mimetics of heparan sulfate. Curr Pharm Des. 2007;13:2057–2073. doi: 10.2174/138161207781039742. [DOI] [PubMed] [Google Scholar]
- 14.Vreys V, David G. Mammalian heparanase: what is the message? J Cell Mol Med. 2007;11:427–452. doi: 10.1111/j.1582-4934.2007.00039.x. [DOI] [PMC free article] [PubMed] [Google Scholar]
- 15.Ferro V, Hammond E, Fairweather JK. The development of inhibitors of heparanase, a key enzyme involved in tumour metastasis, angiogenesis and inflammation. Mini Rev Med Chem. 2004;4:693–702. doi: 10.2174/1389557043403729. [DOI] [PubMed] [Google Scholar]
- 16.McKenzie EA. Heparanase: a target for drug discovery in cancer and inflammation. Br J Pharmacol. 2007;151:1–14. doi: 10.1038/sj.bjp.0707182. [DOI] [PMC free article] [PubMed] [Google Scholar]
- 17.Miao HQ, Liu H, Navarro E, Kussie P, Zhu Z. Development of heparanase inhibitors for anti-cancer therapy. Curr Med Chem. 2006;13:2101–2111. doi: 10.2174/092986706777935230. [DOI] [PubMed] [Google Scholar]
- 18.Nadir Y, Brenner B, Zetser A, et al. Heparanase induces tissue factor expression in vascular endothelial and cancer cells. J Thromb Haemost. 2006;4:2443–2451. doi: 10.1111/j.1538-7836.2006.02212.x. [DOI] [PubMed] [Google Scholar]
- 19.Purushothaman A, Chen L, Yang Y, Sanderson RD. Heparanase stimulation of protease expression implicates it as a master regulator of the aggressive tumor phenotype in myeloma. J Biol Chem. 2008;283:32628–32636. doi: 10.1074/jbc.M806266200. [DOI] [PMC free article] [PubMed] [Google Scholar]
- 20.Zetser A, Bashenko Y, Edovitsky E, Levy-Adam F, Vlodavsky I, Ilan N. Heparanase induces vascular endothelial growth factor expression: correlation with p38 phosphorylation levels and Src activation. Cancer Res. 2006;66:1455–1463. doi: 10.1158/0008-5472.CAN-05-1811. [DOI] [PubMed] [Google Scholar]
- 21.Shafat I, Ben-Barak A, Postovsky S, Elhasid R, Ilan N, Vlodavsky I, Ben Arush MW. Heparanase levels are elevated in the plasma of pediatric cancer patients and correlate with response to anticancer treatment. Neoplasia. 2007;9:909–916. doi: 10.1593/neo.07673. [DOI] [PMC free article] [PubMed] [Google Scholar]
- 22.Shafat I, Pode D, Peretz T, Ilan N, Vlodavsky I, Nisman B. Clinical significance of urine heparanase in bladder cancer progression. Neoplasia. 2008;10:125–130. doi: 10.1593/neo.07875. [DOI] [PMC free article] [PubMed] [Google Scholar]
- 23.Shafat I, Zcharia E, Nisman B, et al. An ELISA method for the detection and quantification of human heparanase. Biochem Biophys Res Commun. 2006;341:958–963. doi: 10.1016/j.bbrc.2006.01.048. [DOI] [PMC free article] [PubMed] [Google Scholar]
- 24.Yang Y, MacLeod V, Dai Y, et al. The syndecan-1 heparan sulfate proteoglycan is a viable target for myeloma therapy. Blood. 2007;110:2041–2048. doi: 10.1182/blood-2007-04-082495. [DOI] [PMC free article] [PubMed] [Google Scholar]
- 25.Edovitsky E, Elkin M, Zcharia E, Peretz T, Vlodavsky I. Heparanase Gene Silencing, Tumor Invasiveness, Angiogenesis, and Metastasis. J Natl Cancer Inst. 2004;96:1219–1230. doi: 10.1093/jnci/djh230. [DOI] [PubMed] [Google Scholar]
- 26.Lerner I, Baraz L, Pikarsky E, et al. Function of heparanase in prostate tumorigenesis: potential for therapy. Clin Cancer Res. 2008;14:668–676. doi: 10.1158/1078-0432.CCR-07-1866. [DOI] [PubMed] [Google Scholar]
- 27.Zcharia E, Jia J, Zhang X, et al. Newly generated heparanase knock-out mice unravel co-regulation of heparanase and matrix metalloproteinases. PLoS ONE. 2009;4:e5181. doi: 10.1371/journal.pone.0005181. [DOI] [PMC free article] [PubMed] [Google Scholar]
- 28.Cohen E, Doweck I, Naroditsky I, et al. Heparanase is overexpressed in lung cancer and correlates inversely with patient survival. Cancer. 2008;113:1004–1011. doi: 10.1002/cncr.23680. [DOI] [PMC free article] [PubMed] [Google Scholar]
- 29.Cohen-Kaplan V, Doweck I, Naroditsky I, Vlodavsky I, Ilan N. Heparanase augments epidermal growth factor receptor phosphorylation: correlation with head and neck tumor progression. Cancer Res. 2008;68:10077–10085. doi: 10.1158/0008-5472.CAN-08-2910. [DOI] [PMC free article] [PubMed] [Google Scholar]
- 30.Cohen-Kaplan V, Naroditsky I, Zetser A, Ilan N, Vlodavsky I, Doweck I. Heparanase induces VEGF C and facilitates tumor lymphangiogenesis. Int J Cancer. 2008;123:2566–2573. doi: 10.1002/ijc.23898. [DOI] [PMC free article] [PubMed] [Google Scholar]
- 31.Zetser A, Levy-Adam F, Kaplan V, et al. Processing and activation of latent heparanase occurs in lysosomes. J Cell Sci. 2004;117:2249–2258. doi: 10.1242/jcs.01068. [DOI] [PubMed] [Google Scholar]
- 32.Takaoka M, Naomoto Y, Ohkawa T, et al. Heparanase expression correlates with invasion and poor prognosis in gastric cancers. Lab Invest. 2003;83:613–622. doi: 10.1097/01.lab.0000067482.84946.bd. [DOI] [PubMed] [Google Scholar]
- 33.Sanderson RD, Yang Y, Suva LJ, Kelly T. Heparan sulfate proteoglycans and heparanase--partners in osteolytic tumor growth and metastasis. Matrix Biol. 2004;23:341–352. doi: 10.1016/j.matbio.2004.08.004. [DOI] [PubMed] [Google Scholar]
- 34.Schubert SY, Ilan N, Shushy M, Ben-Izhak O, Vlodavsky I, Goldshmidt O. Human heparanase nuclear localization and enzymatic activity. Lab Invest. 2004;84:535–544. doi: 10.1038/labinvest.3700084. [DOI] [PubMed] [Google Scholar]
- 35.Ohkawa T, Naomoto Y, Takaoka M, et al. Localization of heparanase in esophageal cancer cells: respective roles in prognosis and differentiation. Lab Invest. 2004;84:1289–1304. doi: 10.1038/labinvest.3700159. [DOI] [PubMed] [Google Scholar]
- 36.Kobayashi M, Naomoto Y, Nobuhisa T, et al. Heparanase regulates esophageal keratinocyte differentiation through nuclear translocation and heparan sulfate cleavage. Differentiation. 2006;74:235–243. doi: 10.1111/j.1432-0436.2006.00072.x. [DOI] [PubMed] [Google Scholar]
- 37.Nobuhisa T, Naomoto Y, Takaoka M, et al. Emergence of nuclear heparanase induces differentiation of human mammary cancer cells. Biochem Biophys Res Commun. 2005;331:175–180. doi: 10.1016/j.bbrc.2005.03.129. [DOI] [PubMed] [Google Scholar]
- 38.Liang Y, Haring M, Roughley PJ, Margolis RK, Margolis RU. Glypican and biglycan in the nuclei of neurons and glioma cells: presence of functional nuclear localization signals and dynamic changes in glypican during the cell cycle. J Cell Biol. 1997;139:851–864. doi: 10.1083/jcb.139.4.851. [DOI] [PMC free article] [PubMed] [Google Scholar]
- 39.Richardson T, Trinkaus-Randall V, Nugent M. Regulation of heparan sulfate proteoglycan nuclear localization by fibronectin. J Cell Sci. 2001;114:1613–1623. doi: 10.1242/jcs.114.9.1613. [DOI] [PubMed] [Google Scholar]
- 40.McKenzie E, Young K, Hircock M, et al. Biochemical characterization of active heterodimer form of human heparanase (Hpa1) protein expressed in insect cells. Biochemical J. 2003;373:423–435. doi: 10.1042/BJ20030318. [DOI] [PMC free article] [PubMed] [Google Scholar]
- 41.Buczek-Thomas JA, Hsia E, Rich CB, Foster JA, Nugent MA. Inhibition of histone acetyltransferase by glycosaminoglycans. J Cell Biochem. 2008;105:108–120. doi: 10.1002/jcb.21803. [DOI] [PMC free article] [PubMed] [Google Scholar]
- 42.Kovalszky I, Dudas J, Olah-Nagy J, et al. Inhibition of DNA topoisomerase I activity by heparan sulfate and modulation by basic fibroblast growth factor. Mol Cell Biochem. 1998;183:11–23. doi: 10.1023/a:1006898920637. [DOI] [PubMed] [Google Scholar]
- 43.Roth SY, Denu JM, Allis CD. Histone acetyltransferases. Annu Rev Biochem. 2001;70:81–120. doi: 10.1146/annurev.biochem.70.1.81. [DOI] [PubMed] [Google Scholar]
- 44.Chen L, Sanderson RD. Heparanase regulates levels of syndecan-1 in the nucleus. PLoS ONE. 2009;4:e4947. doi: 10.1371/journal.pone.0004947. [DOI] [PMC free article] [PubMed] [Google Scholar]
- 45.Mali M, Jaakkola P, Arvilommi AM, Jalkanen M. Sequence of human syndecan indicates a novel gene family of integral membrane proteoglycans. J Biol Chem. 1990;265:6884–6889. [PubMed] [Google Scholar]