Abstract
Several solutes (e.g., growth factors, cationic solutes, etc.) can reversibly bind to the extracellular matrix (ECM) of biological tissues. Binding interactions have significant implications on transport of such solutes through the ECM. In order to fully delineate transport phenomena in biological tissues, knowledge of binding kinetics is crucial. In this study, a new method for the simultaneous determination of solute anisotropic diffusivity and binding reaction rates was presented. The new technique was solely based on Fourier analysis of fluorescence recovery after photobleaching (FRAP) images.
Computer simulated FRAP tests were used to assess the sensitivity and the robustness of the method to experimental parameters, such as anisotropic solute diffusivity and rates of binding reaction.
The new method was applied to the determination of diffusivity and binding rates of 5-dodecanoylaminofluorescein (DAF) in bovine coccygeal annulus fibrosus (AF). Our findings indicate that DAF reversibly binds to the ECM of AF. In addition, it was found that DAF diffusion in AF is anisotropic. The results were in agreement with those reported in previous studies.
This study provides a new tool for the simultaneous determination of solute anisotropic diffusion tensor and rates of binding reaction that can be used to investigate diffusive-reactive transport in biological tissues and tissue engineered constructs.
Keywords: Diffusive-reactive transport, Effective diffusion, Confocal Laser Scanning Microscopy (CLSM), Fast Fourier Transform (FFT), 5-dodecanoylaminofluorescein (DAF), Annulus fibrosus (AF), Cartilage
INTRODUCTION
The investigation of the mechanisms of solute transport in the extracellular matrix (ECM) of biological tissues is crucial for understanding cell nutrition and biosynthetic activity, and for designing and fabricating tissue engineered constructs. Diffusion is a major transport mechanism for small solutes in avascular tissues (e.g., articular cartilage, intervertebral disc (IVD), etc.).33,50,51 Several studies characterized diffusive transport properties of solutes in cartilage,6,32,40,43,44, IVD (see reviews by Urban et al.(2004),52 Jackson and Gu (2009)19), ligaments,29 or menisci.47 Due to the unique morphology of these tissues, solute diffusion may be anisotropic.9,16,20,21,29,35,46,47 Moreover, for some molecules (e.g., growth factors, cationic solutes, etc.), transport can also involve reversible binding reactions with the ECM of the tissue.1,3,15,18,37,38 The modalities of solute-ECM binding depend on the chemical nature of the solute. It has been reported that rhodamine B base and tetramethylrhodamine (TMR), positively charged, bind to the negatively charged ECM of articular cartilage.1,37,38 Similar findings were reported by Inagawa and co-workers, who demonstrated that octaarginine, being a positively charged molecule, binds to the negatively charged glycosaminoglycans of cartilage ECM.18 In addition, experimental studies on desorption and diffusion of growth factors in bovine articular cartilage showed that IGF-I specifically binds to IGF-binding proteins (IGFBP) present in the ECM of cartilage tissue.3,15 Binding interactions can have significant implications on solute transport in biological tissues. For instance, Bhakta et al. (2000) and Garcia et al. (2003) reported that diffusive transport of IGF-I was dramatically slowed down by binding reactions with IGFBP present in the ECM of cartilage.3,15 Therefore, the knowledge of solute-ECM binding kinetics is crucial for fully understanding the mechanisms for molecular transport in tissues.
Currently, a few techniques are available to experimentally investigate solute binding in biological tissues. Arkill and Winlove (2008) used a fluorescence microscopy approach to detect the binding of rhodamine B to equine articular cartilage.1 This technique allowed the visualization of the areas of the tissue in which binding occurs. However, this method did not provide quantitative information about the binding rate of the solute to the tissue. Garcia et al. (2003) developed a technique, based on isotope-labeled IGF-I, for investigating the diffusive-reactive transport of IGF-I in bovine articular cartilage. The method, comprising two independent experiments, allowed the determination of IGF-I diffusivity and its binding rate to IGFBP present in the ECM of the tissue.15
Fluorescence recovery after photobleaching (FRAP) has become an established approach for determining molecular mobility in cells (see reviews by Meyvis et al. (1999),34 Reits and Neefjes (2001),39 Lippincott-Schwartz et al. (2003),31 Sprague and McNally (2005)41), as well as in biological tissues.26,27,28,29,45,46,47 In particular, several FRAP techniques have been proposed for the analysis of solute diffusive-reactive transport in living cells and in bulk solutions.4,5,7,8,10,13,22,23,24,25,30,42,49 These techniques are able to quantitatively determine both solute diffusivity and the binding reaction rates. However, these methods have only been developed for the case of isotropic diffusion.
The objective of this study was to develop a new FRAP method to simultaneously determine solute anisotropic diffusivity and binding reaction rates in a biological tissue. The technique was solely based on Fourier analysis of video-FRAP images. The accuracy and the robustness of the method were first assessed by numerically simulated FRAP experiments for a tissue with binding sites. The new technique was then applied to the simultaneous determination of the two-dimensional (2D) diffusion tensor and the binding reaction rates of 5-dodecanoylaminofluorescein (DAF) in bovine coccygeal annulus fibrosus (AF).
THEORETICAL BACKGROUND
In the following, it is assumed that diffusive-reactive fluorescence recovery is a two-dimensional (2D) anisotropic phenomenon occurring in the focal plane (x,y) of the microscope objective. It is also assumed that solute binding interactions with the tissue can be described by the Langmuir adsorption model: the free (i.e., mobile) fluorescent solute F can reversibly combine to an available (i.e., unoccupied) binding site S of the ECM of the tissue to generate an immobile fluorescent complex B. Since, during a FRAP experiment, the tissue can be considered in mechanical equilibrium (i.e., no deformations with respect to the initial configuration), the mass balances over the species F, S, and B read:
| (1.a) |
| (1.b) |
| (1.c) |
where cf, cs, and cb denote the molar concentrations of F, S, and B, respectively; D is the anisotropic diffusion tensor of the free solute, whose principal components are D’xx and D’yy; ka and kd are the rates of binding association and dissociation, respectively. In Equations (1.b) and (1.c), no diffusive terms are present, since both S and B are assumed to be attached to the ECM of the tissue. In addition, it has been assumed that binding reaction rates are isotropic (i.e., ka and kd do not depend on the orientation of F with respect to S). The set of Equations (1) can be further simplified by assuming that, during a FRAP experiment, the amount of available binding sites in the tissue is constant (cs = cso), since the act of bleaching only changes the number of visible fluorescent molecules (F or B) present in the sample. This assumption allows eliminating Equation (1.c), and also enables to replace the variable cs in Equations (1.a) and (1.b) with the constant cso. Furthermore, by defining the pseudo-rate of binding association as:42
| (2) |
Equations (1) can be rewritten as:42
| (3.a) |
| (3.b) |
Note that Equations (3) are similar to those presented by Crank (1975) for describing isotropic diffusive transport with first-order reversible reaction.11 By performing a dimensionless analysis of Equations (3), it can be shown that diffusive-reactive transport is essentially governed by two dimensionless numbers:42
| (4a) |
| (4b) |
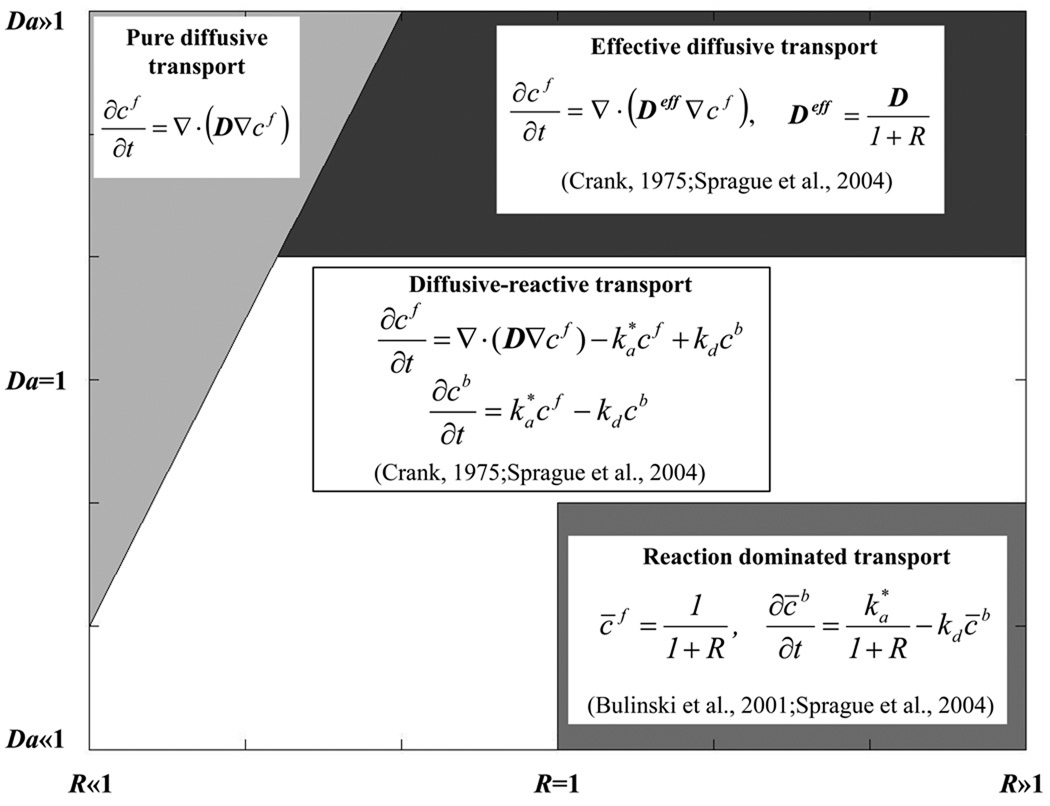
where d is a characteristic length (e.g., diameter of the bleach spot), and D is the characteristic diffusivity (e.g., the half of the trace of D), see Appendix 1 for details. For certain values of Da and R, diffusive-reactive fluorescence recovery can be approximated to idealized cases, such as: pure diffusive transport, effective diffusive transport, and reaction dominated transport (Figure 1). Briefly, pure diffusive transport is achieved when the rate of binding dissociation is sufficiently higher than the pseudo-rate of binding association (R≪1). In this condition, most of the fluorescent molecules are free and transported through the ECM of the tissue by diffusion. Effective diffusion arises when binding association is much faster than diffusion (Da≫1), so that, at any location, binding reactions rapidly achieve a local equilibrium. In this condition, molecular transport is regulated by a diffusion equation, whose diffusion coefficient, known as effective diffusion coefficient, is defined as:11,42
| (5) |
Figure 1.
Qualitative representation of diffusive-reactive transport regimes at different values of R and Da. The field equations for fluorescence recovery in the case of pure diffusion, effective diffusion, reaction dominated, and diffusive-reactive transport are shown.
In contrast, reaction dominated transport occurs when the rates of binding association and dissociation are comparable (R≥1), and diffusion is very fast compared to both the binding rate and to the timescale of the FRAP measurement (Da≪1). After bleaching, free molecules instantly equilibrate, so that diffusion cannot be detected during the FRAP test, and fluorescence recovery is only governed by the rates of binding association and dissociation.
A general solution for diffusive-reactive transport can be obtained by transforming and solving Equations (3) in the 2D Fourier space of frequencies (u,v), so that fluorescence recovery can be described by the following relation (see Appendix 2):
| (6) |
where I is the 2D Fourier transform of the fluorescence intensity of FRAP images, and A, B, λ1, and λ2 are related to the initial dimension of the bleach spot (d), the reaction rates k*a and kd, and D(ξ), which contains the components of D (see Appendix 2). Note that, in deriving Equation (6), it has been assumed that the intensity of the fluorescence emission of a FRAP image is proportional to the concentration of the fluorescent probe (free and bound). This assumption is experimentally met when the concentration of the fluorescent probe is not so high as to cause self-quenching of fluorescence.2 By curve-fitting the 2D Fourier transform of the intensity of the fluorescence emission of a time series of video-FRAP images with Equation (6), in principle, one can simultaneously determine the reaction rates k*a and kd, together with the components of D (see Appendices 2 and 3). However, due to the bi-exponential form of Equation (6), the values of solute diffusivity and reaction rates obtained by curve-fitting a single FRAP experiment may be non-unique.14 Therefore, to improve the uniqueness of the curve-fitting parameters, multiple FRAP experiments, characterized by different fluorescence recovery regimes, can be simultaneously curve-fitted (see Methods).
METHODS
In this study, numerically simulated FRAP experiments were used to validate the method proposed and to evaluate its sensitivity to experimental parameters, such as the anisotropic diffusion tensor and the binding rates. The technique was then applied to the experimental determination of anisotropic diffusivity and binding rates of 5-dodecanoylaminofluroescein in bovine coccygeal AF.
Computer simulations of FRAP tests
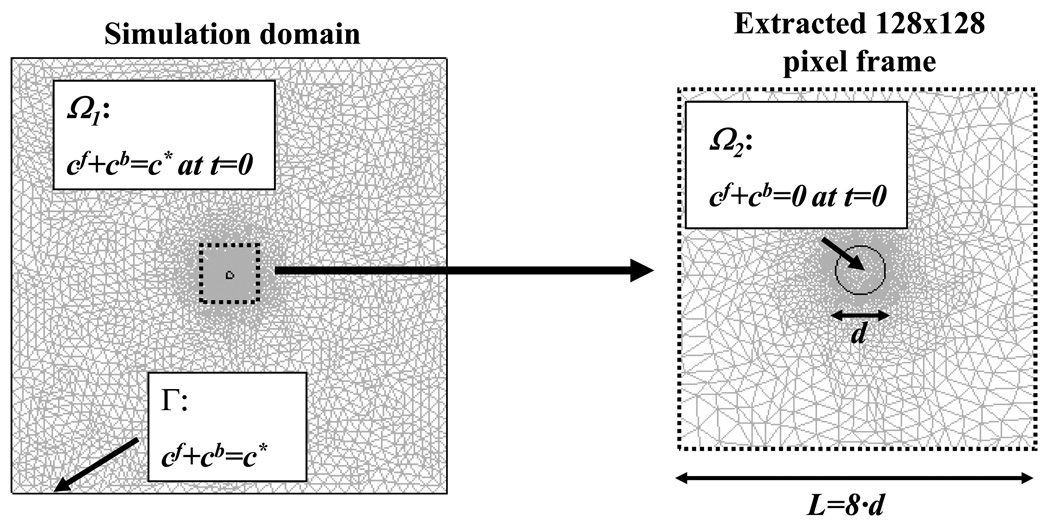
A finite element method package (COMSOL® 3.2, COMSOL Inc., Burlington, MA) was used to simulate 2D anisotropic diffusive-reactive fluorescence recovery after photobleaching. Initially (t=0), the fluorescent solute concentration (both free and bound) was assumed to be uniform (cf + cb = c*) within the sample (subdomain Ω1) and zero (cf + cb = 0) within the bleach spot (subdomain Ω2). At the boundaries (Γ) of the simulation domain (4×4 mm2), the concentration of the fluorescent probe was assumed to be constant (cf + cb = c*). For each of the cases investigated, fluorescence recovery was simulated over a time frame corresponding to 4 times the characteristic diffusive-reactive time τ (see Appendix 1). For data analysis purposes, a time series of 200 images (8-bit grey scale) of 128×128 pixels, representing the fluorescence recovery on the focal plane of the microscope objective, was extracted from the simulation domain (Figure 2). The physical dimension (L) of the series of FRAP images corresponded to 8 times the value of the initial diameter of the bleach spot (d) used in the simulations. The diffusive-reactive parameters and the dimensions of the bleach spots used in the simulated FRAP experiments are listed in Table 1.
Figure 2.
Mesh (8000 quadratic Lagrange triangular elements) and size of the simulation domain. The initial and boundary conditions are shown.
Table 1.
Range of parameters used in numerically simulated FRAP experiments.
| Pseudo-rate of binding association | k*a | 5·10−4–5·102 s−1 |
| Rate of binding dissociation | kd | 5·10−7–5·105 s−1 |
| Trace of diffusion tensor | tr(D)=D’xx+D’yy | 10−6 cm2s−1 |
| Anisotropic ratio | D’xx/D’yy | 1.5–3 |
| Initial diameter of bleach spot | d | 4–16 µm |
FRAP experiments on bovine disc
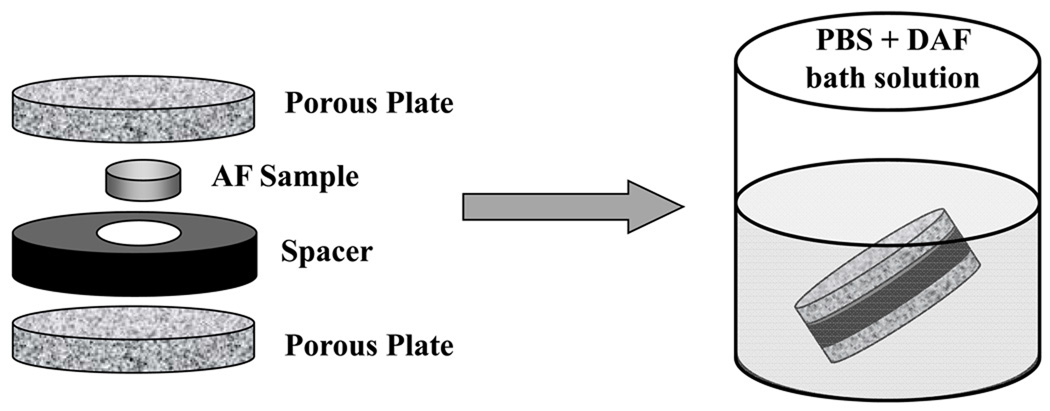
Blocks of AF tissue were harvested from a bovine coccygeal S2–S3 IVD. Eight cylindrical specimens (5 mm diameter, 270 µm thickness) were obtained from circumferential sections of AF blocks (Figure 3). The diffusive-reactive properties of 5-dodecanoylaminofluorescein (DAF) in the ECM of AF were investigated. Specimens were equilibrated in a PBS solution (pH = 7.4) with 0.1 mM DAF (529 Da, λex 485 nm; λem 535 nm, Molecular Probes, Inc., Eugene, OR) for 24 hours. In order to prevent swelling during equilibration, AF specimens were confined between two sinterized stainless steel plates (10 µm porosity) and an impermeable spacer,45,46 (Figure 3). Samples were removed from the holder and the bathing solution (Figure 3) prior to testing. A total of sixteen FRAP experiments (2 experiments on each specimen) were performed.
Figure 3.
Schematic of specimen preparation. (a) Orientation and the dimensions of the bovine AF sample. (b) Illustration of the protocol for specimen preparation.
Experiments were conducted at room temperature (22°C) with a confocal laser scanning microscope (LSM 510 Zeiss, Jena, Germany) using a Planar-Neofluar 20x/0.5 WD 2.0 objective (Zeiss), a 86 µm pinhole, and a 25mW argon laser (488nm wave length). For data analysis purposes (see Data Analysis), each FRAP experiment consisted of four consecutive cycles of photobleaching and recovery, performed in the same area of the sample. For each cycle of photobleaching and recovery, a different size of the bleach spot diameter (d) was used. More specifically, four values of d were used: d1=3.6 µm, d2=7.2 µm, d3=14.4 µm, and d4=28.8 µm. In each cycle, the size of the video-FRAP images was eight times the value of d used in photobleaching. A total of 200 frames (128×128 pixel), five of them before bleaching the sample, were collected in each cycle. The time delay between two consecutive frames was 0.1 seconds. The time delay between two consecutive cycles was sufficient for reaching complete fluorescence recovery within the sample. In order to prevent tissue dehydration during testing, samples were moisturized with DAF solution between two consecutive FRAP cycles. In addition, to avoid faster fluorescence recovery due to edge effects, photobleaching was always performed in the central portion of the sample surface (i.e., at more than 250 µm from the lateral edge of the sample). Furthermore, to minimize the diffusive flux in the z-direction (orthogonal to the focal plane of the microscope), a multi-layer bleaching (MLB) protocol, similar to that reported in our previous study,45 was adopted. Briefly, in each FRAP cycle, AF samples were sequentially photobleached at four different layers. The bleach spots were produced from top to bottom of the sample at 32, 27, 17, and 7 µm of distance from the glass slide carrying the specimen. Fluorescence recovery was observed in the lowest photobleached layer (i.e., at 7 µm from the glass slide). Using such MLB protocol, the accuracy in determining solute diffusivity was affected by a relative error below 20%.45
Data analysis
Both computer-simulated and experimental FRAP images were analyzed by a custom-made, MATLAB-based algorithm (MATLAB® Version 7.7.0.471 (R2008b), The MathWorks Inc., Natick, MA) based on Equation (6). Preliminary studies indicated that the accuracy of the technique in determining solute diffusivity and reaction rates significantly improved when multiple FRAP tests were simultaneously curve-fitted. Therefore, three different sets of computer-simulated FRAP images were obtained using the same set of diffusive-reactive parameters D, k*a, and kd, but three different initial sizes of the bleach spot (i.e. d1 = 4µm, d2 = 8µm, and d3 = 16µm). Let (u,v) be the Fourier transform of the light intensity of a FRAP image (i = 1, 2, …, 200) corresponding to the bleach spot size dj (j = 1, 2, 3), and Ii (p,u,v,dj) be the Fourier transform of the light intensity given by equation (6), where p = [D(ξ),k*a,kd] is the set of diffusion-reaction parameters to be determined. The simultaneous curve-fitting was performed using the Matlab® subroutine lsqcurvefit.m to determine p by minimizing the residual R(p,u,v) defined as:
| (7) |
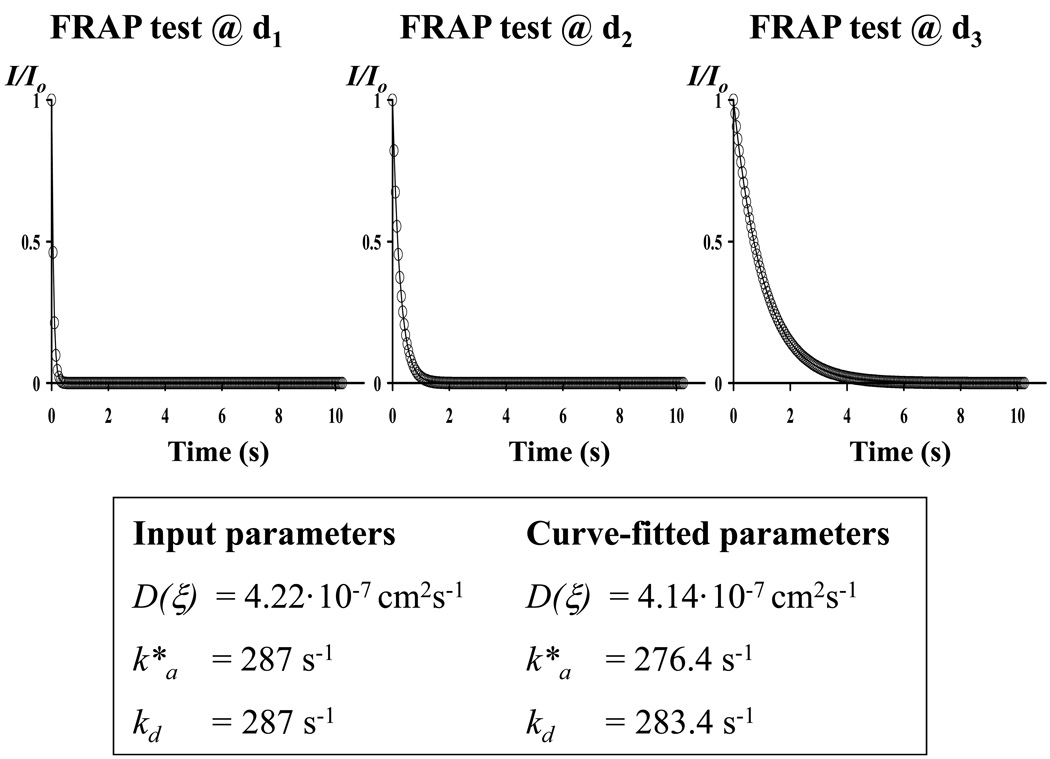
Note that the curve-fitting results (i.e., D(ξ), k*a, and kd) are in general dependent on the frequency couple (u,v) of the Fourier space. A representative simultaneous curve-fitting of three FRAP tests is reported in Figure 4b. Simultaneous curve-fittings were performed for frequency couples (u,v) belonging to ‘Ring 4’ of the Fourier space.47,48 Since binding reactions were assumed to be isotropic, the values of k*a, and kd were averaged over ‘Ring 4’. Finally, the principal components of D (i.e., D’xx and D’yy) were calculated from D(ξ) (see Appendices 2 and 3). A similar procedure of simultaneous curve-fitting was used for real FRAP experiments (using bleach spot sizes d1 = 3.6µm, d2 = 7.2µm, and d3 = 14.4µm) to determine k*a, kd, and D(ξ). Note that, the principal directions of solute diffusivity in circumferential sections of bovine AF were assumed to be oriented along the axial and the radial direction of the disc.20,21,45,47 Therefore, the principal components of D in AF were denoted as Daxi (along the axial direction) and Drad (along the radial direction).
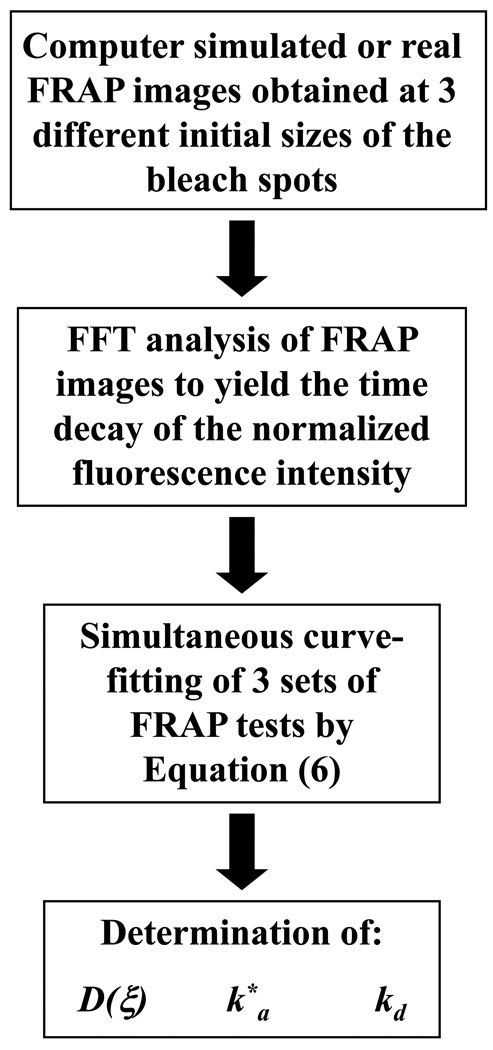
Figure 4.
(a) Schematic of the algorithm used for simultaneous curve-fitting of multiple FRAP experiments. (b) Representative simultaneous curve-fitting of the normalized fluorescence intensity decay of three FRAP experiments (open circles) with Equation (6) (solid line) to yield D(ξ), k*a, and kd. For the case reported in this figure, u = −4, v = 1, Dxx = 5·10−7 cm2s−1, Dxy = 1.667·10−7 cm2s−1, Dyy = 5·10−7 cm2s−1, Da = 500, and R = 1.
In order to verify the accuracy in determining solute diffusivity and reaction rates in bovine AF, additional FRAP experiments were performed to yield the solute effective diffusion tensor (Deff). Effective diffusive fluorescence recovery occurs for large values of Da (Figure 1). Since Da is proportional to the square of d (Equation (4)), in order to achieve a fluorescence recovery regime close to effective diffusion, FRAP experiments were conducted using the largest bleach spot (d4=28.8 µm). Photobleaching data were analyzed by a pure anisotropic diffusive (i.e., no binding reactions) model reported in a previous study,47 to yield the principal components of Deff along the axial (Daxieff) and the radial (Dradeff) directions of the AF. Note that, according to Equation (5), the principal components of Deff are related to Daxi and Drad as follows:
| (8a) |
| (8b) |
Statistical analysis
A paired t-test was performed using Excel Spreadsheet software (Microsoft® Office Excel 2003, Microsoft Corp., Seattle, WA) in order to determine if a statistically significant difference existed between the reaction rates (k*a and kd) of DAF in bovine AF. In addition, a paired t-test was also performed to check for statistical differences between Daxi and Drad, and between Daxieff and Dradeff.
RESULTS
Validation by computer-simulated FRAP tests
In order to evaluate the sensitivity and the robustness of the new method, first, FRAP experiments were simulated by inputting the values for D, k*a, and kd. Subsequently, the numerically simulated FRAP images were analyzed to output the values of the same quantities. The accuracy of the method was assessed by the relative error (ε), defined as:
| (9) |
The sensitivity of the new model was investigated for a 106–fold range of Da and R, both varying from 10−3 to 103. This was done by varying the experimental parameters used in the simulations, (Table 1). The values of Da and R were calculated via Equations (4). Note that, in determining Da from Equation (4a), the value of d was obtained by averaging the three bleach spot sizes used in the simulations (i.e. d1 = 4µm, d2 = 8µm, and d3 = 16µm), and the value of D was equal to the half of the trace of D (tr(D)=D’xx + D’yy).
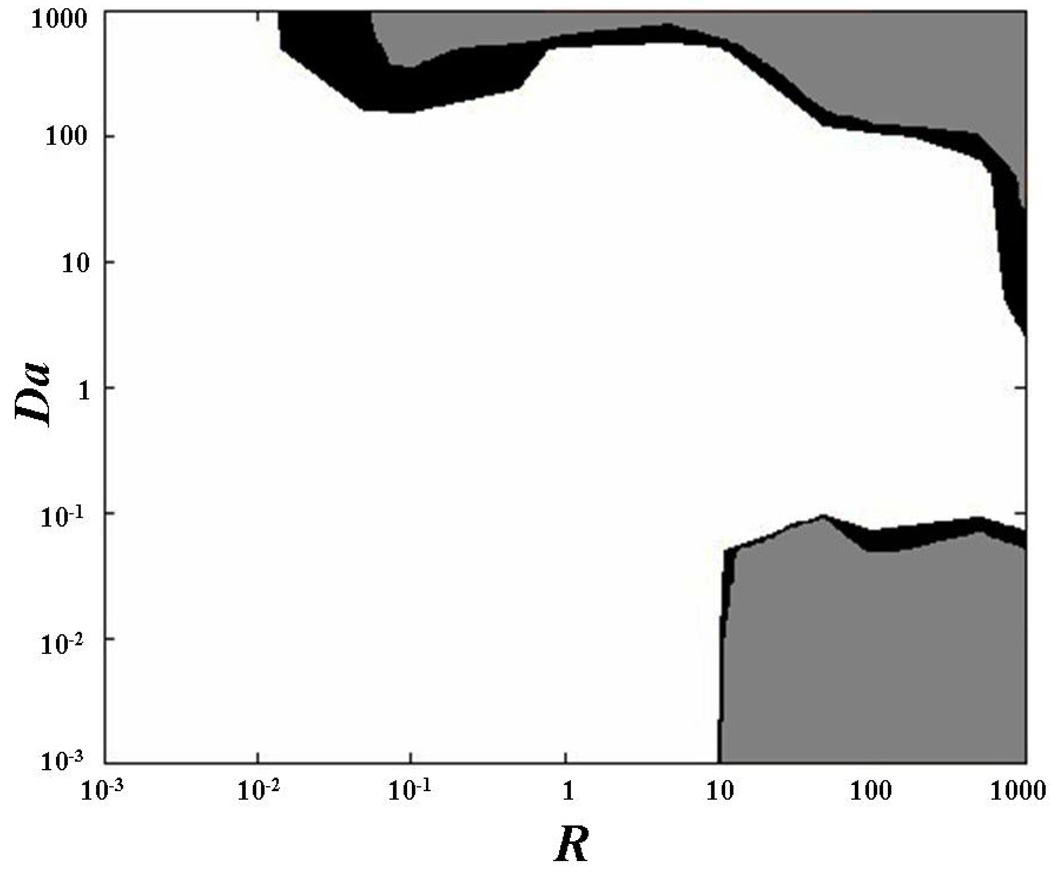
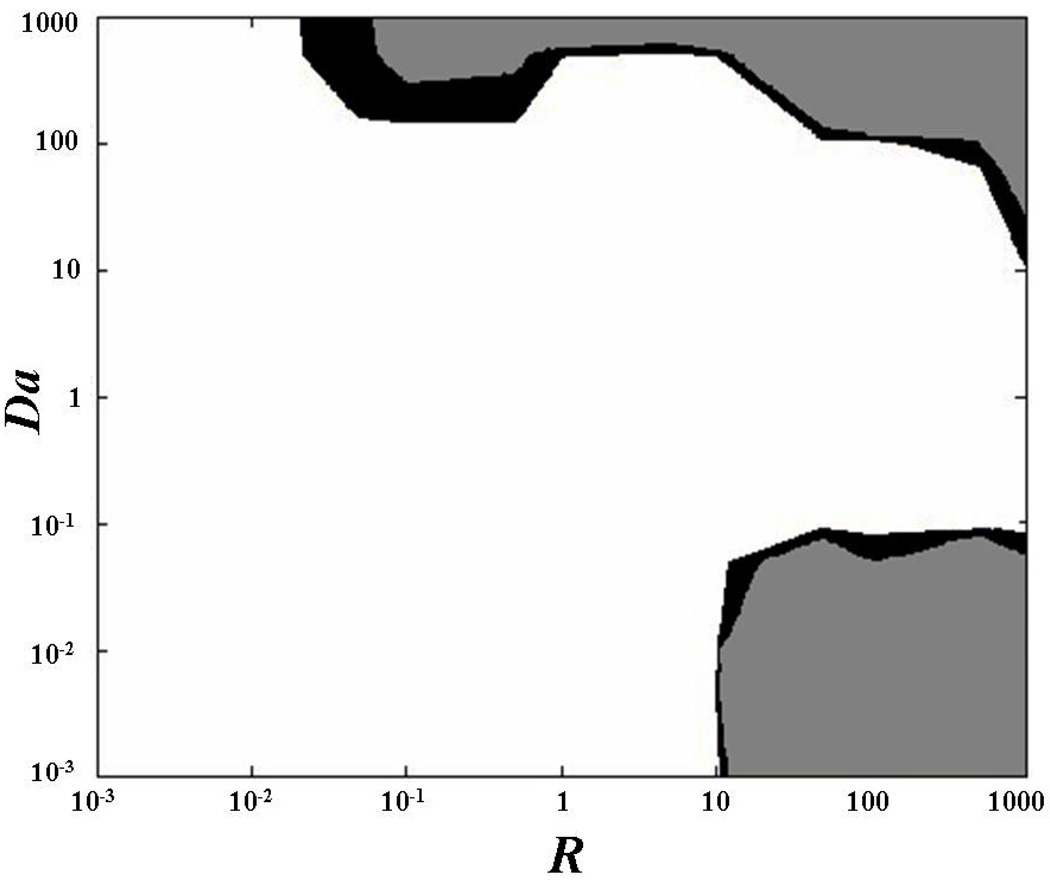
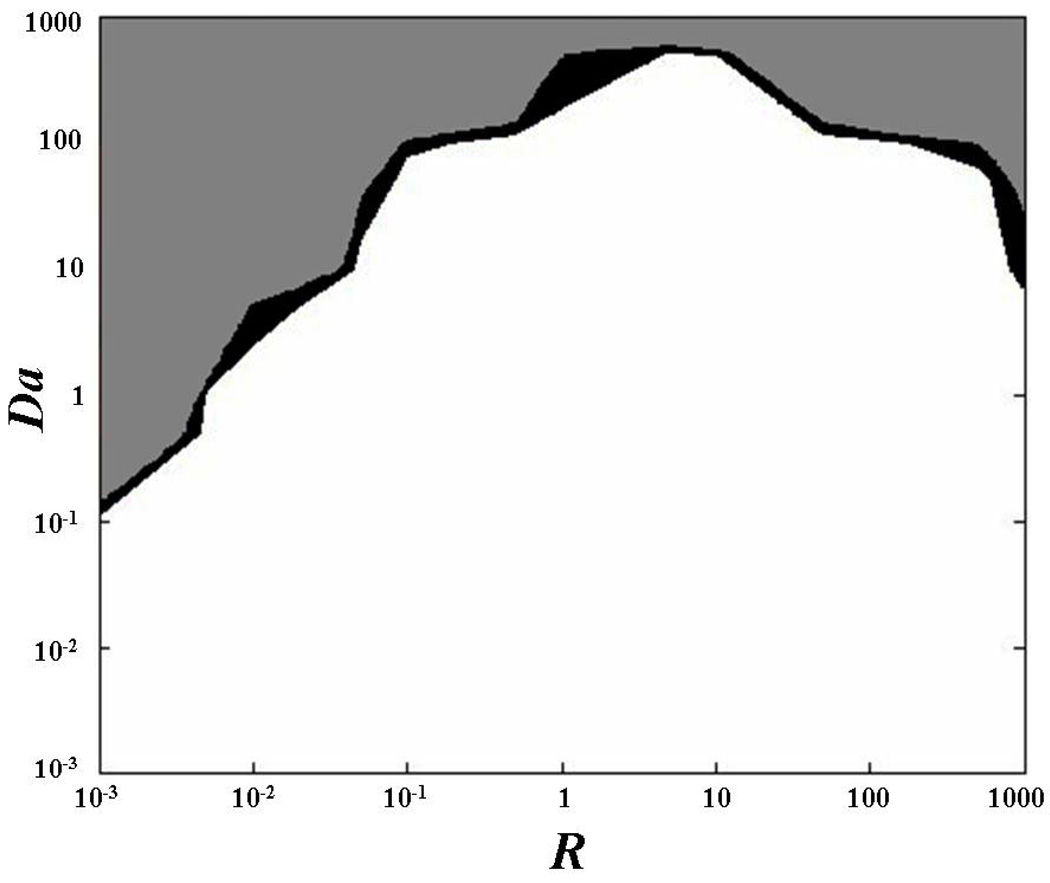
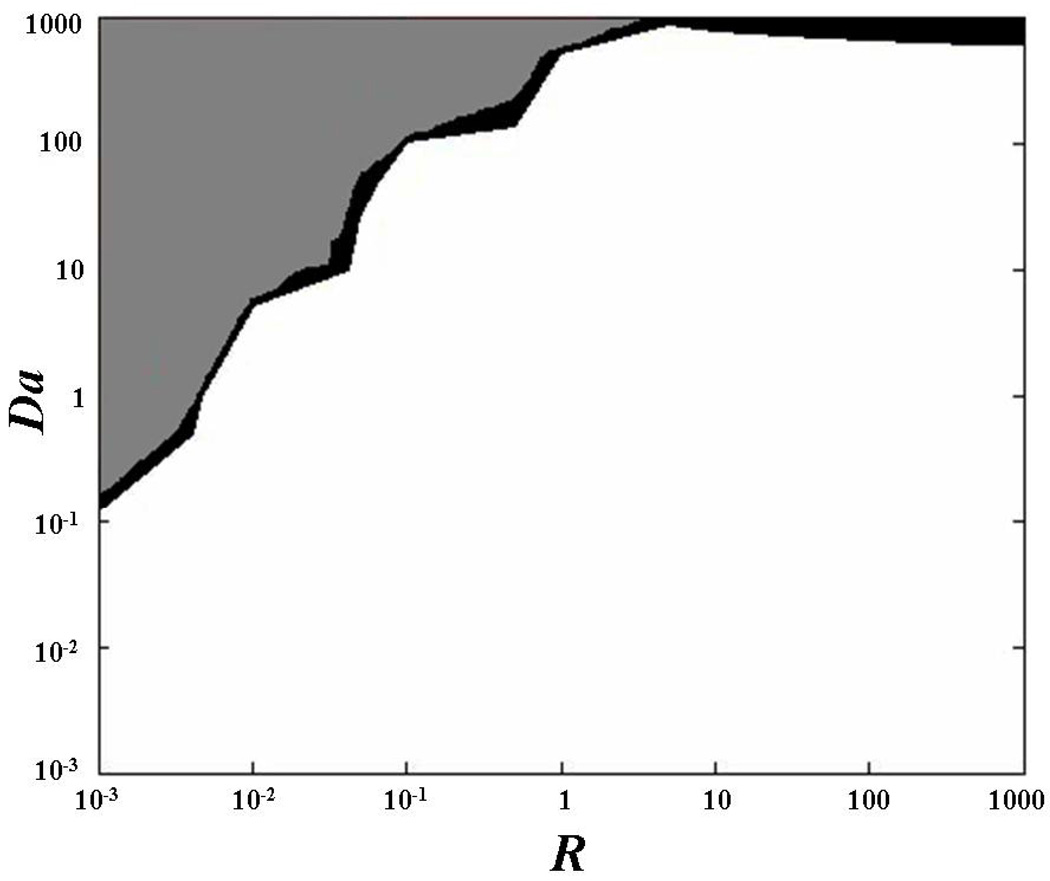
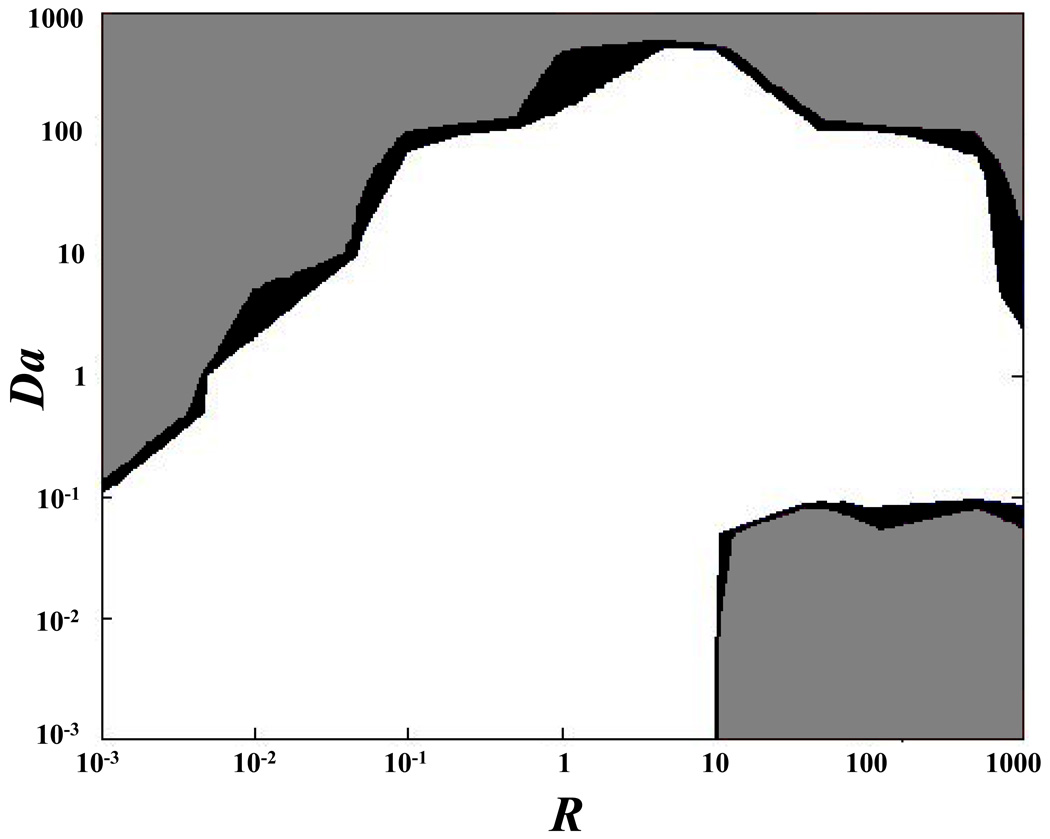
In this study, the sensitivity of the technique was investigated at three different anisotropic ratios, namely D’xx/D’yy = 1.5, 2, and 3. However, since the precision of the method was not significantly affected by the anisotropic ratio, only the data for the case of D’xx/D’yy = 2 were reported, (Figure 5). The accuracies in determining D’xx and D’yy were similar: the relative error was less than 2% for most cases investigated. Higher values of the relative error (ε > 5%) were found in two main regions of the plane (R,Da): when Da ≥ 100 and R ≥ 10, and when Da ≤ 10−1 and R ≥ 10, (Figure 5a–b). In determining k*a and kd, the value of ε was less than 2% for most of the cases investigated. Higher relative error (ε > 5%) was obtained when Da ≥ 100, and for couples of R and Da belonging to the upper-left corner in the plane (R,Da), (Figures 5c–d). The overlay of the relative errors in determining all the diffusive-reactive parameters is shown in Figure 5e.
Figure 5.
Determination of anisotropic diffusive-reactive parameters at various diffusive-reactive transport regimes. The areas of the contour plots indicate values of the relative error (ε) less than 2% (white), between 2 and 5% (black), and more than 5% (gray). (a) Determination of D’xx. (b) Determination of D’yy. (c) Determination of k*a. (d) Determination of kd. (e) Overlay of relative errors in determining all the diffusive-reactive parameters. For all the cases reported in this figure, tr(D) = 10−6 cm2s−1, and D’xx/D’yy = 2.
FRAP experiments on bovine disc
A total of 16 (n=16) FRAP experiments (2 tests on each specimen) were performed. Our results (mean ± standard deviation) indicated that transport of DAF was characterized by binding interactions with the ECM of AF. The values of k*a (0.12±0.04 s−1) and kd (0.07±0.01 s−1) were significantly different from each other (t-test, p<0.05). The diffusivities of DAF in the axial (Daxi = 3.9±1.43×10⁻⁷cm2s−1) and the radial (Drad = 2.7±1.16×10⁻⁷cm2s−1) directions were also statistically different (p<0.05). The values of R and Da corresponding to this set of experimental parameters were calculated via Equation (4). It was found that R = 1.75, and Da = 0.25. From the analysis of the additional fluorescence recovery experiments performed using the largest bleached spot (d4 = 28.8 µm), it was found that Daxieff and Dradeff were equal to 1.4±0.65×10⁻⁷cm2s−1 and 0.97±0.4×10⁻⁷cm2s−1 (p<0.05), respectively. A summary of the experimental results is reported in Table 2.
Table 2.
Diffusivity (10−7cm2s−1) and reaction rates (s−1) of DAF in bovine AF.
| n | Daxi | Drad | k*a | kd | Daxieff | Dradeff |
|---|---|---|---|---|---|---|
| 16 | 3.9±1.43 | 2.7±1.16 | 0.12±0.04 | 0.07±0.01 | 1.4±0.65 | 0.97±0.4 |
DISCUSSION AND CONCLUSIONS
In this study, we presented a new FRAP technique for the simultaneous determination of anisotropic solute diffusivity and binding reaction rates in biological tissues. The new method was first validated by computer simulated FRAP tests, and then applied to the simultaneous determination of the diffusive-reactive parameters of DAF in bovine coccygeal AF. Our FRAP experiments showed that DAF reversibly bound to the ECM of AF. We speculated that binding might occur due to the interaction between the amine group of DAF and the negatively charged glycosaminoglycans present in the ECM of the tissue. A similar binding mechanism has been proposed for octaarginine (positively charged) in articular cartilage.18 Note that the pH level of the disc is acidic,12 while the pH of the DAF solution used in our experiments was 7.4. Therefore, the rates of binding reactions reported in this study might differ from their corresponding values in physiological conditions. It was also found that DAF diffusion in bovine AF is anisotropic, with the diffusivity in the axial direction (Daxi) being higher than that in the radial direction (Drad), and the ratio of Daxi/Drad ~ 1.44 (Table 2). This finding is in agreement with previous studies on anisotropic solute diffusion in bovine AF, such as fluorescein (332 Da)45 and glucose.21 This anisotropic behavior is likely due to a unique feature of disc structure: microtubes, existing in AF, represent a preferential pathway for molecular transport, facilitating solute diffusion in the axial direction of the disc.17,46 This finding is also consistent with the notion that transport of nutrients and other molecules mainly occurs through cartilage endplate route.53 In addition, the values of R and Da governing fluorescence recovery of DAF were 1.75 and 0.25, respectively. Numerical simulations indicated that, for such values of R and Da, the accuracy of the method in determining the diffusive-reactive parameters is the highest (Figure 5e). In order to further validate the experimental measurements, the values of Daxi, Drad, k*a and kd were used to calculate the principal components of Deff (i.e., Daxieff and Dradeff) via Equations (8). It was found that Daxieff and Dradeff were equal to 1.42·10−7 and 0.98·10−7 cm2s−1, respectively. These results are consistent with those obtained by effective-diffusive fluorescence recovery experiments (Table 2).
Numerical simulations showed that the new method provided high accuracy in determining the principal components of D, k*a and kd for a wide range of experimental parameters used in this study (Figure 5e). However, the precision of the technique reduces when fluorescence recovery is predominantly governed by pure diffusion, by effective diffusion, or by reaction. For instance, in determining D’xx and D’yy, low accuracy was found in two main regions where R ≥ 10 and Da < 10−1, and where R ≥ 10 and Da ≥ 100, (Figure 5a–b). This is expected since, in the first region, fluorescence recovery is reaction dominated and, consequently, independent from solute diffusivity (Figure 1). In the second region, fluorescence recovery is governed by effective diffusion. In this transport regime, diffusivity and binding reaction rates are embedded in a single transport parameter (i.e., the effective diffusion tensor, see Equations (5)). Therefore, the curve-fitted results for D’xx, D’yy, k*a, and kd could be non-unique. This explains the low accuracy of the technique in determining D’xx and D’yy, k*a and kd in this region (Figure 5a–d). In addition, high relative error in determining k*a and kd was also found in the upper-left corner of the plane (R,Da), (Figure 5c–d). This is due to the fact that, in this region, fluorescence recovery is purely diffusive (Figure 1) and, consequently, independent from the rates of the binding reaction.
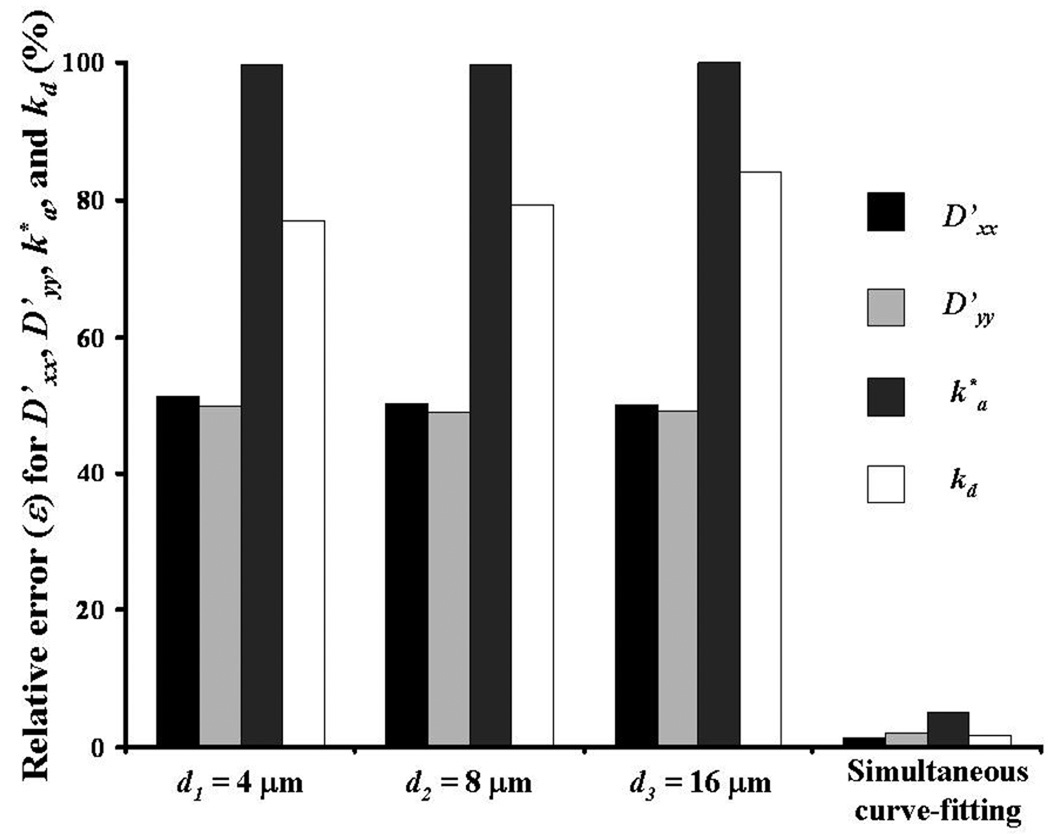
In this study, in order to improve the accuracy of the method for determining solute diffusivity and binding rates, a simultaneous analysis of multiple photobleaching data sets was performed. When a single FRAP experiment is analyzed, due to the bi-exponential form of Equation (6), curve-fit of diffusive-reactive parameters may be non-unique,14 see Figure 6. However, simultaneous analysis of FRAP experiments performed with three different initial sizes of the bleach spot (d), significantly improves the uniqueness of the curve-fitting parameters. This is because the three sets of photobleaching data, although sharing the same values of D, k*a, and kd, are characterized by different fluorescence recovery regimes (i.e., different values of Da corresponding to the different values of d used, see Equations (4)).
Figure 6.
Relative error (ε) in determining D’xx, D’yy, k*a, and kd at different initial diameters of the bleach spot (d). Data are compared to those obtained by simultaneous curve-fitting of three FRAP tests performed at d1 = 4µm, d2 = 8µm, and d3 = 16µm. For the case reported in this figure, tr(D) = 10−6 cm2s−1, D’xx/D’yy = 2, Da = 500, and R = 1. In curve-fitting the photobleaching data, the values of the initial guess parameters were set to two orders of magnitude off with respect to the input values.
Previous studies demonstrated that binding interactions may significantly reduce the rate of solute transport in the ECM of biological tissues.3,54 Besides, binding phenomena may also reduce the amount of free (unbound) solute transported in the tissue.54 Therefore, knowledge of solute diffusivity and binding rates is crucial for accurately describing the transport mechanisms of reactive molecules. In this study, we propose a novel experimental approach for simultaneous measurement of diffusive-reactive parameters. Compared to previous techniques (e.g., isotope labeling15), this FRAP method has the advantage that it is site-specific, and, therefore, able to detect local variations of transport properties in non-homogeneous tissues (e.g., IVD). Compared to our previous FRAP technique,47 the current approach presents a major innovation: while the previous method only allowed the determination of the anisotropic solute diffusivity (D), this technique is capable of simultaneously estimating D and the reaction rates. Besides, in Travascio et al. (2009), the principal components of D were calculated by combining two image analyses: the Fourier Transform of video-FRAP image series and the Karhunen-Loéve Transform (KLT). In contrast, this new method is solely based on Fourier analysis (see Appendix 3), avoiding the limitations imposed by the use of KLT in FRAP experiments.47
Although this technique was applied to characterize DAF transport in bovine AF, in principle, it could be used for any biological system. However, the size of the sample might represent a limitation for the application of this method. In order to successfully perform multiple curve-fitting, the initial sizes of the bleach spots must differ from one another as much as possible. Therefore, if the dimension of the sample is limited (e.g., cell cytoplasm), the range of variation of the bleach spot size is also limited, reducing the accuracy of the method.
In summary, we have developed a new FRAP technique for the simultaneous determination of diffusivity and binding rates of solutes in biological tissues. The method is based on the simultaneous analysis of multiple FRAP experiments obtained by varying the initial diameter of the bleach spots. Numerical simulated FRAP experiments have been used to evaluate the sensitivity and the robustness of the method at different diffusive-reactive fluorescence recovery regimes. In addition, the method has been successfully applied to the characterization of diffusivity and binding reaction rates of 5-dodecanoylaminofluorescein with the ECM of bovine AF. This new technique provides a useful tool for investigating molecular transport in biological tissues.
ACKNOWLEDGMENTS
This project was supported by the grants from the National Institute of Arthritis, Musculoskeletal and Skin Diseases (AR050609) and the National Institute of Biomedical Imaging and Bioengineering (EB008653).
APPENDIX
1. Dimensionless analysis of the field equations for diffusive-reactive transport
Hereby, for the sake of simplicity, the ideal case of isotropic diffusive-reactive fluorescence recovery is considered. The extension of this analysis to the more general case of anisotropic diffusion can be easily derived.
In the case of isotropic diffusive-reactive transport, recovery of fluorescence intensity within the images is controlled by four parameters: the diffusion coefficient D, the pseudo-rate of binding association k*a, the rate of binding dissociation kd, and the initial diameter of the bleach spot (d). Let Da and R be two dimensionless numbers defined as:42
| (4a) |
| (4b) |
The number Da represents the ratio of the diffusion time to the characteristic time of binding association, and, therefore, has the physical meaning of the Damkhöler number.36 The number R represents the ratio of the characteristic time of binding dissociation to that of binding association. Let d be the characteristic length and τ the characteristic time of the diffusive-reactive process, defined as:
| (A.1) |
Equations (3) can be rewritten in the following dimensionless form:
| (A.2a) |
| (A.2b) |
where c̄f and c̄b are the concentrations of free and bound solutes normalized by the total pre-bleach concentration of fluorescent solute; t̂ (defined as t̂ = t/τ) and ∇̂2 (defined as ∇̂2 = ∇2 ·d2) are the dimensionless time and the dimensionless Laplacian operator, respectively. Equations (A.2) indicate that the two dimensionless numbers, Da and R, govern the diffusive-reactive fluorescence recovery.
2. Solution of the diffusion-reaction equations in the Fourier space
The system of Equations (3) is transformed in the 2D Fourier space defined by the dimensionless frequencies (u,v):
| (A.3a) |
| (A.3b) |
where Cf and Cb are the 2D Fourier transforms of the concentrations of free and bound solutes, normalized with respect to the pre-bleach total concentration of solute (free + bound); L is the dimension of the video-FRAP image, corresponding to 8 times the value of the initial diameter of the bleach spot (d) used in the experiments. The function D(ξ), defined as:47
| (A.4) |
with
| (A.5) |
includes the components of the 2D diffusion tensor D (i.e., Dxx, Dxy, and Dyy). Assuming that, before bleaching (t=0), the system is at equilibrium (both dCf/dt and dCb/dt equal zero), from Equations (A.3b) we have:
| (A.6) |
Since Cf(u,v,0) + Cb(u,v,0) = 1, it follows that:
| (A.7a) |
| (A.7b) |
Equations (A.7) represent the initial conditions for Equations (A.3). Note that, in the Fourier space, the intensity of the fluorescence emission is proportional to the total concentration of the fluorescent solute (C=Cf+Cb) according to the following relationship:2
| (A.8) |
Combining the solution of Equations (A.3) with (A.8), it follows that:
| (A.9) |
where:
| (A.10a) |
| (A.10b) |
| (A.10c) |
| (A.10d) |
| (A.10e) |
| (A.10f) |
| (A.10g) |
| (A.10h) |
Curve-fitting the 2D Fourier transform of the fluorescence emission of a video-FRAP image series with (A.9) yields the binding rates k*a and kd, together with D(ξ).
3. Determination of the principal components of the 2D anisotropic diffusion tensor
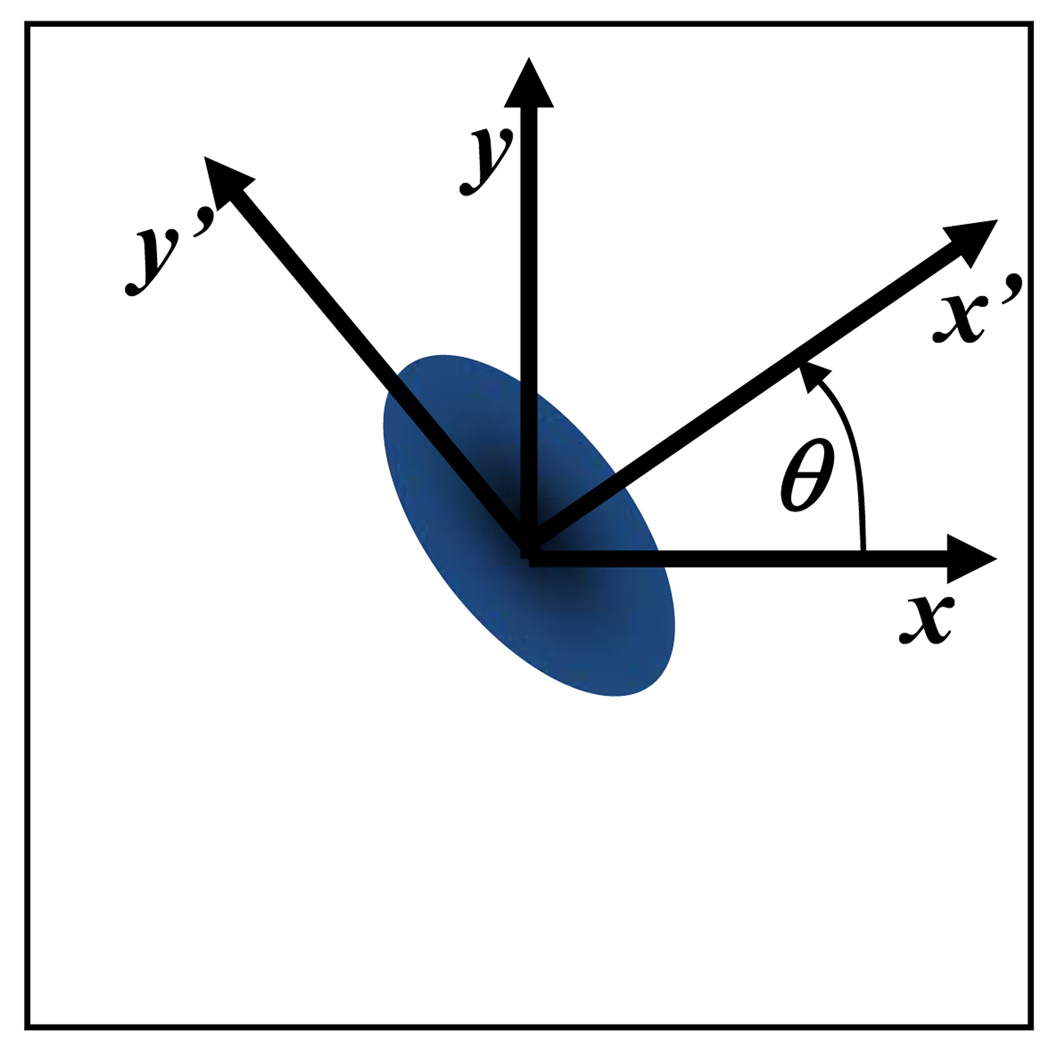
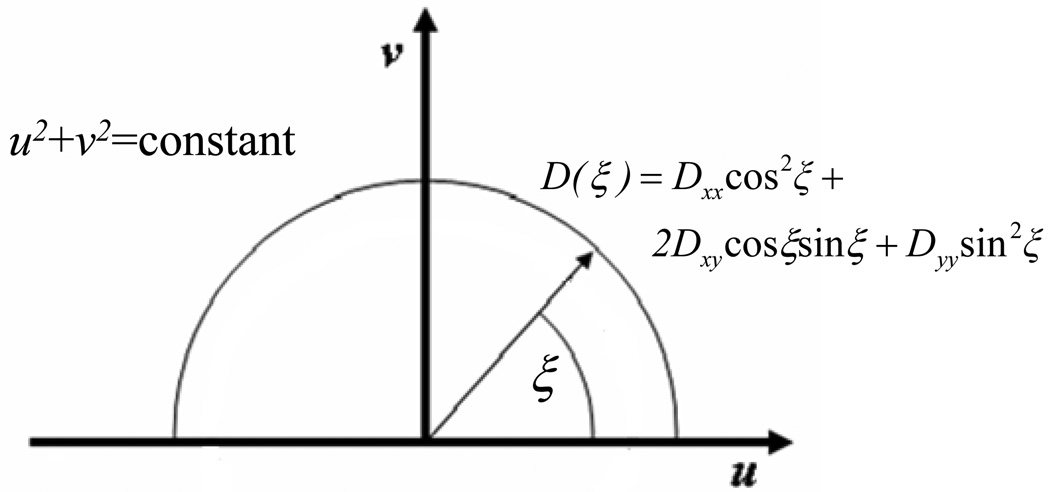
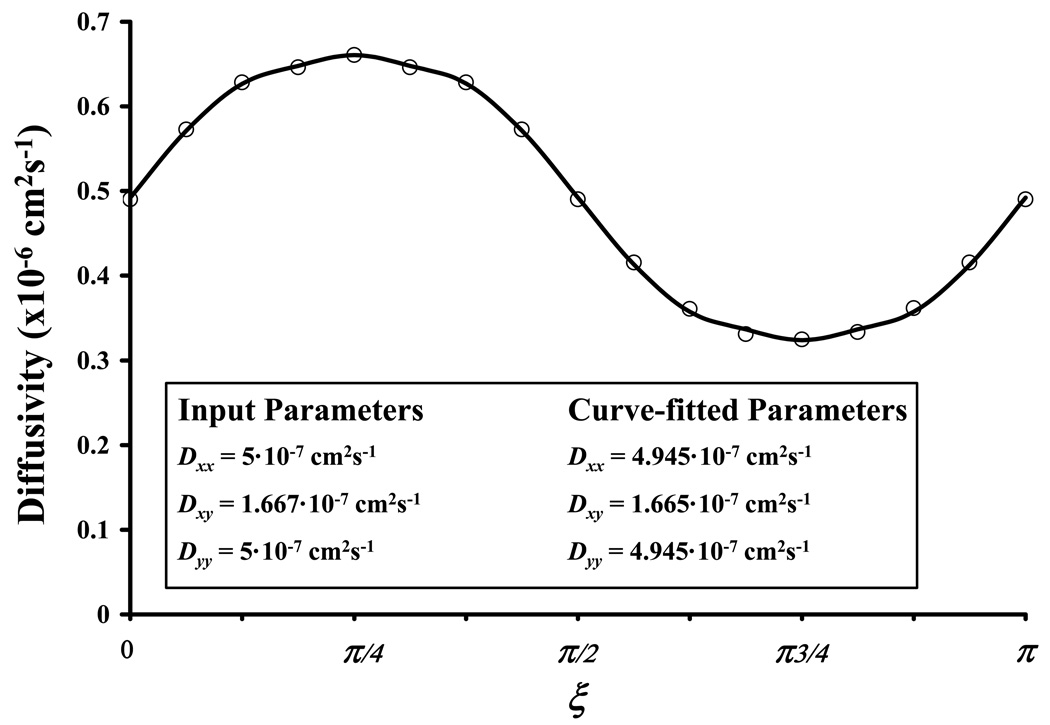
Let (x,y) stand for the fixed coordinate system of the microscope and (x’,y’) be the principal directions of D (i.e., material coordinate system), see Figure 7a. The components of D in the fixed coordinate system (i.e., Dxx, Dxy, and Dyy) are calculated by curve-fitting the experimental values of D(ξ), estimated at points (u,v) describing an arc of circumference (u2+v2=constant) in the Fourier space spanning from 0 to π, with Equation (A.4) (Figure 7b–c). The components Dxx, Dxy, and Dyy are related to the principal components of D (D’xx and D’yy) by the following relationship:
| (A.11) |
where θ is the orientation of the principal directions of D with respect to (x,y) (Figure 7a). It follows that:
| (A.12a) |
| (A.12b) |
| (A.12c) |
Figure 7.
(a) The orientation of the material coordinate system (x’,y’) with respect to the fixed coordinate system (x,y) is θ. (b) D(ξ) is defined over an arc of circumference (u2+v2=constant) in the Fourier space spanning from 0 to π. (c) Representative curve-fitting of the values of D(ξ) (open circles) with Equation (A.4) (solid line) to yield Dxx, Dxy, and Dyy. Note that D(ξ) was determined by curve-fitting of computer-simulated FRAP data (Dxx = 5·10−7 cm2s−1, Dxy = 1.667·10−7 cm2s−1, Dyy = 5·10−7 cm2s−1, Da = 500, and R = 1) with Equation (6).
REFERENCE
- 1.Arkill KP, Winlove CP. Solute transport in deep and calcified zones of articular cartilage. Osteoarthritis and Cartilage. 2008;13:708–714. doi: 10.1016/j.joca.2007.10.001. [DOI] [PubMed] [Google Scholar]
- 2.Berk DA, Yuan F, Leunig M, Jain RK. Fluorescence photobleaching with spatial Fourier analysis: measurement of diffusion in light-scattering media. Biophys.J. 1993;65:2428–2436. doi: 10.1016/S0006-3495(93)81326-2. [DOI] [PMC free article] [PubMed] [Google Scholar]
- 3.Bhakta NR, Garcia AM, Frank EH, Grodzinsky AJ, Morales TI. The insulin-like growth factors (IGFs) I and II bind to articular cartilage via the IGF-binding proteins. J Biol.Chem. 2000;275:5860–5866. doi: 10.1074/jbc.275.8.5860. [DOI] [PubMed] [Google Scholar]
- 4.Braga J, McNally JG, Carmo-Fonseca M. A reaction-diffusion model to study RNA motion by quantitative fluorescence recovery after photobleaching. Biophysical Journal. 2007;92:2694–2703. doi: 10.1529/biophysj.106.096693. [DOI] [PMC free article] [PubMed] [Google Scholar]
- 5.Bulinski JC, Odde DJ, Howell BJ, Salmon TD, Waterman-Storer CM. Rapid dynamics of the microtube binding of ensconsin in vivo. Journal of Cell Science. 2001;114:3885–3897. doi: 10.1242/jcs.114.21.3885. [DOI] [PubMed] [Google Scholar]
- 6.Burstein D, Gray ML, Hartman AL, Gipe R, Foy BD. Diffusion of small solutes in cartilage as measured by nuclear magnetic resonance (NMR) spectroscopy and imaging. J Orthop Res. 1993;11:465–478. doi: 10.1002/jor.1100110402. [DOI] [PubMed] [Google Scholar]
- 7.Carrero G, Crawford E, Hendzel MJ, de Vries G. Characterizing fluorescence recovery curves for nuclear proteins undergoing binding events. Bull Math Biol. 2004;66:1515–1545. doi: 10.1016/j.bulm.2004.02.005. [DOI] [PubMed] [Google Scholar]
- 8.Carrero G, McDonald D, Crawford E, de Vries G, Hendzel MJ. Using FRAP and mathematical modeling to determine the in vivo kinetics of nuclear proteins. Methods. 2003;29:14–28. doi: 10.1016/s1046-2023(02)00288-8. [DOI] [PubMed] [Google Scholar]
- 9.Chiu EJ, Newitt DC, Segal MR, Hu SS, Lotz JC, Majumdar S. Magnetic resonance imaging measurement of relaxation and water diffusion in the human lumbar intervertebral disc under compression in vitro. Spine. 2001;26:E437–E444. doi: 10.1097/00007632-200110010-00017. [DOI] [PubMed] [Google Scholar]
- 10.Coscoy S, Waharte F, Gautreau A, Martin M, Louverd D, Mangeat P, Arpin M, Amblard F. Molecular analysis of microscopic ezrin dynamics by two-photon FRAP. Proceedings of the National Academy of Science. 2002;99:12813–12818. doi: 10.1073/pnas.192084599. [DOI] [PMC free article] [PubMed] [Google Scholar]
- 11.Crank J. The mathematics of diffusion. New York: Oxford University Press Inc.; 1975. Diffusion and chemical reaction; pp. 338–340. [Google Scholar]
- 12.Diamant B, Karlsson J, Nachemeson A. Correlation between lactate levels and pH in discs of patients with lumbar rhizopathies. Experientia. 1968;24:1195–1196. doi: 10.1007/BF02146615. [DOI] [PubMed] [Google Scholar]
- 13.Dundr M, Hoffmann-Rohrer U, Hu Q, Grummt I, Rothblum LI, Phair RD, Misteli T. A kinetic framework for a mammalian RNA polymerase in vivo. Science. 2002;298:1623–1626. doi: 10.1126/science.1076164. [DOI] [PubMed] [Google Scholar]
- 14.Fung YC. Biomechanics: Mechanical Properties of Living Tissues. New York: Springer-Verlag New York, Inc.; 1993. Quasi-linear viscoelasticity of soft tissues; pp. 279–280. [Google Scholar]
- 15.Garcia AM, Szasz N, Trippel SB, Morales TI, Grodzinsky AJ, Frank EH. Transport and binding of insulin-like growth factor I through articular cartilage. Archives of Biochemistry and Biophysics. 2003;415:69–79. doi: 10.1016/s0003-9861(03)00215-7. [DOI] [PubMed] [Google Scholar]
- 16.Hsu EW, Setton LA. Diffusion tensor microscopy of the intervertebral disc anulus fibrosus. Magn Reson.Med. 1999;41:992–999. doi: 10.1002/(sici)1522-2594(199905)41:5<992::aid-mrm19>3.0.co;2-y. [DOI] [PubMed] [Google Scholar]
- 17.Iatridis JC, ap Gwynn I. Mechanisms for mechanical damage in the intervertebral disc annulus fibrosus. J Biomech. 2004;37:1165–1175. doi: 10.1016/j.jbiomech.2003.12.026. [DOI] [PMC free article] [PubMed] [Google Scholar]
- 18.Inagawa K, Oohashi T, Nishida K, Minaguchi J, Tsubakishita T, Yaykasli KO, Ohtsuka A, Ozaki T, Moriguchi T, Ninomiya Y. Optical imaging of mouse articular cartilage using the glycosaminoglycans binding property of fluorescent-labeled octaarginine. Osteoarthritis and Cartilage. 2009;17:1209–1218. doi: 10.1016/j.joca.2009.03.010. [DOI] [PubMed] [Google Scholar]
- 19.Jackson AR, Gu WY. Transport properties of cartilaginous tissues. Current Rheumatology Reviews. 2009;5:40–50. doi: 10.2174/157339709787315320. [DOI] [PMC free article] [PubMed] [Google Scholar]
- 20.Jackson AR, Yao H, Brown MD, Gu WY. Anisotropic ion diffusivity in intervertebral disc: an electrical conductivity approach. Spine. 2006;31:2783–2789. doi: 10.1097/01.brs.0000245842.02717.1b. [DOI] [PubMed] [Google Scholar]
- 21.Jackson AR, Yuan TY, Huang CY, Travascio F, Gu WY. Effect of compression and anisotropy on the diffusion of glucose in annulus fibrosus. Spine. 2008;33:1–7. doi: 10.1097/BRS.0b013e31815e4136. [DOI] [PMC free article] [PubMed] [Google Scholar]
- 22.Kang M, Kenworthy AK. A closed-form analytic expression for FRAP formula for the binding diffusion model. Biophysical Journal. 2008;95:L13–L15. doi: 10.1529/biophysj.108.135913. [DOI] [PMC free article] [PubMed] [Google Scholar]
- 23.Kaufman EN, Jain RK. Quantification of transport and binding parameters using fluorescence recovery after photobleaching. Biophysical Journal. 1990;58:873–885. doi: 10.1016/S0006-3495(90)82432-2. [DOI] [PMC free article] [PubMed] [Google Scholar]
- 24.Kaufman EN, Jain RK. Measurement of mass transport and reaction parameters in bulk solution using photobleaching. Biophysical Journal. 1991;60:596–610. doi: 10.1016/S0006-3495(91)82089-6. [DOI] [PMC free article] [PubMed] [Google Scholar]
- 25.Kimura H, Sugaya K, Cook PR. The transcription cycle of RNA polymerase II in living cells. Journal of Cell Biology. 2002;159:457–459. doi: 10.1083/jcb.200206019. [DOI] [PMC free article] [PubMed] [Google Scholar]
- 26.Leddy HA, Awad HA, Guilak F. Molecular diffusion in tissue-engineered cartilage constructs: Effects of scaffold material, time, and culture conditions. J Biomed Mater Res B Appl Biomater. 2004;70:397–406. doi: 10.1002/jbm.b.30053. [DOI] [PubMed] [Google Scholar]
- 27.Leddy HA, Guilak F. Site-specific molecular diffusion in articular cartilage measured using fluorescence recovery after photobleaching. Annals of Biomedical Engineering. 2003;31:753–760. doi: 10.1114/1.1581879. [DOI] [PubMed] [Google Scholar]
- 28.Leddy HA, Guilak F. Site-specific effects of compression on macromolecular diffusion in articular cartilage. Biophysical Journal. 2008;95:4890–4895. doi: 10.1529/biophysj.108.137752. [DOI] [PMC free article] [PubMed] [Google Scholar]
- 29.Leddy HA, Haider MA, Guilak F. Diffusional anisotropy in collagenous tissues: fluorescence imaging of continuous point photobleaching. Biophysical Journal. 2006;91:311–316. doi: 10.1529/biophysj.105.075283. [DOI] [PMC free article] [PubMed] [Google Scholar]
- 30.Lele TP, Ingber DE. A mathematical model to determine molecular kinetic rate constants under non-steady state conditions using fluorescence recovery after photobleaching (FRAP) Biophysical Chemistry. 2006;120:32–35. doi: 10.1016/j.bpc.2005.10.007. [DOI] [PubMed] [Google Scholar]
- 31.Lippincott-Schwartz J, Altan-Bonnet N, Patterson GH. Photobleaching and photoactivation: following protein dynamics in living cells. Nature Cell Biology. 2003 Supplement:S7–S13. [PubMed] [Google Scholar]
- 32.Maroudas A. Distribution and diffusion of solutes in articular cartilage. Biophys J. 1970;10:365–379. doi: 10.1016/S0006-3495(70)86307-X. [DOI] [PMC free article] [PubMed] [Google Scholar]
- 33.Maroudas A. Biophysical chemistry of cartilaginous tissues with special reference to solute and fluid transport. Biorheology. 1975;12:233–248. doi: 10.3233/bir-1975-123-416. [DOI] [PubMed] [Google Scholar]
- 34.Meyvis TKL, De Smedt SC, Van Oostveldt P, Demeester J. Fluorescence recovery after photobleaching: a versatile tool for mobility and interaction measurements in pharmaceutical research. Pharmaceutical Research. 1999;16:1153–1162. doi: 10.1023/a:1011924909138. [DOI] [PubMed] [Google Scholar]
- 35.Ohshima H, Tsuji H, Hiarano N, Ishihara H, Katoh Y, Yamada H. Water diffusion pathway, swelling pressure, and biomechanical properties of the intervertebral disc during compression load. Spine. 1989;14:1234–1244. doi: 10.1097/00007632-198911000-00017. [DOI] [PubMed] [Google Scholar]
- 36.Perry RH. Engineering manual. New York: McGraw Hill, Inc.; 1976. Mathematical tables and mathematics; pp. 78–80. [Google Scholar]
- 37.Quinn TM, Kocian P, Meister JJ. Static compression is associated with decreased diffusivity of dextrans in cartilage explants. Arch Biochem Biophys. 2000;384:327–334. doi: 10.1006/abbi.2000.2077. [DOI] [PubMed] [Google Scholar]
- 38.Quinn TM, Morel V, Meister JJ. Static compression of articular cartilage can reduce solute diffusivity and partitioning: implications for the chondrocyte biological response. J Biomech. 2001;34:1463–1469. doi: 10.1016/s0021-9290(01)00112-9. [DOI] [PubMed] [Google Scholar]
- 39.Reits EAJ, Neefies JJ. From fixed to FRAP: measuring protein mobility and activity in living cells. Nature Cell Biology. 2001;3:E145–E147. doi: 10.1038/35078615. [DOI] [PubMed] [Google Scholar]
- 40.Schneiderman R, Snir E, Popper O, Hiss J, Stein H, Maroudas A. Insulin-like growth factor-I and its complexes in normal human articular cartilage: studies of partition and diffusion. Arch.Biochem.Biophys. 1995:159–172. doi: 10.1006/abbi.1995.9914. [DOI] [PubMed] [Google Scholar]
- 41.Sprague BL, McNally JG. FRAP analysis of binding: proper and fitting. Trends in Cell Biology. 2005;15:84–91. doi: 10.1016/j.tcb.2004.12.001. [DOI] [PubMed] [Google Scholar]
- 42.Sprague BL, Pego RL, Stavreva DA, McNally JG. Analysis of Binding Reactions by Fluorescence Recovery after Photobleaching. Biophys J. 2004;86:3473–3495. doi: 10.1529/biophysj.103.026765. [DOI] [PMC free article] [PubMed] [Google Scholar]
- 43.Torzilli PA, Adams TC, Mis RJ. Transient solute diffusion in articular cartilage. J Biomech. 1987;20:203–214. doi: 10.1016/0021-9290(87)90311-3. [DOI] [PubMed] [Google Scholar]
- 44.Torzilli PA, Grande DA, Arduino JM. Diffusive properties of immature articular cartilage. J Biomed Mater.Res. 1998;40:132–138. doi: 10.1002/(sici)1097-4636(199804)40:1<132::aid-jbm15>3.0.co;2-q. [DOI] [PubMed] [Google Scholar]
- 45.Travascio F, Gu WY. Anisotropic diffusive transport in annulus fibrosus: experimental determination of the diffusion tensor by FRAP technique. Annals of Biomed Engng. 2007;35:1739–1748. doi: 10.1007/s10439-007-9346-2. [DOI] [PMC free article] [PubMed] [Google Scholar]
- 46.Travascio F, Jackson AR, Brown MD, Gu WY. Relationship between solute transport properties and tissue morphology in human annulus fibrosus. Journal of Orthopaedic Research. 2009;27:1625–1630. doi: 10.1002/jor.20927. [DOI] [PMC free article] [PubMed] [Google Scholar]
- 47.Travascio F, Zhao W, Gu WY. Characterization of anisotropic diffusion tensor of solute in tissue by video-FRAP imaging technique. Annals of Biomed Engng. 2009;37:813–823. doi: 10.1007/s10439-009-9655-8. [DOI] [PMC free article] [PubMed] [Google Scholar]
- 48.Tsay TT, Jacobson K. Spatial Fourier analysis of video photobleaching measurements. Principles and optimization. Biophys J. 1991;60:360–368. doi: 10.1016/S0006-3495(91)82061-6. [DOI] [PMC free article] [PubMed] [Google Scholar]
- 49.Tsibidis GD. Quantitative interpretation of binding reactions of rapidly diffusing species using fluorescence recovery after photobleaching. Journal of Microscopy. 2009;233:384–390. doi: 10.1111/j.1365-2818.2009.03132.x. [DOI] [PubMed] [Google Scholar]
- 50.Urban JP, Holm S, Maroudas A. Diffusion of small solutes into the intervertebral disc: as in vivo study. Biorheology. 1978;15:203–221. doi: 10.3233/bir-1978-153-409. [DOI] [PubMed] [Google Scholar]
- 51.Urban JP, Holm S, Maroudas A, Nachemson A. Nutrition of the intervertebral disc: Effect of fluid flow on solute transport. Clin Orthop. 1982;170:296–302. [PubMed] [Google Scholar]
- 52.Urban JP, Smith S, Fairbank JC. Nutrition of the Intervertebral disc. Spine. 2004;29:2700–2709. doi: 10.1097/01.brs.0000146499.97948.52. [DOI] [PubMed] [Google Scholar]
- 53.Urban JPG, Holms S, Maroudas A, Nachemson A. Nutrition of the intervertebral disc: An in vivo study of solute transport. Clin Orthop. 1977;129:101–114. [PubMed] [Google Scholar]
- 54.Zhang L, Gardiner BS, Smith DW, Pivonka P, Grodzinsky AJ. The effect of cyclic deformation and solute binding on solute transport in cartilage. Archives of Biochemistry and Biophysics. 2007;457:47–56. doi: 10.1016/j.abb.2006.10.007. [DOI] [PubMed] [Google Scholar]


