Abstract
Pulmonary vascular input impedance better characterizes right ventricular (RV) afterload and disease outcomes in pulmonary hypertension compared to the standard clinical diagnostic, pulmonary vascular resistance (PVR). Early efforts to measure impedance were not routine, involving open-chest measurement. Recently, the use of pulsed-wave (PW) Doppler-measured velocity to non-invasively estimate instantaneous flow has made impedance measurement more practical. One critical concern remains with clinical use: the measurement uncertainty, especially since previous studies only incorporated random error. This study utilized data from a large pediatric patient population to comprehensively examine the systematic and random error contributions to the total impedance uncertainty and determined the least error prone methodology to compute impedance from among four different methods. We found that the systematic error contributes greatly to the total uncertainty and that one of the four methods had significantly smaller propagated uncertainty; however, even when this best method is used, the uncertainty can be large for input impedance at high harmonics and for the characteristic impedance modulus. Finally, we found that uncertainty in impedance between normotensive and hypertensive patient groups displays no significant difference. It is concluded that clinical impedance measurement would be most improved by advancements in instrumentation, and the best computation method is proposed for future clinical use of the input impedance.
Keywords: uncertainty, systematic error, random error, input impedance, characteristic impedance, pediatric patient
1. Introduction
Pulmonary arterial hypertension (PAH) is an important cause of morbidity and mortality in children and adults. PAH is characterized by high blood pressure in the pulmonary circulation that yields increases in right ventricular (RV) afterload, and is associated with arterial remodeling and eventual failure of the RV. Current diagnosis of PAH is executed through the measurement of pulmonary vascular resistance (PVR), which is the viscous hydraulic opposition to the mean blood flow. However, PVR, a measure based on the assumption of steady hemodynamics, can only provide limited information about overall pulmonary vascular function due to its neglect of the pulsatile components of blood flow (Grant and Lieber 1996, Weinberg et al 2004). Alternatively, pulmonary arterial (PA) input impedance (Z), which represents the opposition to both the mean and pulsatile components of flow, has been shown to be a much better measure of RV afterload and to better characterize pulmonary vascular function (Milnor et al 1969, Milnor 1975, Grant and Lieber 1996, Weinberg et al 2004). Perhaps as a result, it also better predicts clinical outcomes (Hunter et al 2008). The correct measurement of input impedance is thus highly important for accurate diagnosis of PAH. Magnetic resonance imaging (MRI) has been used to evaluate the blood flow very accurately through ensemble imaging. However, this technique does not provide beat-to-beat measurements of flow, and thus cannot assess the biological variability. Additionally, MRI is very expensive and time consuming, and thus is not routinely used in most hospitals or research centers in the USA. Recently, our group has developed a new method to measure impedance using pulsed-wave (PW) Doppler-measured instantaneous velocity and pressure measurements; flow was derived from the PW measurement (Weinberg et al 2004). This new method is relatively simple and easy to implement especially for pediatric patients compared to other techniques, and has shown promise for future clinical application in evaluating the pulmonary vascular function from the standpoint of standard of care in pediatrics.
Impedance has shown promise for routine use in clinical settings. The impedance at the zero-frequency harmonic (Z0) correlates well with the distal vascular resistance (PVR). Some have postulated that the first harmonic (Z1, Weinberg et al 2004) or the sum of the first two harmonics (Z1 + Z2, Hunter et al 2008) is representative of pulmonary vascular stiffness. Notably, this impedance sum has been shown to better predict pediatric patient outcomes in PAH (Hunter et al 2008). On the systemic side, the increase of systemic input impedance modulus and the shift of the first minimum impedance modulus and phase to higher harmonic have been used to represent the stiffening of ascending aorta (Milnor 1975). The wave reflection, which is estimated as the difference between maximum and minimum input impedance, has been associated with left heart failure (Pepine et al 1978). Others have proposed the use of the characteristic impedance, which provides an indirect measurement of vascular compliance and has been used to evaluate the arterial disease of the vascular bed (McDonald 1974, Nichols et al 1977, Lucas et al 1988, Finkelstein et al 1988). The characteristic impedance can only be estimated through the measured input impedance due to the presence of reflected waves (Bergel and Milnor 1965, McDonald 1974, Grant and Lieber 1996). In a word, the ventricular afterload is better defined by the impedance spectrum rather than pressure or ventricular wall stress (Patel et al 1963, Milnor 1975, Nichols et al 1980).
Clearly the uncertainty associated with each of the pulmonary vascular uses noted above is important to the clinical application of this routine PW and pressure measurement. There are systematic errors (or biases) associated with the measuring instruments, analytical random error introduced by the chance fluctuations in the environment or other factors from one measurement to the next, and biological random error due to the individual’s variation around their homeostatic state; these errors will be propagated to the input impedance. As a result, the measured input impedance may have very large uncertainty, especially at high harmonics. Precisely quantifying the uncertainty in input impedance can provide confidence and guidance for its application to clinical medicine. In our previous work (Weinberg et al 2004, Hunter et al 2008), only the random error was considered in calculating the uncertainty in input impedance. To the best of our knowledge, no work has been published that comprehensively studies the uncertainty in the input impedance as measured by the combination of PW Doppler-approximated instantaneous flow and invasively measured pressure. Therefore, the goals of this study were (1) to develop formulations for the calculation of uncertainty in input impedance incorporating both systematic and random errors, (2) to investigate the uncertainty in input impedance and determine up to which harmonic of impedance that can be used properly for clinical application and (3) to determine if the characteristic impedance, which is calculated from the higher harmonics of impedance, may be accurately used from these measurements.
2. Methods
We first studied the systematic uncertainty in the pressure and flow spectra moduli by comparing each systematic uncertainty to its respective spectrum modulus for each harmonic up to the tenth. The contribution of the systematic error to the total uncertainty in input impedance was then investigated to see if the systematic error was negligible. Thirdly, the percent total uncertainties in input impedance calculated from four different methods were compared to determine the method with the lowest percent total uncertainty. Finally, systematic uncertainty in the pressure and flow spectra moduli and total uncertainty in input impedance were compared between normotensive and hypertensive groups to explore how the uncertainty was affected by patient condition.
2.1. Clinical data acquisition
After institutional review board approval and informed consent and assent had been obtained, clinical data were obtained during routine cardiac catheterization of patients as part of their regular evaluation and treatment at the Children’s hospital in Denver, CO. A total of 57 patients (median age 6.46 years, range 0.33–21 years, 25 females) were considered, of whom 13 patients were with normal mean PA pressures (median age 5.69 years, range 0.92–16 years, 9 females) and 44 patients with PAH (median age 6.68 years, range 0.33–21 years, 16 females). The data used for calculation in this paper were obtained at a room air (baseline) condition for all patients, i.e. no vasoreactivity data were used.
The pressure within the middle section of main PA was measured with standard fluid-filled catheters (Transpac IV, Abbott Critical Care Systems, Abbott Park, IL, USA). PW Doppler velocity at the midline of the middle section of main PA was measured with a commercial ultrasound scanner (Vivid 5, GE Medical Systems Inc., Waukesha, WI, USA) from a parasternal short-axis view as described previously (Weinberg et al 2004). Four different Vivid 5 systems were used, depending on clinical availability; all had nearly identical data acquisition characteristics. By performing anatomic assessment of the MPA as well as color Doppler flow imaging prior to PW Doppler imaging, the angle between flow in the MPA and the ultrasound beamline (i.e. the Doppler angle) was minimized. For the purpose of error estimation, we assume that the Doppler angle was always less than 5° for all clinical measurements; this results in less than 0.4% error in the Doppler signal, which was not considered in our study. Cardiac output (CO) at room air condition was measured three times for each patient by Fick’s method with measured oxygen consumption in cases where intracardiac shunts were in place and by thermodilution otherwise (Calysto IV, Witt Biomedical, FL), and the mean CO was used for calculations. We recall that the instantaneous flow rate Q(t) was calculated by multiplying the Doppler-measured velocity V(t) by a constant area correction factor:
| (1) |
where the constant Acorr is obtained from
| (2) |
in which V̄ is the time-averaged PW Doppler velocity. Note that the above calculation assumes that the instantaneous cross-section area is constant over time and the spatial profile of the velocity is nearly constant across the vessel (Womersley 1955), which together have been shown previously to be acceptable approximations (Weinberg et al 2004). The recorded pressure and calculated flow time histories were then separated and collected into individual cardiac cycle-based electrocardiographic (ECG) gating; more detail may be found elsewhere (Hunter et al 2008).
2.2. Basics of error propagation
Consider a general data reduction equation:
| (3) |
with associated standard random errors and standard systematic errors for each variable, and the associated degrees of freedom . Assuming there are no random error/systematic error correlations, the standard total error δy and uncertainty uy in y under the first-order Taylor series approximation are (ANSI/ASME 1997, Coleman and Steele 1999)
| (4) |
| (5) |
where the superscripts R and S refer to random and systematic errors, respectively, δjk = (δj)2 for j = k and is the covariance of the errors in xj and xk for j ≠ k, tυ,95 is the t value from Student’s t distribution with υ degrees of freedom for a 95% confidence level and υ is the number of degrees of freedom associated with δy and is calculated from the generalized Welch–Satterthwaite formula that can accommodate the correlated components of uncertainty (Willink 2007).
Note that if the standard systematic error for all the N measured results of xj is the same as , the standard systematic error in xj is with infinite degrees of freedom (Dieck 1997). However, if the standard systematic error for each which is different for different n, the standard systematic error in xj is then estimated as (Coleman and Steele 1999)
| (6) |
with (N − 1) degrees of freedom.
We define the contribution of the systematic error to the total uncertainty as
| (7) |
If we have another function, z = z(x1, x2, …, xL), then the covariance between y and z on the first-order approximation is (Freund and Walpole 1987)
| (8) |
2.3. Systematic uncertainty in pressure and flow spectra moduli and phases
For N time-domain measurements of pressure, P(n), the spectrum for this quantity waveform is obtained by applying the discrete Fourier transform as
| (9) |
where the overhat indicates a Fourier-transformed quantity and k is an integer and denotes the zero-frequency harmonic of the spectrum when k = 0 and the kth harmonic of the spectrum when 1 ≤ k ≤ (N − 1)/2.
The systematic error in pressure arises from the offset, accuracy of the transducer sensitivity, digital-to-analog conversion, etc. The offset of the transducer and the error in the transducer sensitivity are both small compared to the resolution of the digital-to-analog conversion performed by the ultrasound system (Vivid 5). Therefore, the error considered in this study is due to digital-to-analog conversion and thus depends on the type of the digital-to-analog converter used in the ultrasound system. The standard systematic error in pressure in the time domain is thus constant (denoted as ) for all the pressure data points in the same patient and there is no correlation between any two pressure data points. As a result, the standard systematic errors in the real part, P̂R(k), the imaginary part, P̂I(k), the modulus, |P̂(k)| and the phase, ϕP(k), of P̂(k) for a cardiac cycle with N time-domain data points are calculated by using the theory in section 2.2 as
| (10) |
| (11) |
For velocity, the standard systematic error is constant (denoted as ) for all the velocity data points in the same patient and there is no correlation between any two velocity data points. The systematic error in velocity considered here is a function of the pulse repetition frequency (PRF), which is changed for each subject to maximize velocity range. Thus, the error can be different for different patients. However, each flow data point is calculated from equations (1) and (2). The standard systematic error of a flow is calculated by using the theory in section 2.2 as
| (12) |
where is the standard systematic error in the area correction factor, Acorr, is the standard systematic error in cardiac output and is obtained from the cardiac output instrumentation manufacturer (Calysto IV, Witt Biomedical, FL), Nj is the number of time-domain data points in the jth cardiac cycle and M is the number of cardiac cycles. The covariance of the systematic error in Q(n1) and Q(n2) based on equation (8) is
| (13) |
As a result, the standard systematic errors associated with flow spectrum quantities can not be reduced to simple forms as pressure as shown in equations (10) and (11).
With the standard systematic errors for pressure and flow spectra moduli, we defined the mean percent systematic uncertainty in the spectrum modulus at the kth harmonic for a patient as
| (14) |
where |fj(k)| denotes the modulus of pressure or flow spectrum at the kth harmonic and the number 2 in the above equation is to transfer the standard systematic error which is for a 68% confidence level to the systematic uncertainty for a 95% confidence level.
2.4. Input impedance and the uncertainty
The input impedance is defined as
| (15) |
Given M cardiac cycles of pressure and flow data, we determined four different methods to calculate the input impedance modulus |Z(k)| and phase ϕ(k) and the associated uncertainties. Since the random analytical error and random biological error cannot be separated, these two errors are combined together and denoted as the random error. It is noted that the random error in cardiac output was not considered since the three measured values of cardiac output are quite close. The four methods of calculation and the corresponding data reduction equations f(x, y, …) are as follows.
Method 1. Average of the absolute values or arguments of the complex ratio:
| (16) |
| (17) |
In the notation, Arg(x) denotes the principal argument of the complex number, x, and is between −π and π.
Method 2. Absolute value or argument of the average of the complex ratio:
| (18) |
| (19) |
where Arctan(y/x) is the inverse tangent of y/x and is restricted to the range of [−π, π]. Re(x) and Im(x) denote the real and imaginary parts of x, respectively. Note that there is no covariance of random errors in x and y, but the covariance of systematic errors in x and y is considered.
Method 3. Ratio of the averages of the absolute value or difference of the average phases:
| (20) |
| (21) |
where C is a constant (0, 2π, or −2π) which assures the calculated phase angle ϕ3(k) to be within the principal argument range of [−π, π]. Note that there is no covariance of random or systematic errors in x1 and y1 or in x2 and y2 for x1 and y1 or x2 and y2 are independent.
Method 4. Ratio of the absolute values of the complex average or phase difference of the complex averages:
| (22) |
| (23) |
Note that there is no covariance of random errors in any two variables of x1, y1, x2 and y2, but the covariance of the systematic error in x1 and y1 or in x2 and y2 is calculated.
Mathematically, the above four methods apply the non-associative operators of average, absolute or argument, and ratio (division) to obtain modulus or phase. As a result of the operator’s non-associativity, the propagation of error is different for each method. The above four methods represent all possible ways to calculate the impedance given the definition of impedance by equation (15). For the first two methods, the complex impedance for each cycle is first calculated. Then, in method 1, the impedance modulus and phase of each cycle are calculated before the average values are obtained. In contrast, first the average complex impedance is obtained for all the cycles in method 2 and then the impedance modulus and phase are calculated. In methods 3 and 4, the average spectra moduli and phases for pressure and flow are calculated separately before the impedance modulus and phase are obtained. In method 3, the pressure and flow spectra moduli and phases are calculated before the average spectra moduli and phases are obtained, while in method 4, the average pressure and flow spectra are obtained for all the cycles before the pressure and flow spectra moduli and phase are calculated.
We define the percent total uncertainty in impedance modulus as the total uncertainty divided by the modulus, as shown previously. However, use of this definition with phase will lead to a huge percentage because the phase can be very small. Thus, the percent total uncertainty in impedance phase is defined as the total uncertainty divided by 2π.
2.5. Characteristic impedance
Many methods exist in the literature to estimate the characteristic impedance (Bergel and Milnor 1965, McDonald 1974, Finkelstein et al 1988, Weinberg et al 2004, Segers et al 2007) from experimental measurements. However, the superiority of any single method has not been established. The characteristic impedance is estimated here by averaging the impedance moduli from the first minimum up to the eighth harmonic, |ZC| = (|Z1st minimum| + … + |Z8|)/N, where N is the number of impedance moduli in the calculation. The uncertainty in characteristic impedance is calculated through the error propagation for each method.
2.6. Statistical analysis
All the data are presented as mean ± SD unless specified otherwise. The one-way ANOVA test was used to compare the mean contributions of systematic uncertainty to the total uncertainty in impedance from the four methods, and to compare the mean percent total uncertainty in impedance from the four methods. The paired t-test was performed to identify differences of the means of the percent total uncertainty in impedance between any two methods. The two-sample t-test and equivalence test were used to compare the uncertainties between normotensive and hypertensive groups. The confidence level was set at 95% for all tests. Finally, we chose 20% error as our maximum acceptable error, and showed this 20% demarcation as a line in many results.
3. Results
3.1. Pooled data
The bias for pressure, , varies modestly due to the four different ultrasound systems and has an average of 0.385 ± 0.009 mmHg for all the patients. The bias for velocity, , varies patient-to-patient due to changes in the velocity range and pulse repetition frequency settings during acquisition of the spectral image and has an average of 1.13 ± 0.26 cm s−1 for all the patients. The bias for cardiac output, , is 10% of the cardiac output (CO).
In general, the modulus of the pressure or flow spectrum decreases quickly as the harmonic number increases for the first several harmonics and exhibits small oscillations within the higher harmonic region (>fourth harmonic). As a result, the modulus can be smaller than the systematic uncertainty at a certain harmonic, but larger than the systematic uncertainty at the next higher harmonic. Presumably due to the biological variation and random process of the measurement, it is also possible that moduli at a harmonic from one or several measured cardiac cycles for a patient are smaller than the associated systematic uncertainty, but the moduli computed for other cycles are larger than the systematic uncertainty at that harmonic.
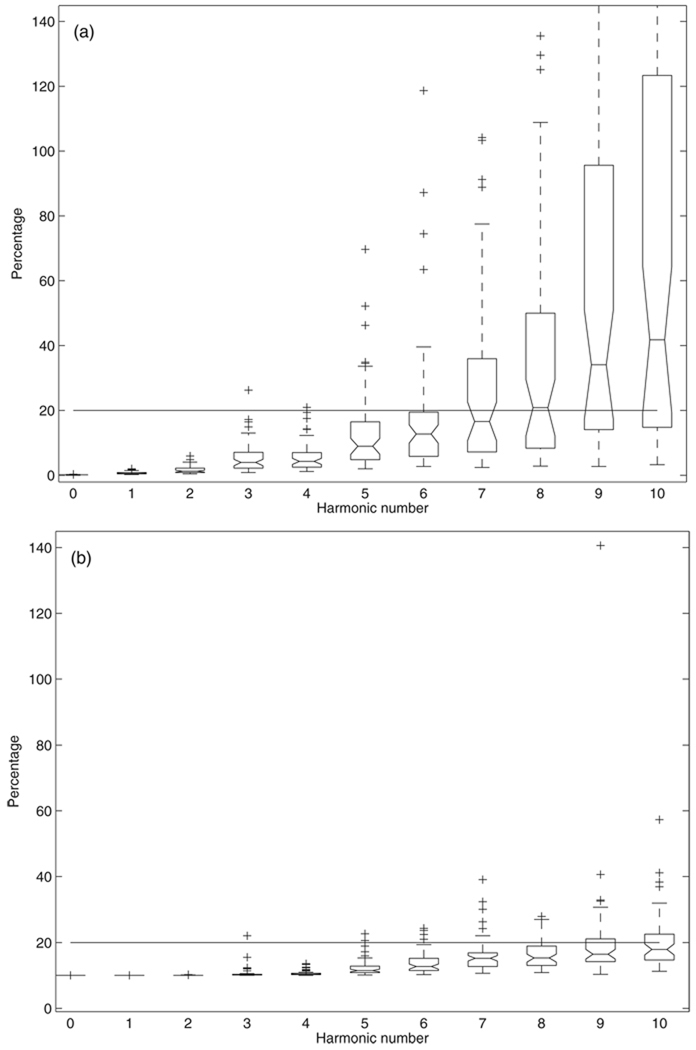
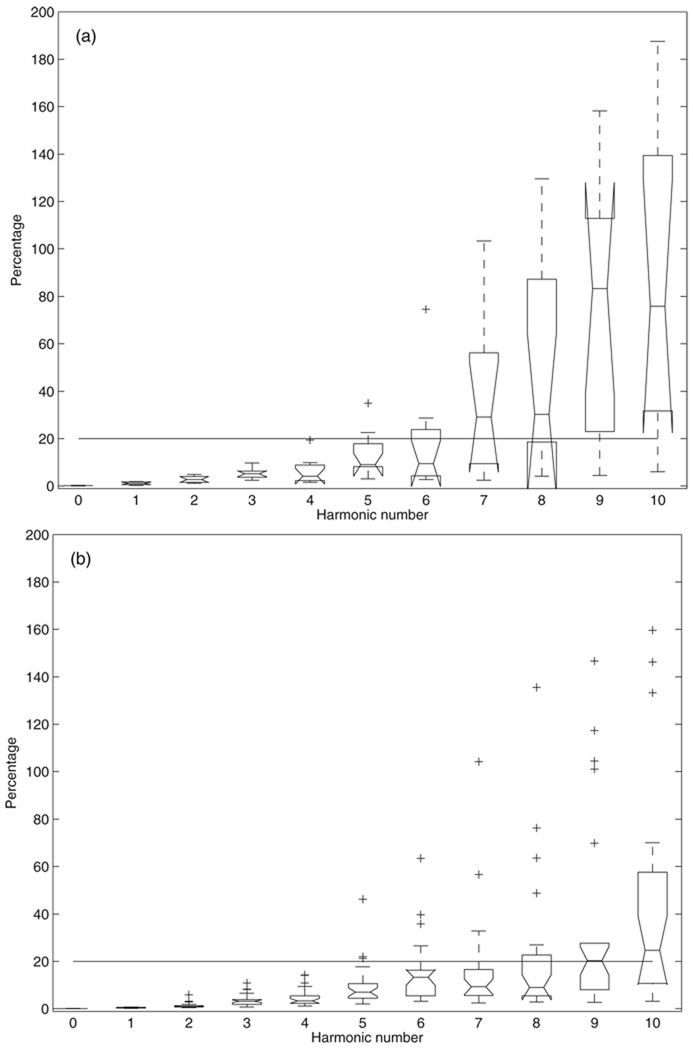
The percent systematic uncertainties in pressure and flow spectra moduli are shown in figure 1 plotted using the boxplot function in Matlab (similar plots for following figures unless specified otherwise). For each box, the central mark is the median, the edges of the box are the 25th (q1) and 75th percentiles (q3). The + symbols represent the outliers that are outside the whisker range [q1 − 1.5(q3 − q1) q3 + 1.5(q3 − q1)] (Tukey 1977, McGill et al 1978). For pressure (figure 1(a)), the averages are 0.13% ± 0.06%, 0.75% ± 0.48%, 1.7% ± 1.1%, 5.7% ±4.9% and 5.6% ± 4.6% for the zero-frequency, first, second, third and fourth harmonics, respectively. The error clearly increases from the fifth to the eighth harmonic; the median of these errors is still below or at 20%, but select patients have errors over 20% or even 50%. For the ninth and the tenth harmonics, the error medians are over 30% and there are many data points that exceed 100%, with several outliers over 200%. For flow (figure 1(b)), the average are 10.0% ± 0.0028%, 10.0% ± 0.0073%, 10.0% ± 0.035%, 10.6% ± 1.7% and 10.6% ± 0.78% for the zero-frequency, first, second, third and fourth harmonics, respectively. From the fifth to the tenth harmonic, all the medians are smaller than 20% but with more and more outliers over 20% as the harmonic number increases. There are only two outliers greater than 50% at each of the ninth and tenth harmonics.
Figure 1.
The percent systematic uncertainty in (a) pressure and (b) flow spectra moduli.
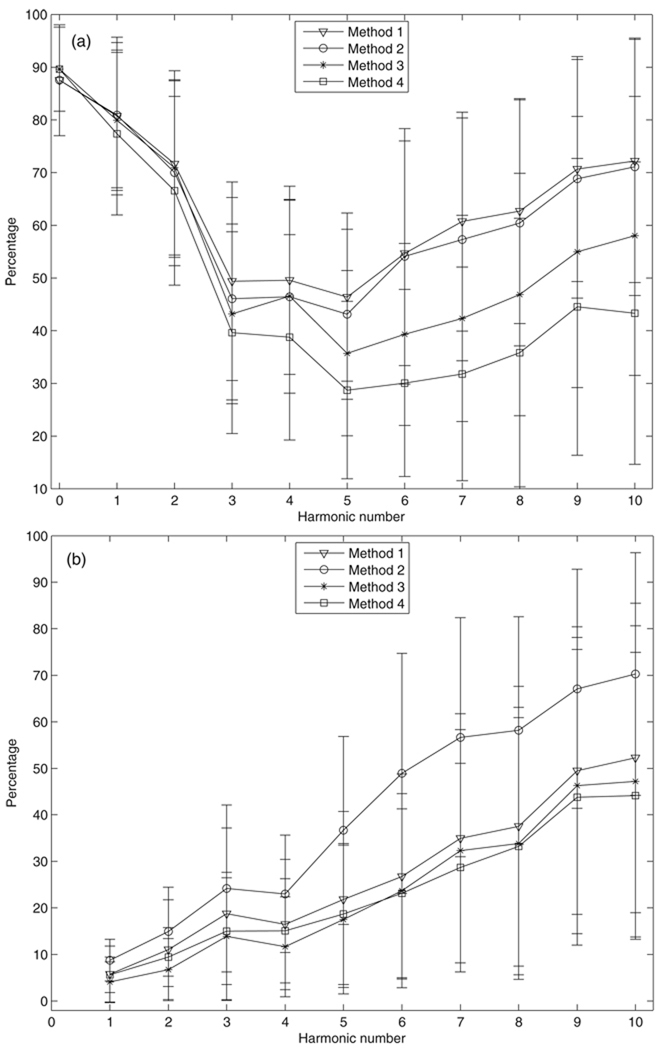
The average contribution of the systematic error to the total uncertainty in impedance modulus and phase for the grouped data as computed by the four methods is presented in figure 2. The systematic error of the modulus (figure 2(a)) provides average contributions of at least 70% to the total uncertainty in the zero-frequency, first and second harmonics, respectively, for all four methods, and contributes about 40% (methods 3 and 4) to 50% (methods 1 and 2) to the total uncertainty for harmonics up to the tenth. For the phase (figure 2(b)), the average contribution of the systematic error increases from about 8% to about 45–60% as harmonic increase from the first to the tenth. The mean contributions of the systematic error show no significant differences between the four methods to compute moduli at the zero-frequency, first and second harmonics (P > 0.4, ANOVA), but are significantly different from the third to the tenth harmonic (P < 0.04, ANOVA) and for phase for all the harmonics up to the tenth (P < 0.003, ANOVA).
Figure 2.
The percentage contribution of the systematic error to the total uncertainty in impedance: (a) modulus and (b) phase as computed by the four methods. Bars represent the sample standard deviation.
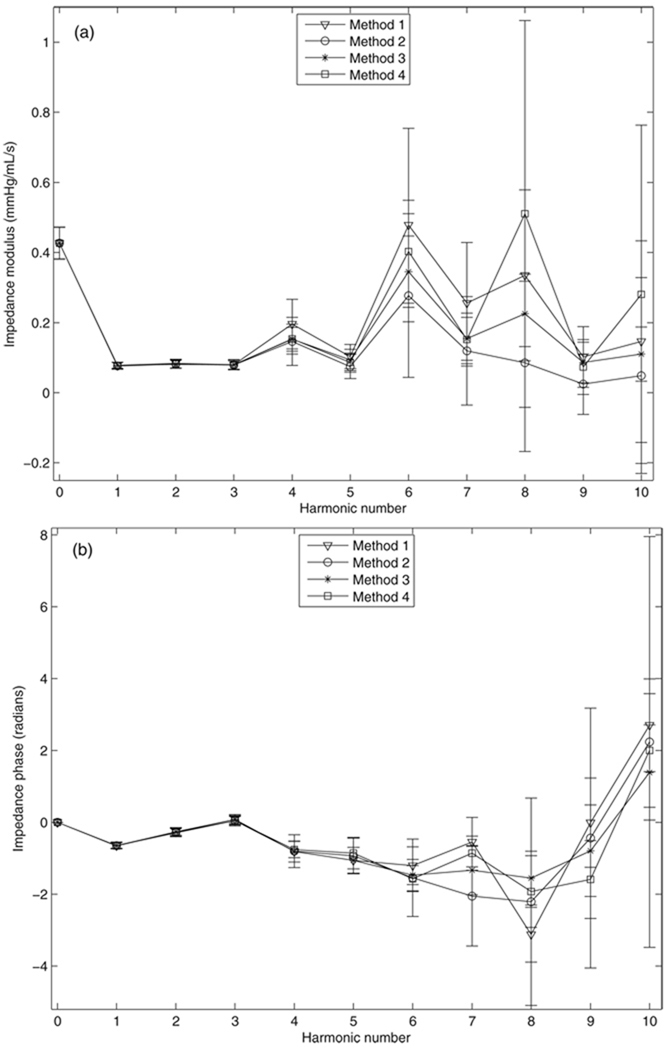
Representative plots of input impedance and its associated total uncertainty calculated with the four methods are shown in figure 3. In general, the impedance moduli and phases obtained from the four methods are very similar and have very small uncertainty up to the fourth harmonic, but differences between each method begin to emerge and overall uncertainty increases in the higher harmonics.
Figure 3.
Representative plots of input impedance: (a) modulus and (b) phase and the associated total uncertainties calculated from the four methods. Bars represent the total uncertainty.
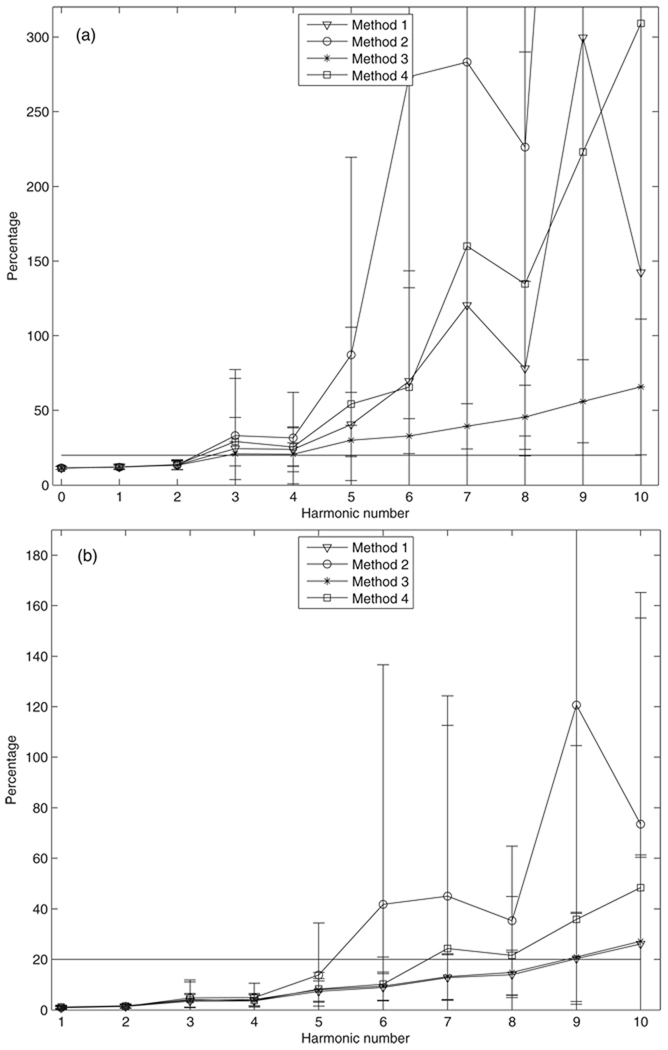
The group average percent total uncertainty in input impedance for four methods are shown in figure 4. The average percentages increase with the harmonic number for both impedance modulus and phase for all four methods. For modulus (figure 4(a)), the mean percentages for the four methods are very close up to the third harmonic and show no significant difference (P > 0.2, ANOVA). Method 3 has the smallest percent total uncertainty at harmonics higher than the third, and is significantly different from the other three (P < 0.031, paired t-test) except for the mean percentages between method 3 and method 1 at the ninth harmonic (P = 0.197, paired t-test) and the mean percentages between method 3 and method 4 at the seventh harmonic (P = 0.112, paired t-test). For phase (figure 4(b)), the mean percentages for the four methods are very close up to the fourth harmonic and show no significant difference (P > 0.08, ANOVA). Methods 1 and 3 give very close mean percentages although they are significantly different (P < 0.05, paired t-test). Methods 2 and 3 have significant differences in the mean percentages from the fifth to the tenth harmonic (P < 0.02, paired t-test). Methods 3 and 4 show no significant difference in the mean percentages from the fifth to the tenth harmonic (P > 0.07, except for P = 0.0053 at the eighth harmonics, paired t-test), but the means and the variations of percentages of method 3 are always smaller than those of method 4.
Figure 4.
Percent total uncertainty in input impedance: (a) modulus and (b) phase for the four methods. Bars represent the sample standard deviation.
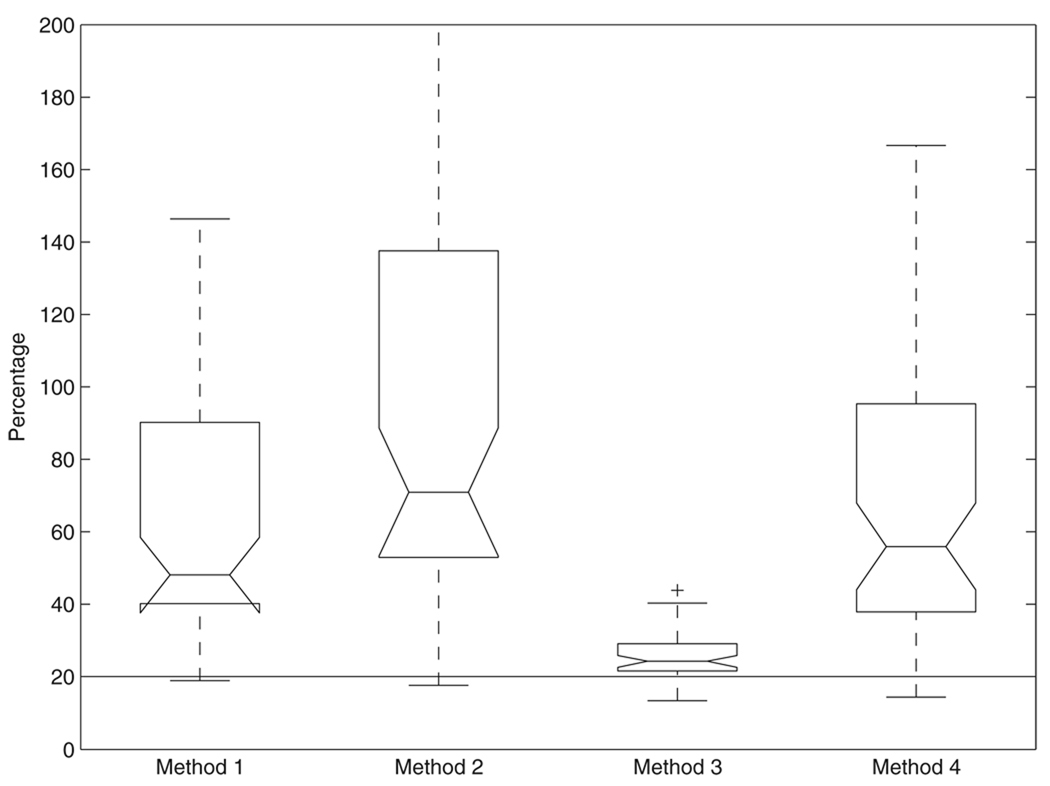
The percent total uncertainty in characteristic impedance calculated from the four methods is shown in figure 5. The mean percentages of the four methods display significant differences (P < 0.05, ANOVA). Method 3 has the smallest variation of the percentages (25% ± 6.7%) and has much lower median and mean percentages than the three other methods. The difference in the percentage between method 3 and the other three methods is significant (P < 0.015, except for P = 0.061 between method 3 and method 1, paired t-test).
Figure 5.
Percent total uncertainty in characteristic impedance modulus calculated from the four methods.
3.2. Comparison of normotensive and hypertensive groups
To study the difference of the uncertainty between normotensive and hypertensive groups, we selected 10 patients from the normotensive group with mean PA pressures less than 20 mmHg and 26 patients from the hypertensive group with mean PA pressures over 27 mmHg and compared their impedance errors. All other patients had mean PA pressures of 24 or 25 mmHg and were excluded from the study to better clarify the effects of a more severe disease state on the uncertainty.
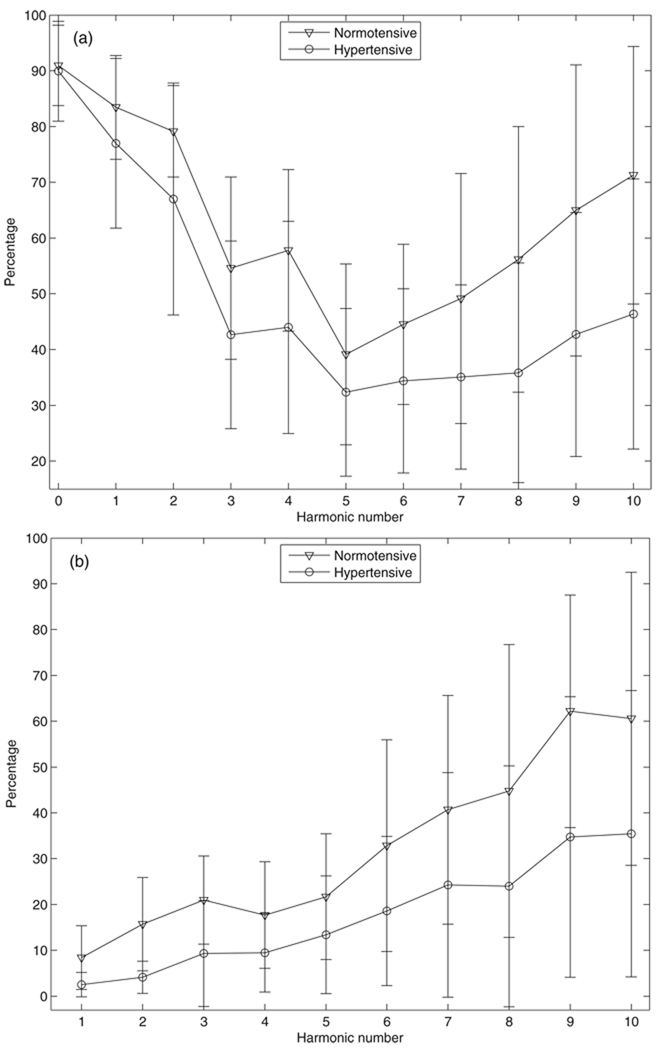
The percent systematic uncertainty in pressure spectrum modulus is shown in figure 6. The percentage differences between normotensive and hypertensive groups are significant for the zero-frequency, first, second, seventh, eighth and ninth harmonics (P < 0.025, t-test). No significant differences are seen for other harmonics, but both the mean and median percentages in the hypertensive group are smaller than those in the normotensive group. The percent systematic uncertainty in flow spectrum modulus is also studied (not shown) and there are no significant differences between the two groups for all the harmonics up to the tenth (P > 0.06, t-test, except for the zero-frequency and the first harmonics). However, these mean percentages at the zero-frequency and the first harmonics are nearly identical to 10.0% due to the fixed systematic error in cardiac output with a negligible random error.
Figure 6.
The percent systematic uncertainty in pressure spectrum modulus for (a) normotensive and (b) hypertensive groups.
The average contribution of the systematic error to the total uncertainty in input impedance for the two groups calculated from method 3 is shown in figure 7. The mean contributions show a significant difference for moduli at the fourth, seventh to tenth harmonics and for phases at first to fourth, sixth, ninth and tenth harmonics (P < 0.05, t-test). Though no significant differences were seen in the moduli and phases for other harmonics, the mean contributions in the normotensive group are larger than those in the hypertensive group.
Figure 7.
The percentage contribution of the systematic error to the total uncertainty in input impedance (a) modulus and (b) phase for normotensive and hypertensive groups calculated from method 3 (see section 2.4 for details). Bars represent the sample standard deviation.
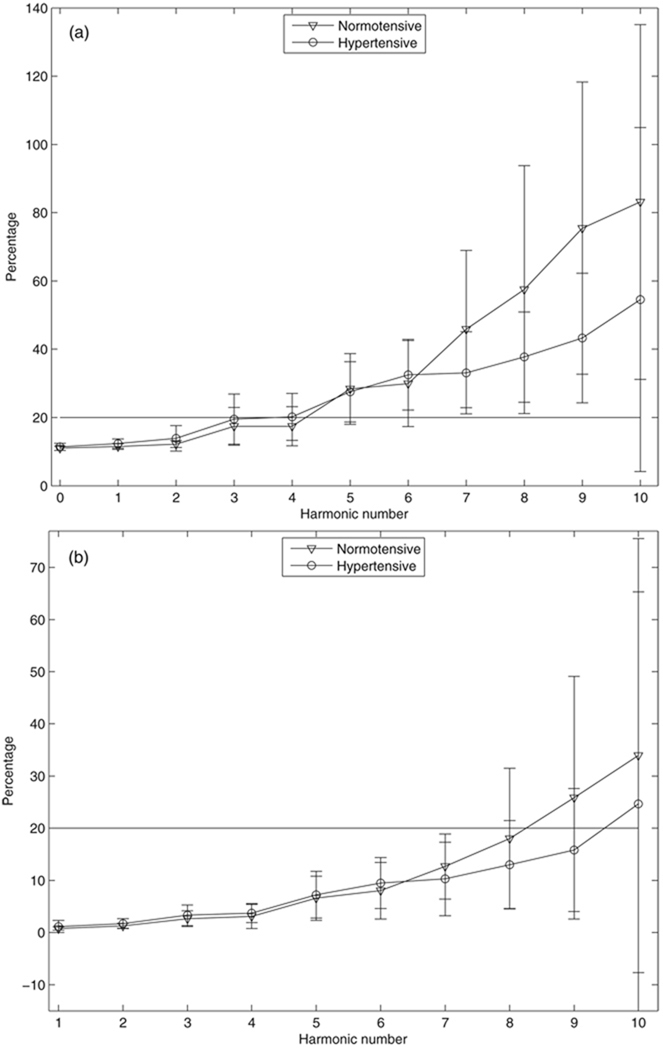
The average percent total uncertainty in input impedance for the two groups calculated from method 3 is shown in figure 8. The mean percentages show significant differences between the two groups in the moduli at the seventh to the ninth harmonics (P < 0.04, t-test), and are not significantly different between the two groups for moduli for the other harmonics and for phases for all the harmonics up to the tenth (P > 0.066, t-test). The percent total uncertainty in characteristic impedance calculated from method 3 shows no significant difference between the two groups (P = 0.55, t-test, figure not shown). The equivalence test (Hatch 1996) was also performed for the comparison of the average percent total uncertainties in input impedance and characteristic impedance for the two groups assuming the equivalence interval equal to 20% of the average value of the normotensive group. The mean percentages show no statistical equivalence between the two groups for all the impedance moduli and phases except for the impedance moduli at the zero-frequency and the first harmonics at the α = 0.05 level.
Figure 8.
Percent total uncertainty in input impedance: (a)modulus and (b) phase for normotensive and hypertensive groups calculated from method 3 (see section 2.4 for details). Bars represent the sample standard deviation.
4. Discussion
The uncertainty of input impedance and characteristic impedances in the pulmonary circulation system is critical given that the magnitude of the uncertainty can affect accurate interpretation of impedance for the diagnosis of PAH. This paper provides the first comprehensive and detailed study on the uncertainty in the pressure and flow spectra moduli, the input impedance and the characteristic impedance. Several important results have been found as follows.
The studies of the systematic error and its contribution to the total error (figures 1, 2) indicate that the systematic error must be considered when calculating the uncertainty; indeed, for the majority of harmonics studied, it represented the primary source of modulus error. For example, simply due to catheter precision, the pressure data from approximately the eighth harmonic and higher must be used with caution. The percent systematic uncertainty in flow spectrum modulus is about 10% up to the fourth harmonic, which is larger than that for pressure, but increases only moderately up to the tenth harmonic. The relatively large percent systematic uncertainty in the flow spectrum modulus even at low harmonics is the primary reason that the systematic error is the majority of the total uncertainty in input impedance. Clearly only considering the random error can dramatically underestimates the uncertainty, and the easiest means to improve impedance measurement uncertainty is to improve instrument precision.
We found significant differences between the four methods to compute impedance. The comparisons between the four methods strongly indicate that method 3, which obtains the impedance modulus from the ratio of the average of the absolute values of the pressure and flow spectra, gives the lowest percent total uncertainty in input impedance and characteristic impedance modulus overall. Therefore, method 3 is potentially the best technique to estimate the input impedance of these four methods. Previous studies have used method 1 which obtains the impedance modulus from the average of impedance moduli of all measured cycles (e.g., Bergel and Milnor 1965, Nichols et al 1977) and method 3 (e.g., Weinberg et al 2004, Hunter et al 2008); however, methods 1 and 3 are equivalent only for the uncertainty in input impedance phase, while method 1 has much larger uncertainties for input impedance modulus at high harmonics and characteristic impedance modulus. From a practical standpoint, any method may be used if only the first several harmonics are required. However, in that the values and errors of the four methods begin to strongly differ above the third harmonic, use of method 3 over the other methods has the effect of making characteristic impedance a quantitative, rather than screening level (qualitative) measurement.
Many previous studies did not perform the calculation of the uncertainty incorporating the two kinds of error before the usage of the input impedance (e.g., Weinberg et al 2004, Hunter et al 2008). The omission of the large uncertainty may lead to misleading conclusions, particularly in the high harmonics. Indeed, caution must still be exercised in the usage of the input impedance even though method 3 is applied. For example, the mean percent total uncertainties in input impedance and characteristic impedance moduli are over 50% for harmonic higher than the eighth and 25% ± 6.7%, respectively.
The comparison of uncertainty between normotensive and hypertensive groups shows some interesting results. Due to higher PA pressure in the hypertensive group and almost the same systematic errors in pressure for both groups, the percent systematic uncertainty in pressure spectrum modulus is smaller in the hypertensive group than in the normotensive group; however, the group flow uncertainties are quite similar. As a result, the contribution of the systematic error to total uncertainty in input impedance is greater for the normotensive group than for the hypertensive group. Despite this difference, the systematic error remains important for uncertainty in the hypertensive group. Finally, the percent total uncertainties in input impedance and characteristic impedance modulus are neither significantly different nor statistically equivalent between the two groups for many impedance moduli and phases. This implies that the percent random uncertainty is larger in the hypertensive group than in the normotensive group. The reason for such an observation of neither statistically significant difference nor equivalence in the test likely lies in the lower power of the tests, likely due to the relatively small sample size. A power analysis using these values as pilot data shows that the sample sizes of the hypertensive group required for a power of 0.8 should be greater than 35 if the ratio of the numbers for normotensive and hypertensive groups is kept to be 10/26 and the effect size and the within group standard deviation are kept the same as the current data.
Based on the study, there are several schemes that may be useful for reducing the uncertainty. The 10% systematic uncertainty in cardiac output is not small and contributes most to the total uncertainty in impedance modulus at the first few harmonics. Secondly, the systematic uncertainty in pressure is large enough that the uncertainty can exceed the pressure spectrum modulus at high harmonics. Those errors associated with acquisition equipment may be reduced as the technique improves. It is noted that transducer-tipped catheters (Millar Instruments Inc., Houston, TX, USA) can measure the pressure in the large artery more accurately than the currently used in our studies, but such catheters are relatively stiff and difficult to apply in pediatric patients and thus are not recommended for routine use. Finally, collecting additional cardiac cycles, i.e. repeated measurements of pressure and flow, will reduce the random error and thus the total uncertainty.
There are several limitations in our study. Firstly, only three measurements of cardiac output were made in the cardiac catheterization laboratory and the mean value of those measurements may not be truly representative of the patient’s hemostatic state. Moreover, the random error in cardiac output was not considered in the calculation of uncertainty, though it was typically very small. Secondly, the constant area correction for flow calculation can affect the accuracy of impedance modulus and the associated uncertainty, although such effects may be not very significant, as noted by Weinberg et al (2004). Thirdly, the normotensive and hypertensive groups have only respectively 10 and 26 patients, which are small in numbers given that there is large variability in the patient data. All these limitations will be considered in future studies.
5. Conclusion
We have studied the systematic uncertainty in pressure and flow spectra moduli and the contribution of the systematic error to the total uncertainty in input impedance in a large pediatric population. The percent total uncertainties in input impedance and characteristic impedance modulus have been compared between four different methods to determine the best method. We also have investigated the uncertainty behavior in normotensive and hypertensive groups. It is found out that the systematic error is very important and needs to be incorporated in the uncertainty estimation. The input impedance up to the fourth harmonic can be used with confidence thanks to small uncertainty associated with those quantities. However, the total uncertainty in input impedance at higher harmonic and the characteristic impedance can be very large compared to the modulus, and have to be used with caution. Method 3 (see section 2.4 for details) has been found out to be the best technique to estimate the input impedance in that it gives the smallest uncertainty overall. The comparison of the uncertainty between normotensive and hypertensive groups shows that the systematic error is more important in the normotensive group than in the hypertensive group, but the random error is larger in the hypertensive group than in the normotensive group, which results in non-significant differences in the percent total uncertainties in input impedance and characteristic impedance modulus between the two groups.
Acknowledgments
This study was supported in part by grants from the National Institutes of Health (R01-HL067393, T32-HL072738, K24-HL081506, and SCCOR-HL084923) and the American Heart Association (09SDG2260194).
References
- ANSI/ASME PTC 19.1. Performance Test Code, Instrument and Apparatus, Part 1, Measurement Uncertainty. New York: ANSI/ASME; 1997. [Google Scholar]
- Bergel DH, Milnor WR. Pulmonary vascular impedance in the dog. Circ. Res. 1965;16:401–415. doi: 10.1161/01.res.16.5.401. [DOI] [PubMed] [Google Scholar]
- Coleman HW, Steele WG. Experimentation and Uncertainty Analysis for Engineers. New York: Wiley; 1999. [Google Scholar]
- Dieck RH. Measurement Uncertainty: Methods and Applications. Research Triangle Park, NC: Instrument Society of America; 1997. [Google Scholar]
- Finkelstein SM, Collins VR, Cohn JN. Arterial vascular compliance response to vasodilators by Fourier and pulse contour analysis. Hypertension. 1988;12:380–387. doi: 10.1161/01.hyp.12.4.380. [DOI] [PubMed] [Google Scholar]
- Freund JE. Mathematical Statistics. Upper Saddle River, NJ: Prentice-Hall; 1987. Walpole. [Google Scholar]
- Grant BJB, Lieber BB. Clinical significance of pulmonary arterial input impedance. Eur. Respir. J. 1996;9:2196–2199. doi: 10.1183/09031936.96.09112196. [DOI] [PubMed] [Google Scholar]
- Hatch JP. Using statistical equivalence testing in clinical biofeedback research. Biofeedback Self Regul. 1996;21:105–119. doi: 10.1007/BF02284690. [DOI] [PubMed] [Google Scholar]
- Hunter KS, Lee P-F, Lanning CJ, Ivy DD, Kirby KS, Claussen LR, Chan KC, Shandas R. Pulmonary vascular input impedance is a combined measure of pulmonary vascular resistance and stiffness and predicts clinical outcomes better than pulmonary vascular resistance alone in pediatric patients with pulmonary hypertension. Am. Heart J. 2008;155:166–174. doi: 10.1016/j.ahj.2007.08.014. [DOI] [PMC free article] [PubMed] [Google Scholar]
- Lucas CL, Wilcox BR, Ha B, Henry GW. Comparison of time domain algorithms for estimating aortic characteristic impedance in humans. IEEE Trans. Biomed. Eng. 1988;35:62–68. doi: 10.1109/10.1337. [DOI] [PubMed] [Google Scholar]
- McDonald DA. Blood Flow in Arteries. London: Edward Arnold; 1974. [Google Scholar]
- McGill R, Tukey JW, Larsen WA. Variations of boxplots. Am. State. 1978;32:12–16. [Google Scholar]
- Milnor WR. Arterial impedance as ventricular afterload. Circ. Res. 1975;36:565–570. doi: 10.1161/01.res.36.5.565. [DOI] [PubMed] [Google Scholar]
- Milnor WR, Conti CR, Lewis KB, O’Rourke MF. Pulmonary arterial pulse wave velocity and impedance in man. Circ. Res. 1969;25:637–649. doi: 10.1161/01.res.25.6.637. [DOI] [PubMed] [Google Scholar]
- Nichols WW, Conti CR, Walker WE, Milnor WR. Input impedance of the systematic circulation in man. Circ. Res. 1977;40:451–458. doi: 10.1161/01.res.40.5.451. [DOI] [PubMed] [Google Scholar]
- Nichols WW, Pepine CJ, Geiser EA, Conti CR. Vascular load defined by the aortic input impedance spectrum. Fed. Proc. 1980;39:196–201. [PubMed] [Google Scholar]
- Patel DJ, deFreitas FM, Fry DL. Hydraulic input impedance to aorta and pulmonary artery in dogs. J. Appl. Physiol. 1963;18:134–140. doi: 10.1152/jappl.1963.18.1.134. [DOI] [PubMed] [Google Scholar]
- Pepine CJ, Nichols WW, Conti CR. Aortic input impedance in heart failure. Circulation. 1978;58:460–465. doi: 10.1161/01.cir.58.3.460. [DOI] [PubMed] [Google Scholar]
- Segers P, et al. Noninvasive (input) impedance, pulse wave velocity, and wave reflection in healthy middle-aged men and woman. Hypertension. 2007;49:1248–1255. doi: 10.1161/HYPERTENSIONAHA.106.085480. [DOI] [PubMed] [Google Scholar]
- Tukey JW. Exploratory Data Analysis. Reading, MA: Addison-Wesley; 1977. [Google Scholar]
- Weinberg CE, Hertzberg JR, Ivy DD, Kirby KS, Chan KC, Valdes-Cruz L, Shandas R. Extraction of pulmonary vascular compliance, pulmonary vascular resistance, and right ventricular work from single-pressure and Doppler flow measurements in children with pulmonary hypertension: a new method for evaluating reactivity—in vitro and clinical studies. Circulation. 2004;110:2609–2617. doi: 10.1161/01.CIR.0000146818.60588.40. [DOI] [PubMed] [Google Scholar]
- Willink R. A generalization of the Welch-Satterthwaite formula for use with correlated uncertainty components. Metrologia. 2007;44:340–349. [Google Scholar]
- Womersley JR. Method for the calculation of velocity, rate of flow and viscous drag in arteries when the pressure gradient is known. J. Physiol. 1955;127:553–563. doi: 10.1113/jphysiol.1955.sp005276. [DOI] [PMC free article] [PubMed] [Google Scholar]


