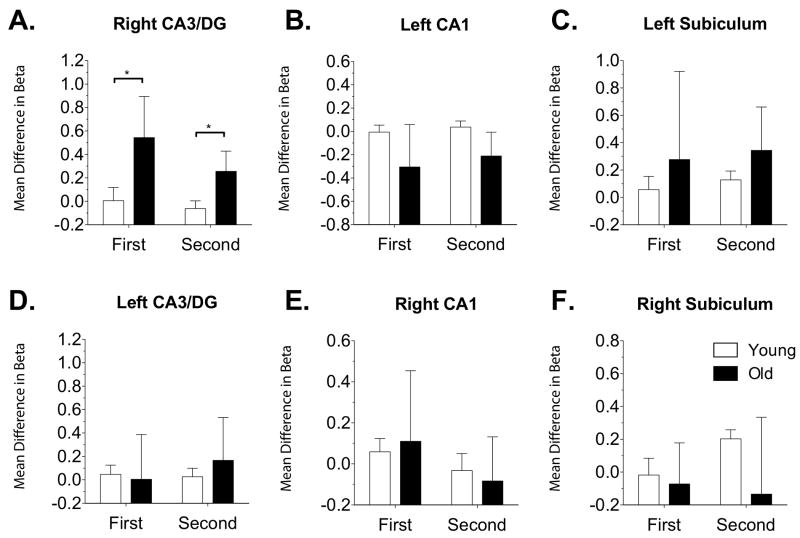
Figure 3.
Hippocampal subfield BOLD activity on the critical lure contrasts based on hybrid anatomical / functional ROIs. The x-axis represents (1) activity during the first presentation of an item that was subsequently tested with a lure (first) and (2) the presentation of the lure itself (second). The y-axis mean difference in beta is the difference between lures called “similar” and lures called “old”. There were no significant differences between groups in any of the subregions or the contrasts except in the right CA3/DG region. This region showed a larger difference between correct rejections and false alarms during first and subsequent presentations. Data plotted as mean ± s.e.m.

