Abstract
Purpose
To quantify the dosimetric effect and required margins to account for prostate intrafractional translation and residual setup error in a CBCT guided hypofractionated radiotherapy protocol.
Methods and Materials
Prostate position after online correction was measured during dose delivery using simultaneous kV fluoroscopy and post-treatment CBCT for 572 fractions from 30 patients. We reconstructed the dose distribution to the Clinical Tumor Volume (CTV) using a convolution of the static dose with a Probability Density Function (PDF) based on the kV fluoroscopy, and we calculated the minimum dose received by 99% of the CTV (D99). We compared reconstructed dose when the convolution was performed per beam, per patient, and when the PDF was created using post-treatment CBCT. We determined the minimum axis specific margins to limit CTV D99 reduction to 1%.
Results
For 3mm margins, D99 reduction was ≤5% for 29/30 patients. Using post-CBCT rather than localizations at treatment delivery exaggerated dosimetric effects by ~47%, while there was no such bias between dose convolved with a beam specific and patient specific PDF. After 8 fractions, final cumulative D99 could be predicted with RMS error <1%. For 90% of patients, the required margins were ≤2, 4, and 3mm, with 70%, 40%, and 33% of patients requiring no RL, AP, and SI margins, respectively.
Conclusions
For protocols with CBCT guidance, RL, AP, and SI margins of 2, 4, and 3mm are sufficient to account for translational errors, however the large variation in patient specific margins suggests that adaptive management may be beneficial.
Keywords: Prostate, Hypofractionation, Intrafraction Motion, Margin, Dosimetric
Introduction
Volumetric imaging (kV and MV CBCT), and fiducial localization methods (Calypso, kV fluoro, EPID) are often used for daily correction of interfractional uncertainties and provide information that can be incorporated into dose verification techniques. For prostate, reduction of interfractional uncertainties has led to reduced margins with intrafractional uncertainties becoming of increased importance for accurate margin assessment (1). Because of this, dosimetric evaluation of prostate intrafraction motion has been the subject of much current research (2–6).
There have been a number of studies evaluating the dosimetric effects of prostate intrafraction motion, some of which have utilized a dose convolution method (2). While a dose convolution has many advantages, it disregards time information; and studies have shown the probability of prostate intrafraction motion to increase with treatment duration (3–5). If beams are consistently delivered in the same order then the probability density function (PDF) will be unique to each beam. Furthermore many image guidance techniques used for intrafraction motion evaluation are utilized after treatment delivery, potentially introducing a bias in the motion measurement. In a recent study, Li et al. quantified the effect of interplay between IMRT delivery and prostate motion, and showed the cumulative effect to be small (6). However this study did not utilize a realistic treatment time frame as treatment delays from MLC motion between segments and gantry rotation were ignored. Therefore, while this study thoroughly quantified the interplay effect, it did not quantify the potential effect from differences per beam in the PDF or the potential dose discrepancy introduced when post-treatment localization is used for the motion measurement. Studies that have accounted for the time dependency have done so using a simulated treatment delivery schedule for synchronization with motion tracks from electromagnetic transponders (7–9). However with these studies synchronization with treatment delivery is simulated and residual setup error is often ignored; whereas some setup uncertainties exist for all protocols in varying magnitude and contribute to dosimetric misses of the target.
Recent studies indicate that prostate intrafraction motion is patient specific (3, 5), which suggests that adaptive motion management may be beneficial. In principle, motion measurements from early fractions may be used to determine the optimal patient specific margins to be applied for subsequent fractions that will minimize dose to surrounding organs at risk while also limiting to a desired criterion the reduction in target dose due to motion. However the majority of previous dosimetric evaluations of prostate intrafraction motion were made using a single choice of margins rather than determining the optimal margin per patient (6, 8), although one study did investigate the dose effect for uniform margins of 0–5mm for a small subset of patients (2).
At our clinic we have available measurements of prostate intrafraction motion relative to the treatment plan acquired at each beam during dose delivery for hypofractionated prostate radiotherapy patients initially aligned using CBCT. The protocol includes intrafraction motion measurements from kV fluoroscopy as well as post treatment CBCT, as has been described in detail previously (10, 11). The purpose of this study is to use this data set to (1) determine appropriate methods to reconstruct dose delivered to the patient during prostate radiotherapy that account for measured intrafraction motion and residual setup error, and apply them to quantify the dosimetric effects of intrafraction motion and residual setup error for a hypofractionated prostate IMRT protocol with CBCT image guidance, and (2) determine necessary patient specific margins in each axis to limit dose reduction to the CTV to a given criteria.
Methods and Materials
An internal review board approved protocol is underway at William Beaumont Hospital for prostate cancer radiotherapy. The protocol consists of hypofractionated prostate IMRT with online CBCT image guidance and intrafraction motion evaluation with kV fluoroscopy. This study evaluates the dosimetric effect of the intrafraction motion and residual setup error for 30 patients who have completed therapy.
Dose Prescription
As part of the protocol, treatment is hypofractionated into 20 fractions of 3.2 Gy for a total of 64 Gy prescribed to the isocenter. The prescription dose was calculated as the equivalent prostate dose to 79.4 Gy delivered in 1.8 Gy fractions, when α/β is set to 4.0 Gy for prostate (12).
Treatment Plan
For image guidance, three gold coils were implanted into the prostate before treatment planning was performed. A helical CT and a Magnetic Resonance Image (MRI) were acquired for treatment planning. The MRI and CT images were fused using a rigid body match, and the prostate was contoured on both images. The contours from the MRI were used to define the Gross Tumor Volume (GTV) if the image fusion could be performed with high accuracy and little visible deformation. For poor fusions contours from the helical CT were used.
The protocol included 14 low risk and 16 intermediate risk prostate patients. For low risk patients the GTV was defined as the prostate and the Clinical Tumor Volume (CTV) was defined as the GTV with no margin. For intermediate risk patients, the CTV was defined as the prostate and seminal vesicles with a 2–4mm margin. For all patients the Planning Treatment Volume (PTV) was defined as the CTV with a uniform 3mm margin. For each patient the treatment plan consisted of step and shoot Intensity Modulation Radiation Therapy (IMRT) using 6 or 15 MV photons at 5–7 gantry angles.
Image Guidance & Motion Analysis
The image guidance procedure and motion analysis have been described in detail elsewhere (10, 11); here we give a brief summary. At each fraction the patient was first aligned to skin marks, after which a CBCT was acquired. The pre-treatment CBCT was reconstructed online and registered to the planning CT using a rigid body gray value registration based on a region of interest chosen to contain the prostate and implanted coils. A couch translation was then performed based on the registration and treatment was delivered. During treatment at each beam kV fluoroscopy was acquired simultaneously with dose delivery. After treatment delivery a post-treatment CBCT was also acquired.
For the retrospective motion analysis, the kV fluoroscopy images acquired between segments were averaged and registered to a template image derived from the post-treatment CBCT. A 3D trajectory of the prostate relative to the treatment plan was estimated by assuming the shortest trajectory that satisfied all 2D localizations and ended at the post-treatment CBCT (4). The error in assuming the shortest trajectory was quantified for prostate in a previous study which showed the root mean square (RMS) error to be ~0.7mm (11). The post-treatment CBCT was registered to the planning CT in the same manner as the pre-treatment CBCT. For all 30 patients, the analysis resulted in prostate position measurements at each beam of 572 fractions, and post-treatment CBCT localizations of prostate position for 552 fractions.
Dosimetric Evaluation
We use a convolution of the planning dose with a PDF derived from the motion measurements to account for the intrafraction motion and residual setup error. The simplest dose convolution to account for intrafractional uncertainties is performed using:
| (1) |
where Dstatic is the ideal static dose distribution from the treatment plan, and PP is a probability density function (PDF) derived from the prostate displacement measurements relative to the treatment plan from all beams and all fractions for the patient of interest. DP is the patient specific convolved dose, but does not account for differences in the PDF for each beam angle that may occur. We can account for differences in the PDF per beam using a modified convolution similar to the segment based convolution proposed by Li et al. (6):
| (2) |
where is the ideal dose distribution from the treatment plan for beam i only, and is the PDF of measured prostate displacement relative to the treatment plan from all kV fluoroscopy motion measurements for all fractions acquired at beam i only. DB is the convolved dose that accounts for beam specific variations in the PDF.
We calculated the target dose using three reconstruction techniques: beam specific and patient specific dose convolution using kV fluoroscopy localizations, and patient specific dose convolution using post-treatment CBCT localizations. The beam specific dose convolution was performed using Equation 2 with the PDFs for each patient being derived from all kV fluoroscopy localizations from all fractions stratified by beam, and this method was considered to most closely represent the actual dosimetric effect. Patient specific dose convolutions were performed using Equation 1 with the PDF for each patient being constructed from all kV fluoroscopy localizations or from all post-treatment CBCT localizations. We compared the discrepancies between the patient specific dose convolution methods and the beam specific dose convolution technique when both the cumulative and single fraction dose was computed. The dose reconstruction techniques are summarized in Table 1.
Table 1.
Dose reconstruction techniques, with corresponding convolution method and intrafraction motion data source.
| dose reconstruction technique | convolution method | motion data source |
|---|---|---|
| beam specific dose convolution* | Equation 2 | kV fluoroscopy |
| patient specific dose convolution | Equation 1 | kV fluoroscopy |
| post-treatment localization | Equation 1 | post-treatment CBCT |
indicates reference case
For dosimetric evaluation, the treatment plan was exported from Pinnacle to the Matlab based Computational Environment for Radiotherapy Research (CERR) (13), and the dose matrix for each beam was exported with 2×2×2 mm3 resolution. Prostate localizations were not available at some beams due to either poor image quality or failure to acquire images. In deriving the beam specific PDFs for each patient, missing prostate localizations were replaced by interpolating the prostate positions from the previous and subsequent beam angles from the same fraction. If the first acquisition was missing it was replaced with the localization at the subsequent beam angle, and if the final acquisition was missing it was replaced with the interpolation of the localization of the previous beam angle and the post-treatment CBCT. Overall, localizations were not available and had to be interpolated for 12.6% of beams.
For each patient we calculated the DVH for the CTV and PTV using the static planning dose, and for the CTV using the convolved dose. We used the minimum dose received by 99% of the CTV (D99) as our dose metric because it is a measure of the minimum dose to the CTV, but is not as highly influenced by statistical noise as the actual minimum. For each patient, cumulative dose metrics were calculated after each fraction.
Margin Analysis
In addition to determining the dosimetric effect for a fixed margin of 3mm, we also determined the necessary margins to limit reduction in target dose due to prostate intrafraction motion to within a given criterion. We estimated the necessary uniform margins to limit the reduction in CTV D99 after convolution to 1%, 2%, and 5%, and we determined the minimum axis specific margins to limit the reduction in CTV D99 to 1%. Our margin calculation was made with the assumption that the desired CTV dose is a uniform distribution at the prescription dose, and that the cutoff criteria for an acceptable plan is that the actual minimum CTV dose is below the prescription dose by no more than 1%, 2%, or 5%. Using this criterion it is in our interest to compare static CTV D99 to the convolved CTV D99, as the minimum static CTV dose is often closer to the prescription dose than the minimum static PTV dose.
To estimate uniform margins, we created treatment plans with uniform margins of 0–8mm at 1mm increments for four patients. The patients chosen included both a low and intermediate risk patient treated at 7 gantry angles with 6 MV photons, as well as both a low and intermediate risk patient treated at 6 gantry angles with 15 MV photons. For each of the 4 sets of patient treatment plans, we convolved the planning dose with each of the 30 patient specific PDFs and calculated the minimum margin required to limit the reduction in CTV D99 to 1%, 2% and 5%. For each PDF this resulted in four estimates of the required uniform margins. For each patient specific PDF we then calculated the mean uniform margin over all 4 patients.
We developed a method to determine the minimum axis specific margins required to limit reduction in CTV D99 to 1%. We began with the original dose matrix and CTV, and iteratively expanded and/or contracted the CTV in each axis in search of the minimum margin that satisfied the dosimetric criteria (reduction in CTV D99 < 1%), assuming that for any axis an increase in dosimetric margin was equivalent to a CTV contraction of the same magnitude. The optimal set of axis specific margins was defined as the set of margins with the smallest sum of squares that still limited reduction in CTV D99 to 1%.
In the case of equal sum of squares, the set of margins with the smallest dose reduction to the modified CTV was selected. After the optimal margin was estimated by modifying the CTV, the treatment plan was re-optimized and the dose was recalculated using the new margins and the process was iteratively repeated until optimal margins were determined. The search was performed at a resolution of 1mm.
Results
Probability Density Functions
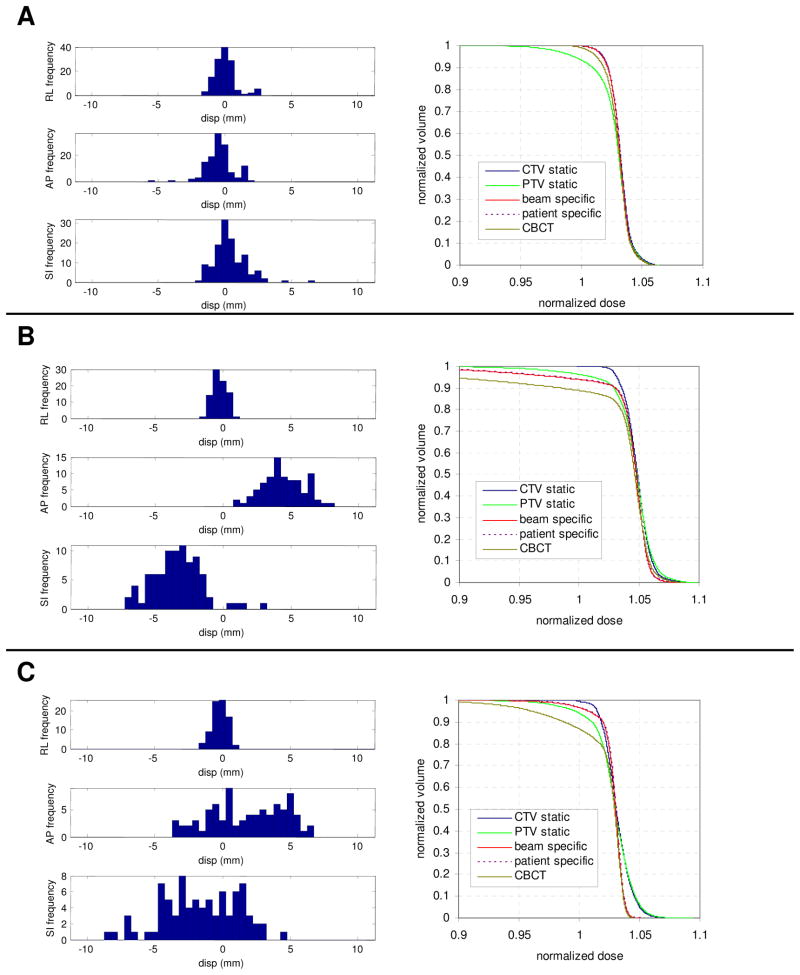
Figure 1A-C shows the motion PDF per axis for various patients. In general, RL motion was of smaller magnitude and was normally distributed. Motion in the AP and SI axes showed more variation between patients, and was not always normally distributed. In Figure 1, patient A had relatively small motion with normally distributed PDFs in all axes, patient B had normally distributed PDFs but a large systematic error in AP and SI, and patient C had widely distributed PDFs in AP and SI.
Figure 1.
Probability distribution function (PDF) in each axis and cumulative dose volume histogram (DVH) for various patients. Patient A had relatively small random and systematic components, with normally distributed PDFs, while patient B had large systematic errors in AP and SI. Patient C had large random errors in AP and SI. Plotted DVHs include the CTV and PTV (CTV + 3mm), and the DVH for the CTV after accounting for the intrafraction motion and residual setup error using a dose convolution utilizing a beam specific PDF, patient specific PDF, and a PDF from post-CBCT.
Dosimetric Effect of Intrafraction Motion
Also shown in Figure 1A–C is the dose volume histogram (DVH) of the CTV and PTV for the same patients, using uniform margins of 3mm. DVHs are given for the static dose and in the case of the CTV, the dose convolved using a beam specific PDF, a patient specific PDF, and a PDF based on post-CBCT. The dose convolution had little effect for patient A, while patient B showed the largest dose reduction. Only for patient B was the CTV convolved dose (beam specific) distribution worse than that of the static PTV.
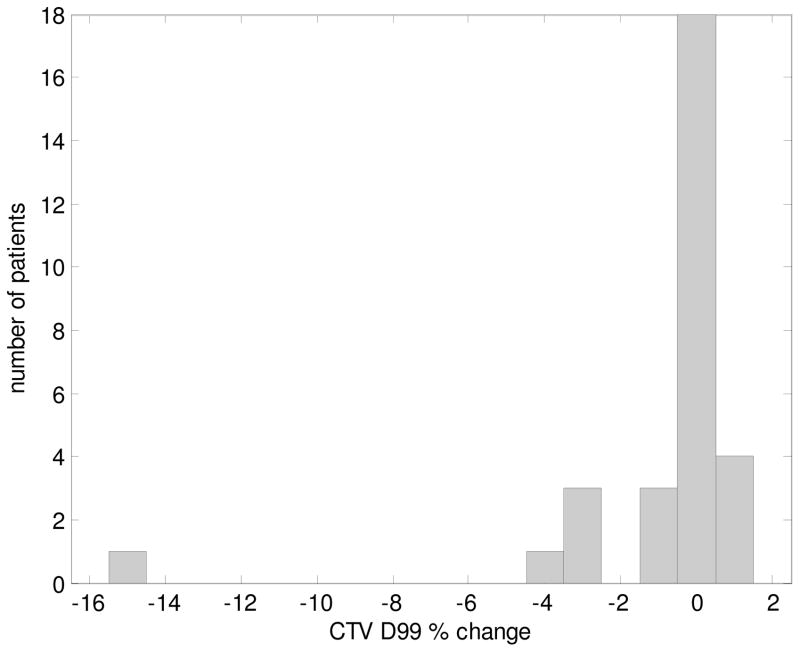
Figure 2 shows a histogram of the percent change in CTV D99 (difference between static and convolved CTV D99) per patient due to intrafractional uncertainties. The change in D99 was within ±5% for all but one case, for which the percent change was −15.3% (Figure 1B).
Figure 2.
Histogram of the percent change in D99 to the CTV per patient.
Cumulative Effect & Predictability
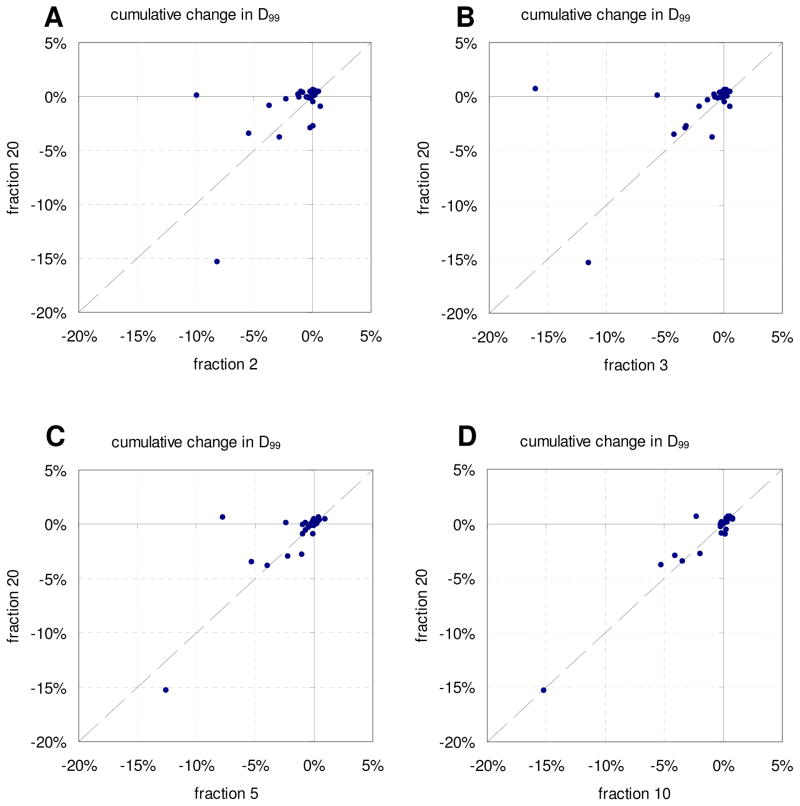
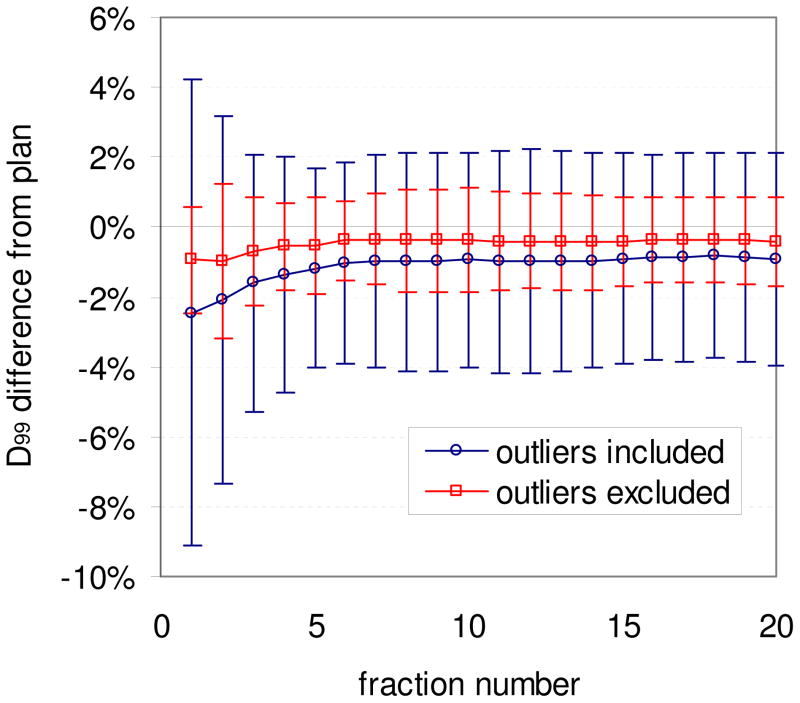
In Figure 3 is cumulative D99 to the CTV after all fractions plotted versus cumulative D99 after two (A), three (B), five (C), and ten (D) fractions. As expected, the percent change in CTV D99 due to motion converged towards the final cumulative CTV D99 with increasing number of fractions. The final cumulative D99 could be predicted with RMS error <1% after 8 fractions. Plotted in Figure 4 is the population mean cumulative difference in CTV D99 after each fraction both including and excluding the two outliers with the largest reductions in D99 (see Figure 3A and 3B), with error bars indicating one standard deviation. Excluding the outliers, the mean population reduction in D99 was ~1% for all fractions, with little change over treatment course. However one of the outlying patients had a discrepancy in D99 after 1 fraction of 35%, which gradually resolved over time. Figures 3–4 indicate that the patient specific cumulative dosimetric effect is generally predictable in early fractions, with error in the prediction decreasing with increasing fraction number. We found no apparent clinical characteristics that set the outliers apart.
Figure 3.
Cumulative change in D99 to the CTV after all fractions versus fraction 2 (A), 3 (B), 5 (C), and 10 (D).
Figure 4.
Population mean cumulative difference in CTV D99 from treatment plan after each fraction, with and without including the two outlying patients. Error bars indicate one standard deviation.
Dose Reconstruction Technique
Table 2 shows the mean, median, 95th percentile, and max discrepancy introduced in CTV D99 during any single fraction and for the cumulative effect after all fractions when the dose convolution was performed using a patient specific PDF rather than a beam specific PDF, both when the patient specific PDF was constructed using prostate localizations from kV fluoroscopy during dose delivery, and using localizations from post-treatment CBCT. When kV fluoroscopy was used there were some single fractions with large motion, with 5% of fractions having a discrepancy >1.83% in D99, however the mean effect was only ~0.5% Overall there was a larger discrepancy when post-CBCT was used, with the discrepancy in D99 exceeding 10.00% for 5% of fractions.
Table 2.
Percent discrepancy from the nominal value of single fraction and cumulative D99 for the CTV, when the per beam changes in probability of motion are ignored. Given is the mean, median, 95th percentile, and maximum of all single fractions, both when the patient specific PDF was constructed using kV fluoroscopy measurements during dose delivery and using post-treatment CBCT localization.
| single fraction | cumulative | |||
|---|---|---|---|---|
| kV fluoroscopy | post CBCT | kV fluoroscopy | post CBCT | |
| mean | 0.51% | 1.88% | 0.19% | 1.12% |
| median | 0.27% | 0.47% | 0.07% | 0.24% |
| 95th percentile | 1.83% | 10.00% | 0.77% | 4.66% |
| max | 10.44% | 43.06% | 1.56% | 8.79% |
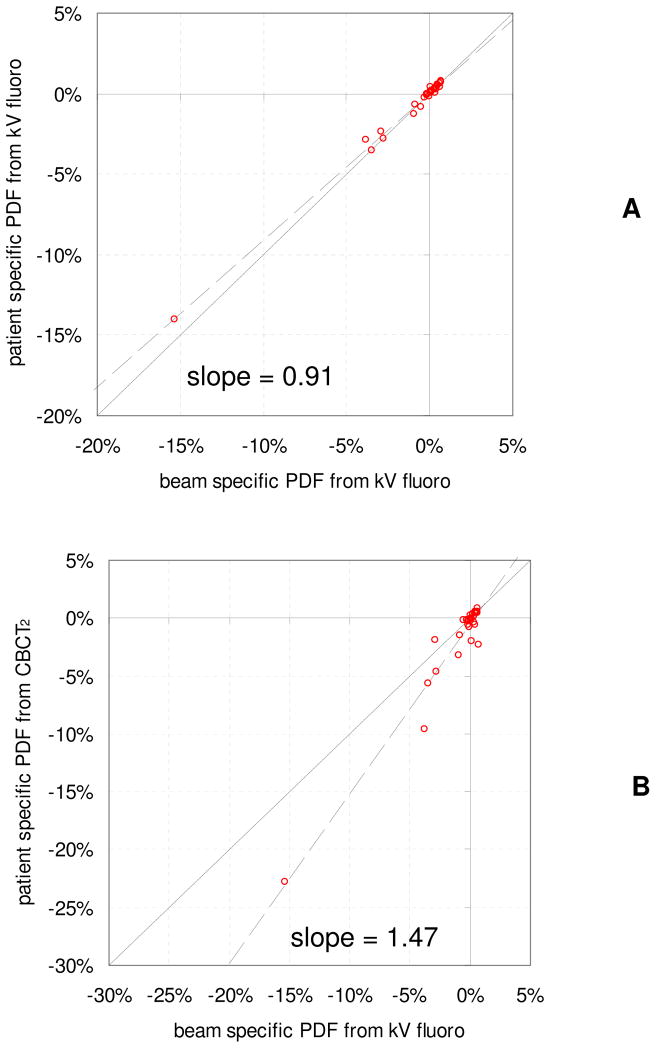
The DVH for the two patients with the largest reduction in CTV D99 is given in Figure 1B and 1C, for which there is virtually no difference between the CTV dose when convolved with a patient specific and beam specific PDF from kV fluoroscopy. However the dose reduction to the CTV was overestimated when the PDF was constructed using measurements from post-treatment CBCT. In Figure 5, D99 to the CTV when a beam specific PDF was used is plotted versus D99 when the convolution is performed for all beams combined (A), and when the PDF is constructed from post-treatment CBCT measurements (B). In (A), the slope is close to 1 with only small differences from the beam specific convolution, indicating that the overall dose reduction is similar for these dose reconstruction methods with only random variations. However in (B), the slope is 1.47 with greater discrepancies, indicating that using localization with post-treatment CBCT for dose reconstruction overestimates the dose effects by approximately ~47%.
Figure 5.
Change in D99 to the CTV when dose is convolved using a patient specific probability density function (PDF) based on kV fluoroscopy measurements during treatment delivery (A) and using a PDF based on post-treatment CBCT localizations (B), as a function the change in D99 when dose is convolved using a beam specific PDF from kV fluoroscopy.
Margin Analysis
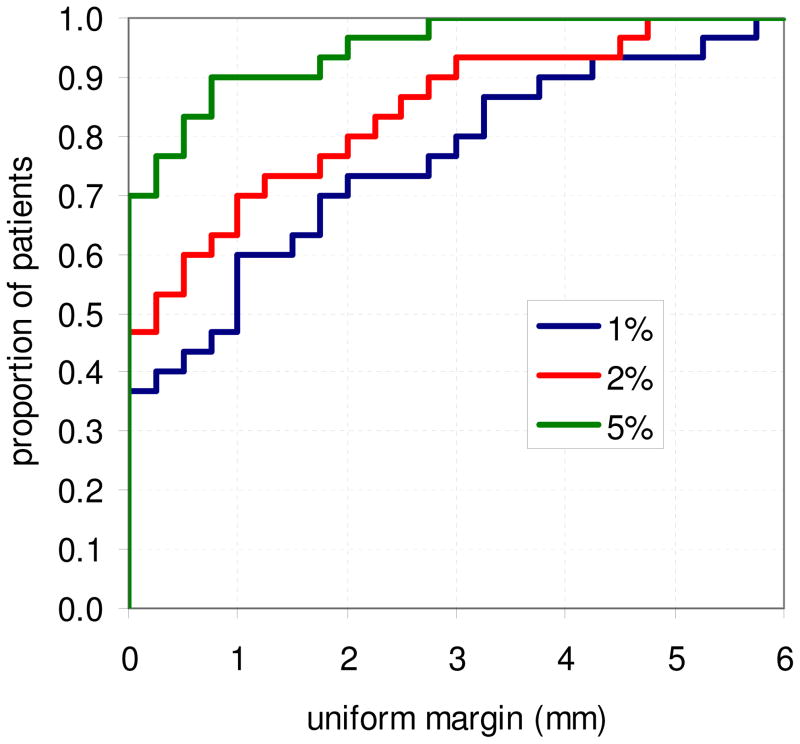
Figure 6 shows the cumulative distribution of required uniform margins to limit reduction in CTV D99 to 1%, 2%, and 5%, where the margins for each patient were estimated using the mean of the four sets of uniform margins. For a maximum D99 reduction of 1%, approximately 37% of patients require no margins, while 90% of patients require a uniform margin at or below 3.75mm. For a maximum D99 reduction of 5%, 70% of patients require no margins, and 90% of patients require a margin at or below ~0.75mm.
Figure 6.
Cumulative histogram of required uniform margins per patient to limit the reduction in D99 to the CTV to 1%, 2%, and 5%. Margins were estimated as the mean margin required for the 4 sets of patient plans with uniform margins.
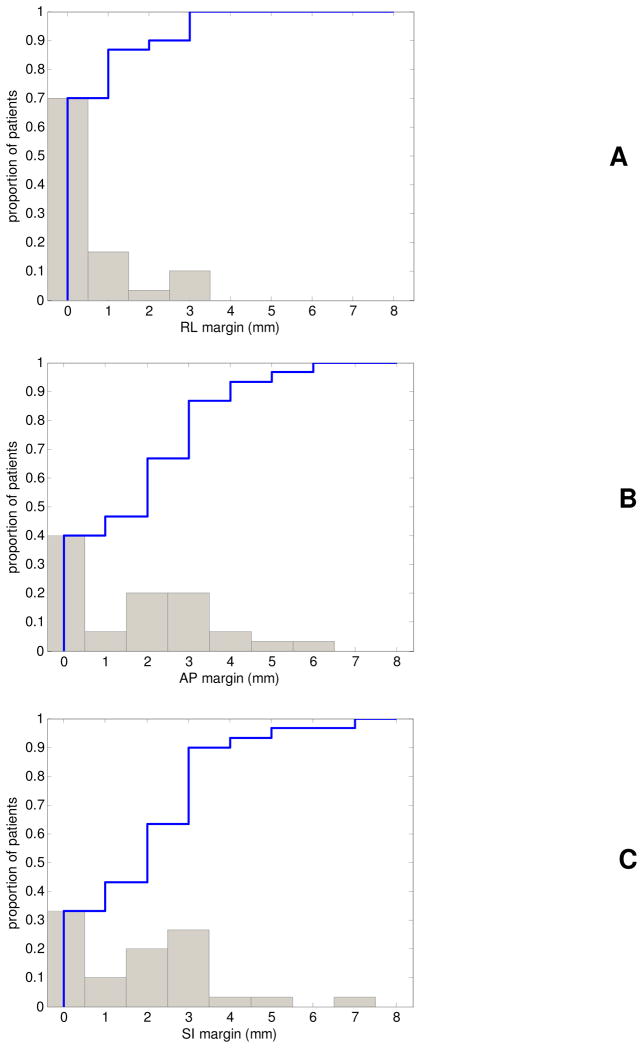
Figure 7 shows the differential (bars) and cumulative (blue line) distribution of axis specific margins in the RL (A), AP (B), and SI (C) axes to limit the reduction in CTV D99 to 1%. The axis specific margins indicated that no RL-axis margins were necessary for ~70% of patients, and that the maximum required RL-axis margins was 3mm. Margins in the AP and SI axes were similar in magnitude and were as large as 7mm for one patient, with 40% and 33% of patients requiring no AP and SI margins, respectively. 90% of patients required RL, AP, and SI margins equal to or below 2, 4, and 3mm, respectively.
Figure 7.
Differential (gray bars) and cumulative (blue line) histogram of required RL (A), AP (B), and SI (C) margins per patient to limit the reduction in D99 to the CTV to 1%.
Discussion
Our analysis indicated that the AP and SI margins varied considerably between patients, with margins in the RL axis being smaller in magnitude. These results are in agreement with previous geometric studies (4, 5, 14), and highlight the potential benefit of adaptive strategies for intrafraction motion management when interfractional uncertainties are corrected online via CBCT image guidance. Figure 3 indicates that the dose reduction for these patients may be predictable, and that adaptive management may be feasible.
Li et al. evaluated the interplay effect for prostate using a segment based dose convolution for select motion tracks and dose plans; they found discrepancies in Dmin to the CTV for a single fraction up to 4.4% using the motion track with the largest standard deviation (6). We investigated dosimetric discrepancies introduced when time dependency per beam is ignored and found the max discrepancy of a single fraction for any patient being 10.44% for D99, however we found the median effect to be small (0.27%). Li et al. observed that the cumulative effect of motion interplay was negligible. In comparison, we found the cumulative discrepancies introduced to CTV D99 from differences in beam specific PDFs was typically negligible, but was as large as 1.56% for one patient.
When post-treatment localization was used for the dosimetric evaluation, the discrepancies introduced were of greater magnitude. The delay between end of treatment delivery and post-treatment CBCT led to exaggeration of the reduction to D99 as large as 8.8% for cumulative dose, and as large as 43% for a single fraction, with the cumulative effect being overestimated by ~47% on average. This emphasizes the importance of synchronized intrafraction motion measurement and dose delivery in order to achieve an accurate dosimetric evaluation. One of the advantages of daily CBCT imaging is the potential for daily dose verification, however our results indicate that caution should be taken when CBCT is used for this purpose. One option to avoid bias is to combine CBCT acquisition with online motion measurements, or to acquire the volumetric image during arc treatment delivery.
Our study is subject to some limitations related to the intrafraction motion measurement that should be considered in conjunction with the results presented here. We utilized motion measurements acquired with a gantry mounted kV imager and assumed the shortest trajectory that satisfies all 2D localizations and ends at the post-treatment CBCT, which will have some localization error. However we expect the dosimetric effect of these errors to be small since simulation studies showed the estimated magnitude of motion to be within 0.2mm from the actual (11).
The dosimetric margins we report are due to translation only, and must be increased to account for the uncertainties we did not account for. Previous studies have shown that prostate delineation errors exist on the order of 0–3mm and are largest in the anterior and posterior directions (15–18). We also ignored prostate deformation and rotation; the random interfractional uncertainty due to deformation has been shown to be 1–2mm (16) while variation in interfractional rotation is highest about the RL-axis at ~4° (17, 18). These uncertainties must also be accounted by additional margins. In a future study, effects of rotation and deformation will be investigated in detail as well as the dose to organs at risk by utilizing contours on the CBCT images and deformable registration to the planning CT (19).
Conclusion
In conclusion, we have evaluated the dosimetric effect of prostate intrafraction motion and residual setup error for a hypofractionated protocol with CBCT image guidance, and found that reduction in CTV D99 was ≤5% for 29 of 30 of patients when 3mm uniform margins were used. Optimal patient specific margins were small in RL (0–2mm) and had a larger range in AP and SI (0–7mm), with over one third of patients requiring no margins. Post-treatment localization for dosimetric analysis led to a 47% exaggeration in dosimetric effects.
Acknowledgments
This work was supported in part by Grant CA118037 from the National Cancer Institute (NCI). The contents are solely the responsibility of the authors and do not necessarily represent the official view of NCI.
Footnotes
Conflict of Interest Notification:
Adamson: None
Wu: None
Yan: None
Publisher's Disclaimer: This is a PDF file of an unedited manuscript that has been accepted for publication. As a service to our customers we are providing this early version of the manuscript. The manuscript will undergo copyediting, typesetting, and review of the resulting proof before it is published in its final citable form. Please note that during the production process errors may be discovered which could affect the content, and all legal disclaimers that apply to the journal pertain.
References
- 1.Litzenberg DW, Balter JM, Hadley SW, et al. Influence of intrafraction motion on margins for prostate radiotherapy. Int J Radiat Oncol Biol Phys. 2006;65:548–553. doi: 10.1016/j.ijrobp.2005.12.033. [DOI] [PubMed] [Google Scholar]
- 2.Li HS, Chetty IJ, Enke CA, et al. Dosimetric Consequences of Intrafraction Prostate Motion. Int J Radiat Oncol Biol Phys. 2008;71:801–812. doi: 10.1016/j.ijrobp.2007.10.049. [DOI] [PubMed] [Google Scholar]
- 3.Ghilezan MJ, Jaffray DA, Siewerdsen JH, et al. Prostate gland motion assessed with cine-magnetic resonance imaging (cine-MRI) Int J Radiat Oncol Biol Phys. 2005;62:406–417. doi: 10.1016/j.ijrobp.2003.10.017. [DOI] [PubMed] [Google Scholar]
- 4.Kotte AN, Hofman P, Lagendijk JJ, et al. Intrafraction motion of the prostate during external-beam radiation therapy: analysis of 427 patients with implanted fiducial markers. Int J Radiat Oncol Biol Phys. 2007;69:419–425. doi: 10.1016/j.ijrobp.2007.03.029. [DOI] [PubMed] [Google Scholar]
- 5.Langen KM, Willoughby TR, Meeks SL, et al. Observations on real-time prostate gland motion using electromagnetic tracking. Int J Radiat Oncol Biol Phys. 2008;71:1084–1090. doi: 10.1016/j.ijrobp.2007.11.054. [DOI] [PubMed] [Google Scholar]
- 6.Li HS, Chetty IJ, Solberg TD. Quantifying the interplay effect in prostate IMRT delivery using a convolution-based method. Med Phys. 2008;35:1703–1710. doi: 10.1118/1.2897972. [DOI] [PMC free article] [PubMed] [Google Scholar]
- 7.Litzenberg DW, Hadley SW, Tyagi N, et al. Synchronized dynamic dose reconstruction. Med Phys. 2007;34:91–102. doi: 10.1118/1.2388157. [DOI] [PubMed] [Google Scholar]
- 8.Langen KM, Lu W, Willoughby TR, et al. Dosimetric Effect of Prostate Motion During Helical Tomotherapy. Int J Radiat Oncol Biol Phys. 2009 doi: 10.1016/j.ijrobp.2008.09.035. [DOI] [PubMed] [Google Scholar]
- 9.Langen KM, Lu W, Ngwa W, et al. Correlation between dosimetric effect and intrafraction motion during prostate treatments delivered with helical tomotherapy. Phys Med Biol. 2008;53:7073–7086. doi: 10.1088/0031-9155/53/24/005. [DOI] [PubMed] [Google Scholar]
- 10.Adamson J, Wu Q. Prostate intrafraction motion evaluation using kV fluoroscopy during treatment delivery: a feasibility and accuracy study. Med Phys. 2008;35:1793–1806. doi: 10.1118/1.2899998. [DOI] [PMC free article] [PubMed] [Google Scholar]
- 11.Adamson J, Wu Q. Optimizing monoscopic kV fluoro acquisition for prostate intrafraction motion evaluation. Physics in Medicine and Biology. 2009;54:117–133. doi: 10.1088/0031-9155/54/1/008. [DOI] [PMC free article] [PubMed] [Google Scholar]
- 12.Kal HB, Van Gellekom MP. How low is the alpha/beta ratio for prostate cancer? Int J Radiat Oncol Biol Phys. 2003;57:1116–1121. doi: 10.1016/s0360-3016(03)01455-x. [DOI] [PubMed] [Google Scholar]
- 13.Deasy JO, Blanco AI, Clark VH. CERR: a computational environment for radiotherapy research. Med Phys. 2003;30:979–985. doi: 10.1118/1.1568978. [DOI] [PubMed] [Google Scholar]
- 14.Huang E, Dong L, Chandra A, et al. Intrafraction prostate motion during IMRT for prostate cancer. Int J Radiat Oncol Biol Phys. 2002;53:261–268. doi: 10.1016/s0360-3016(02)02738-4. [DOI] [PubMed] [Google Scholar]
- 15.Gao Z, Wilkins D, Eapen L, et al. A study of prostate delineation referenced against a gold standard created from the visible human data. Radiother Oncol. 2007;85:239–246. doi: 10.1016/j.radonc.2007.08.001. [DOI] [PubMed] [Google Scholar]
- 16.Nichol AM, Brock KK, Lockwood GA, et al. A magnetic resonance imaging study of prostate deformation relative to implanted gold fiducial markers. Int J Radiat Oncol Biol Phys. 2007;67:48–56. doi: 10.1016/j.ijrobp.2006.08.021. [DOI] [PubMed] [Google Scholar]
- 17.van Herk M, Remeijer P, Lebesque JV. Inclusion of geometric uncertainties in treatment plan evaluation. Int J Radiat Oncol Biol Phys. 2002;52:1407–1422. doi: 10.1016/s0360-3016(01)02805-x. [DOI] [PubMed] [Google Scholar]
- 18.van der Wielen GJ, Mutanga TF, Incrocci L, et al. Deformation of prostate and seminal vesicles relative to intraprostatic fiducial markers. Int J Radiat Oncol Biol Phys. 2008;72:1604–1611. e1603. doi: 10.1016/j.ijrobp.2008.07.023. [DOI] [PubMed] [Google Scholar]
- 19.Schaly B, Kempe JA, Bauman GS, et al. Tracking the dose distribution in radiation therapy by accounting for variable anatomy. Phys Med Biol. 2004;49:791–805. doi: 10.1088/0031-9155/49/5/010. [DOI] [PubMed] [Google Scholar]


