Abstract
The design of oligonucleotide sequences for the detection of gene expression in species with disparate volumes of genome and EST sequence information has been broadly studied. However, a congruous strategy has yet to emerge to allow the design of sensitive and specific gene expression detection probes. This study explores the use of a phylogenomic approach to align transcribed sequences to vertebrate protein sequences for the detection of gene families to design genomewide 70-mer oligonucleotide probe sequences for bovine and porcine. The bovine array contains 23,580 probes that target the transcripts of 16,341 genes, about 72% of the total number of bovine genes. The porcine array contains 19,980 probes targeting 15,204 genes, about 76% of the genes in the Ensembl annotation of the pig genome. An initial experiment using the bovine array demonstrates the specificity and sensitivity of the array.
1. Introduction
Cattle and pigs are globally important for the production of animal protein. Since their genomes are evolutionarily separated by about 60 million years [1], comparative information about the organization and expression of their genomes will accelerate our understanding of the physiology of these species. Recent data from large-scale transcriptome sequencing efforts, and the completion of draft sequence assemblies of the bovine and pig genomes, have stimulated us to use comparative methods for the development of oligonucleotide microarrays as a resource for functional genomics efforts underway in both the agricultural and biomedical domains.
Microarrays previously developed for cattle and pigs have primarily utilized amplified cDNA probes or have designed oligonucleotide probes in the absence of the currently available bovine genome sequence [2, 3]. Further, oligonucleotide array designs have focused almost exclusively on nucleic acid sequences, without invoking more sophisticated annotation techniques that can differentiate orthologous and paralogous genes [4]. Our design has foremost relied on the assignment of bovine and porcine expressed sequences to phylogenetically defined vertebrate proteins. Consensus sequences were created by clustering the ESTs assigned to protein families, and these were aligned to the Btau2.0 draft bovine genome sequence assembly [5] to maximize cardinality and reduce probe redundancy. Probes for the Bovine Oligonucleotide Microarray (BOM) were designed primarily within 3′ biased exons predicted to be constitutively expressed and to have approximately constant Tm and unique representation within Btau2.0. Similarly, porcine expressed sequences were assigned to protein families and clustered against vertebrate protein sequences. However, because a draft genome sequence assembly was not contemporaneously available for swine, genes represented on the BOM were preferentially selected for Swine Protein-Annotated Oligonucleotide Microarray (SPAM) probe design, comparatively tying the porcine transcriptome to the bovine genome sequence assembly. We have also included a set of oligonucleotide probes designed to be used for experimental quality control, which include negative controls and a series of mismatch controls to monitor hybridization stringency.
We describe the design of both microarrays, present a comparative gene ontology between the cattle and pig transcriptomes represented on the microarrays, and report the first application of the bovine array for the analysis of gene expression. Steibel et al. reported on the performance of the swine array, but did not report on the design of the array [6]. In addition, we present a retrospective bioinformatic characterization of the bovine and swine probe set in terms of redundancy, mismatch stringency, and genome representation using the bovine genome assembly build UMD3.0 and the swine genome assembly build Sscr9.
2. Materials and Methods
2.1. Design of Bovine and Swine Oligonucleotides
2.1.1. EST Trimming and Filtering
Bovine and porcine ESTs were downloaded from NCBI dbEST [7] and were trimmed to remove vector and linker sequences (NBCI UniVec database), bacterial contaminants, poly A/T, and low-quality sequences. ESTs smaller than 100 bp were discarded. Low complexity regions were lowercase filtered using DUST [8], and transposable elements were identified and lowercase filtered after searching RepBase [9].
2.1.2. Protein and EST Clustering
Vertebrate proteins (Homo sapiens, Mus musculus, Rattus norvegicus, Gallus gallus, Danio rerio, Takifugu rubripes, and Tetraodon nigroviridis) were downloaded from Ensembl Release 30 [10]. Low complexity regions were lowercase filtered using SEG [11]. An all-versus-all FASTA [12] comparison among proteins was performed using an E-value threshold of 10−6. The FASTA results were used to group homologous proteins using a combination of single linkage and average linkage to generate clusters in which each pairwise identity was at least 50%.
ESTs were compared to the vertebrate proteins using FASTX [13], and then assigned to the most closely related protein family based on the best match protein. Chimeric ESTs identified by alignment over unrelated proteins were discarded. For each set of ESTs, grouped by protein family and species, the TGICL package [14] was used to cluster and assemble ESTs that were at least 95% identical over at least 40 nucleotides and with an overhang of less than 30 nucleotides. TGICL is a wrapper script which first clusters the input sequences based on an all-versus-all pairwise comparison using Megablast [15], and subsequently creates the final assemblies using CAP3 [16]. EST contigs were compared to the vertebrate proteins using FASTX, and contigs appearing to be chimeric based on alignment to unrelated proteins were removed. The EST contigs generated for each species used the following naming convention: “Integer1_CLInteger2ContigInteger3′”, where Integer1 is the Protein Family ID assigned by the protein clustering algorithm, CLInteger2 refers to a particular Megablast Cluster ID (assigned by TGICL) and ContigInteger3 refers to the CAP3 Contig ID (also assigned by TGICL). Similarly, the singletons used the naming convention: “Integer1_GI” where Integer1 is the Protein Family ID assigned by the protein clustering algorithm and GI is the NCBI GI number for the particular EST.
2.1.3. EST Translation, Multiple Sequence Alignment, and Phylogenetic Analysis
Detailed methods for EST translation, multiple sequence alignment and phylogenetic analysis were provided in Venktatraman [17]. Exonerate [18] was used with the protein2dna model to translate each EST contig/singleton by aligning it to the best match vertebrate protein. The “protein2dna” model compares a protein sequence to a translated DNA sequence while incorporating the appropriate gaps and frameshifts. Multiple sequence alignments (MSAs) were generated for EST contigs/singletons and proteins within each protein family using MAFFT and the “einsi” option suitable for MSAs with large unalignable regions [19]. We used a Perl script to edit the MSAs to identify poorly aligned regions using sliding windows that were 90% the length of the longest sequence in the MSA, with a minimum window size of 100 nt. For each MSA, we identified the window containing the fewest gaps. This window was extended until more gaps were encountered. The MSA was trimmed to the extended window, and sequences with gaps in more than 30% of the positions within the window were removed.
We used the Seqboot, Protdist, Fitch, and Consense programs of the Phylip package [20] for phylogenetic analysis. Protein distances for 100 bootstrap replicates for each protein family were calculated using the JTT model of amino acid substitution. Phylogenies were computed using the Fitch-Margoliash criterion [21]. Consensus trees were generated using the MRe option. For each tree, an outgroup was selected based on Ensembl vertebrate proteins present, using the following order of precedence: Takifugu rubripes, Tetraodon nigroviridis, Danio rerio, Gallus gallus, Rattus norvegicus, Mus musculus, and Homo sapiens. Trees were rerooted using the selected outgroup, and a “subtree neighbors” [22] approach was used to identify orthologs within each tree.
2.1.4. Bovine Probes
The EST contigs/singletons were aligned to Btau2.0 using Splign [23]. Genome alignment revealed that repetitive elements were abundant among the protein-coding EST clusters, despite repeat removal using RepBase. To remove protein-coding transposable elements without inadvertently removing transcription factors, the contigs and singletons were searched for PFAM domains [24] found in transposable elements, excluding zinc-finger domains. Following transposable element filtering, 36,547 clusters (22,740 contigs; 13,807 singletons) could be aligned to Btau2.0. After aligning the homologous vertebrate proteins to the bovine genome using Exonerate, the 36,547 EST clusters could be grouped to form 16,849 unique gene loci. Probes were designed from 16,846 ESTs that were derived from the contigs/singletons aligned to the unique gene loci. Constitutive exons were predicted by identifying the regions of each gene's sequence with the highest EST coverage. To do so, coding exons (CDS) predicted by both Splign EST alignment and Exonerate protein alignment were extracted from Btau2.0. The CDS were searched against the unclustered EST dataset to determine which CDS had the greatest EST representation for each gene. Our goal was to represent one constitutive exon rather than multiple alternative exons per gene, in order to sample as many different genes as possible. The following criteria were used in EST selection and probe design: (1) predicted constitutive exon, (2) avoidance of polymorphisms, (3) minimal distance to 3′ end of protein coding region, and (4) optimal Tm and specificity. The probe set was supplemented with oligos designed from 704 predicted RefSeq genes, 5,946 reproductive tissue and other ESTs with a bovine genome alignment but no protein alignment, and 504 controls. Controls include probes designed to monitor the stringency of hybridization, with six mismatch probes (1, 2, 3, 5, 7, and 10 mismatches) designed against 60 contigs with the highest EST count. Negative controls (60 probes) correspond to scrambled sequence without representation in the bovine genome.
2.1.5. Porcine Probes
Porcine contigs were aligned to bovine EST contigs/singletons to further minimize redundancy. Probe design was prioritized by (1) alignment of clusters/sequences to proteins, (2) number of ESTs in clusters, (3) proximity to the carboxy terminus of orthologous proteins, and (4) optimal Tm and specificity. Probe orientation was confirmed by comparison to RefSeq, demonstrating correct orientation of probes designed against 18,244 clusters. Probes were designed against both strands for 300 clusters with evidence supporting transcription in both orientations. The probe set was further supplemented by designing probes against 198 unrepresented porcine RefSeq genes and 1,044 TIGR porcine consensus sequences matching bovine RefSeq transcripts with unambiguous directionality. Controls include probes designed to monitor the stringency of hybridization with six mismatch probes (1, 2, 3, 5, 7, and 10 mismatches) designed against 60 contigs with the highest EST count. Negative controls (60 probes) correspond to scrambled sequence without representation in the bovine genome or pig EST databases. An additional 214 probes were designed against pig contigs with 100% sequence identity over 70 bases with a bovine contig, providing cross-species positive controls. Probes were annotated using descriptions of homologous proteins, including Gene Ontology [25].
2.2. Post Facto Genome-Based Annotation
Annotation of probes on both microarrays was reassessed to take advantage of the most recent builds of the bovine and porcine genomes. To assign annotation to the 23,580 bovine oligo probes the consensus sequences were compared to the UMD2.0 build of the bovine genome [26] with GMAP [27] and the Decypher system GeneDetective program resulting in alignment of 21,976 consensus sequences with coverage ≥50% and identity ≥95%. Of these, 20,336 have coverage ≥95%. Comparison to the annotated transcriptome revealed that 13,939 consensus sequences mapped to the UMD2.0 cDNA with coverage ≥50% and identity ≥95% using the Decypher system BLASTn program. Of these, 8,014 have ≥95% coverage. The remaining 9,051 consensus sequences were queried by BLAST against the Ensembl (release 52) bovine cDNA set with 873 consensus sequences mapping with coverage ≥50% and identity ≥95%. Of these, 264 have ≥95% coverage. The remaining 7,888 unassigned sequences were queried by BLAST against the NCBI bovine cDNA set with 315 consensus sequences mapping with coverage ≥50% and identity ≥95%. Of these, 180 have coverage ≥95%. The remainder were queried by BLAST against NCBI human cDNA with 3,703 alignments with an E-value <1e − 20. In total, 18,830 consensus sequences align to a cDNA and 4,750 have no gene assignment and may represent unannotated genes. Suspected chimeric consensus sequences were identified as those sequences where the 70 bp oligo portion of the consensus sequence lies outside of the portion of the consensus sequence that aligns to the genome. For 127 consensus sequences fitting this criterion, the nonaligning portion of the consensus sequence was aligned to the genome using GMAP producing 27 alignments with coverage ≥50% and identity ≥95%. In total, 18,207 consensus sequences have both gene assignments and genomic alignments, 3,769 have exclusively genomic alignments, 585 have exclusively gene assignments, and 1,016 have no alignment to either cDNA or the genome. These unannotated sequences correspond to 995 ESTs from a variety of sources and 23 contigs.
To assign annotation to the 19,980 pig oligo probes, the consensus sequences were compared to the Sscr9 build of the swine genome (Ensembl release 56) with GMAP and Decypher resulting in alignment of 14,919 consensus sequences with coverage ≥50% and identity ≥95%. Of these, 12,600 have coverage ≥95%. Comparison to the annotated transcriptome revealed that 9,329 consensus sequences mapped to the Sscr9 cDNA (Ensembl release 56) with coverage ≥50% and identity ≥95% using the Decypher system BLASTn program. Of these, 5,227 have ≥95% coverage. An additional 89 consensus sequences aligned to NCBI pig cDNA sequences and 8,827 aligned to NCBI human cDNA with an E-value <1e − 20. In total, 13,950 consensus sequences have both gene assignments and genomic alignments, 969 have only genomic alignments and 4,295 have exclusively gene assignments. Only 766 consensus sequences have no annotation, comprised of 58 tentative consensus sequences (TCs), 699 contigs and 9 provisional RefSeqs no longer included in the NCBI porcine annotation.
2.3. Array Printing, Tissue Samples, and Experimental Design
The microarrays were printed from 384-well plates in which the synthetic 70-mer single stranded oligodeoxyribonucleotides were dissolved to 20 micromolar in 3X SSC and to a final volume of 15 microliters. Printing was performed using a Genomic Solutions Omnigrid 300 microarray printer, equipped with a Telechem Stealth 48 pin print head containing SMP3 pins. The print format produces a single array containing 12 metarows and 4 metacolumns, with each subarray containing 25 columns and 21 rows and with an element center-to-center spacing of 170 × 165 micrometers. SPAM arrays are available through the pig array website pigoligoarray.org. BOM arrays are available on request from Jerry Taylor, University of Missouri. Microarrays were baked after printing for 2 hr at 80°C. Slide rehydration was performed over 50°C water, followed by snap drying on a 65°C heating block for 5 sec; this process was repeated three times. Slides were UV-crosslinked at 120 mJ, washed in 1% (w/v) SDS for 5 min at room temperature, then in water, and were finally spin dried by centrifugation at 1,000 g for 2 min.
Six bovine tissue samples (small intestine, spleen, liver, adrenal gland, anterior pituitary, and thymus) were collected after slaughter from each of 6 Angus steers at 14 months of age following approved animal use protocols. The tissue samples were immediately frozen on dry ice and stored at −80°C prior to RNA extraction. RNA was extracted and cDNA synthesized at the University of Missouri (MU) and aliquots of dye-labeled cDNA samples were used to replicate all hybridizations at the University of Minnesota (UMN) and at MU. At each location, samples were hybridized to 36 microarrays using a loop design with like tissues hybridized to the same array and with duplicate samples labeled with Cy3 and Cy5 as technical replicates.
2.4. Reverse Transcription and Array Hybridization
Total RNA was extracted using 3 ml of TRI reagent (Ambion, Austin, TX) per 250–300 mg of tissue from each sample. The extract was treated with 0.02 Units of DNase1 (Ambion) and cleaned up using phenol : chloroform : isoamyl alcohol (25 : 24 : 1), a Phase Lock Gel Heavy tube (Eppendorf, Hamburg, Germany), and a YM30 microcon tube (Millipore, Billerica, MA). Five micrograms of total RNA was used to synthesize cDNA for each dye using 8 thermal cycles at 52°C for 10 sec and 44°C for 15 min. The reaction was stopped with 3.5 μL of 0.5 M NaOH/50 mM EDTA and then heated at 65°C for 15 min. The solution was neutralized with 5 μL of 1 M Tris-HCl (pH 7.5). Finally, 10 μL of cDNA was purified using a MinElute PCR purification kit (Qiagen, Valencia, CA).
The microarrays were prehybridized for 1 hr with 0.2% I-Block (Tropix, Bedford, MA) in 1X PBS solution at 42°C then were washed with distilled water at room temperature for 10 min and finally were again washed with isopropanol at room temperature for 5 min using a rotary shaker. The arrays were dried by centrifugation for 5 min at 1000 g. The cDNA and fluorescence dye hybridization steps were accomplished by a modification to the 3DNA array 350 kit protocol (Genisphere Inc., Hatfield, PA). A total of 20 μL of Cy3 (10 μL) and Cy5 (10 μL) labeled cDNA samples was hybridized to each array at 55°C in a water bath for 16 hr in a dark humidified chamber. The arrays were then washed for 15 min with 2X SSC/0.2% SDS at 55°C, for 15 min in 2X SSC at room temperature, and finally washed again for 15 min in 0.2X SSC at room temperature. The arrays were again dried by centrifugation for 5 min at 1000 g. Both Cy3 and Cy5 capture reagents were combined with the hybridization buffer and were hybridized to an array for 4 hr at 55°C in a water bath. The arrays were rewashed and dried as previously described [28].
2.5. Data Extraction and Normalization
At MU the arrays were immediately scanned on an Axon Genepix 4000B laser scanner (Axon Instruments, Foster City, CA), while at UMN, the arrays were scanned on a GSI Lumonics ScanArray 5000 laser scanner (GSI Lumonics, Watertown, MA). The image data were extracted using BlueFuse for microarrays (BlueGnome, Cambridge, UK) and spots with a quality score of 0 or with a confidence score of less than 0.1 were removed from the data. The filtered data for each array were log2 transformed and within slide normalized by performing a confidence-weighted LOESS regression for each print tip to correct for an physical effects introduced by the printer head as well as to compensate for other spatial variation across the slides [29]. Scale differences between slides due to variations in scanner settings and sample preparation were corrected for by standardizing intensity values to have a zero mean and unit variance using JMP Genomics (SAS Institute, Cary, NC). Intensity data were extracted using customized PERL scripts and data were plotted using R [30]. The experimental data has been uploaded to the GEO database (GEO ID GSE23837).
3. Results/Discussion
3.1. Array Annotation
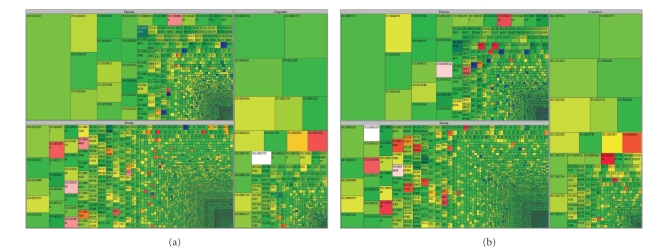
The bovine array contains 23,580 probes with 18,830 mapped to cDNA. Considering that some gene products are targeted by more than one probe the 18,830 mapped probes represent 16,341 unique genes. Gene Ontology (GO) annotation [25] for the bovine and porcine genomes from Ensembl BioMart (release 56) [31] was used to assign functional annotation to the genes represented on the arrays. For the 16,341 unique gene transcripts represented on the array, bovine GO annotation was retrieved for 9,446 transcripts. For the remaining transcripts with no bovine GO annotation 2,745 GO terms were transferred from orthologous human cDNAs resulting in a total of 12,191 GO annotated transcripts. Functional coverage of the genes on the array was measured by comparing the bovine GO terms with the available GO annotated human genes (18,110). The treeplot in Figure 1(a) shows the ontological coverage of the array as compared to the human GO annotation for the three categories of GO annotation: molecular function, biological process, and cellular component. In Figure 1(a), each block represents a GO term with the size of the block being proportional to the number of human genes assigned that GO term. The color of the block indicates whether the term is over- or underrepresented on the array in comparison to the human genome. The probes on the bovine array fall into the annotation categories in generally the same proportions as do the genes in the human genome, indicating that the microarray provides a broad and even coverage of bovine gene function. Some exceptions include the biological process categories of sensory perception of smell (olfaction), modification-dependent protein catabolic processes, and interspecies interaction between organisms and the molecular function category of olfactory receptor activity (ORA) which are represented at less than 5% of their level in the human genome. The molecular function categories of catalytic activity, protein tyrosine kinase activity, and protein kinase activity are overrepresented on the array by over 10-to-one as compared to the human genome.
Figure 1.
Ontological coverage of (a) the BOM, and (b) SPAM oligonucleotide microarrays. The classes of proteins represented by oligonucleotides were analyzed by comparing the proportion of bovine Gene Ontology (GO) terms connected to the BOM and SPAM targets. All bovine GO terms were extracted from NCBI and are displayed using Treemaps, divided into the three ontologies (biological process, molecular function, and cellular component). The number of bovine genes per GO term is proportional to block size and the ratio of BOM or SPAM representation for each GO term is indicated by color; black = no probes, from white (50-fold lower) to blue (10-fold lower) indicates under-representation, green indicates equal representation, from yellow (10-fold higher) to red (≥50-fold higher) indicates over-representation. The number of blocks, their size, and their color is a global overview of GO representation.
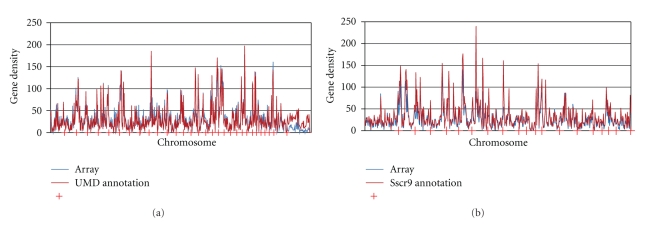
The cDNA annotation for the UMD2.0 bovine genome build has 22,447 genes, excluding pseudogenes. There are 16,341 unique genes represented on the bovine array providing a gene representation of about 72%. The microarray's physical coverage of the bovine genome is shown in Figure 2(a). The density of the 21,976 probes with assigned genomic coordinates is plotted against the density of all annotated genes across the 29 bovine autosomes and the X chromosome, plus the unassigned contigs (U). The physical distribution of genes represented on the array closely mirrors the distribution of all genes on the array except for a few small regions of high gene density. An under-represented area on chromosome 15 (45–55 Mb) contains 246 genes, 231 with the ORA GO term. Another under-represented region on chromosome 10 (20–30 Mb) contains 244 genes, 116 with the ORA GO term.
Figure 2.
Genome-wide representation of oligonucleotide target sequences on the BOM and SPAM. The positional distribution of targets (blue) is plotted relative to the (a) bovine (BOM), or (b) porcine (SPAM) chromosomes (red) to demonstrate the genome-wide representation of targets on the microarray.
The physical and functional distribution of genes represented on the porcine array was likewise analyzed, although the lower refinement of the swine genome assembly resulted in a corresponding decrease in the total number of probes with GO annotation. The 18,245 probes on the array that map to cDNA represent 15,204 unique gene transcripts. Porcine GO annotation was available for 9,418 and GO terms were transferred from 5,964 orthologous human cDNA for a total of 11,738 GO annotated transcripts. Functional coverage of the array is shown by a treeplot comparison to annotated human genes in Figure 1(b). The porcine array is deficient in some of the same categories as the bovine array, including olfactory receptor activity and interspecies interaction between organisms. The physical coverage of the array is shown in Figure 2(b). Several gene-rich regions of the genome are under-represented on the array, such as from 20–30 Mb on chromosome 7 containing 377 genes, 116 with the ORA GO term, and the first 10 Mb of chromosome 9 which contains 246 genes, 166 with the ORA GO term.
Both arrays show a deficiency in representation of genes in the olfactory receptor gene family. This can be attributed to low representation in the initial bovine EST set where only 37 ESTs matched just 30 different ORA genes.
The specific location of a probe sequence within a gene is important for interpreting the magnitude of gene expression reported by a microarray. Alternative splicing, cotranscription, and distance from the 3′ end of the transcript all affect signal strength. The strength of the annotation assigned to a probe is also best understood within the context of a gene browser that displays ESTs, cDNA alignments, and other supporting evidence for a gene annotation. To this end, four distributed annotation system (DAS) sources are available from http://gnomix.ansci.umn.edu:9000/das for viewing the alignments of array probes and consensus sequences to genomic reference sequences using the Ensembl genome browser. The UMN_Btau_BOM Consensus and UMN_Btau_BOM Oligo sources provide the alignments of sequences to the Btau4.0 reference sequence, and the UMN_Sscr_SPAM_Consensus and UMN_Sscr_SPAM_Oligo sources provide the alignments of SPAM sequences to the Sscr9 reference sequence. These alignments are helpful for further investigating probes identified as differentially expressed, such as for determining which exon(s) are detected by a probe, and therefore which isoforms of a gene are being detected. An example of this was observed for the consensus sequence corresponding to the HNF4a gene (Figure 3), where the consensus sequence aligns to the first three exons of the gene as well as a portion of intron 3. A probe designed against this intron detects expression of this alternative splice form, a fact verified by reverse transcription PCR (data not shown). For those probes that do not align to a cDNA sequence but do align to the genome, this alignment will facilitate the discovery and annotation of new genes. Bovine and porcine platform details were submitted to the NCBI GEO database (GEO GPL8813 and GPL7435).
Figure 3.
A portion of the HNF4a gene as displayed by the Ensembl Genome Browser. The Ensembl gene track (red) shows the Ensembl-annotated gene structure. The consensus sequence of a probe (purple track) aligns to three exons and a portion of a predicted intron. The short probe sequence (cyan track) aligns to the intron indicating that the probe detects expression of a previously unannotated splice form of the gene.
Existing whole-genome gene expression microarrays include commercial platforms from Agilent and Affymetrix as well as noncommercial cDNA and oligonucleotide arrays. The Agilent bovine and porcine arrays each carry 43,803 probes. The Affymetrix bovine and porcine arrays carry between 23,000 and 24,000 probe sets. These commercial platforms are not directly comparable to the SPAM and BOM oligo microarrays as they use different hybridization techniques. EADGENE has released a similar 70-mer oligo array (GEO GPL5972) with 20,515 probes, 13,599 of which have been mapped to unique human genes. The SPAM probes have been mapped to 14,136 unique human genes, with 11,280 genes represented on both arrays. Both arrays have similar coverage of the genome, but the SPAM array is the result of a different design methodology and is publicly available. The bovine array is a significant improvement in coverage over previous whole-genome two-color arrays such as the 7,872 cDNA array from the University of Illinois (GEO GPL2108).
3.2. Microarray Performance
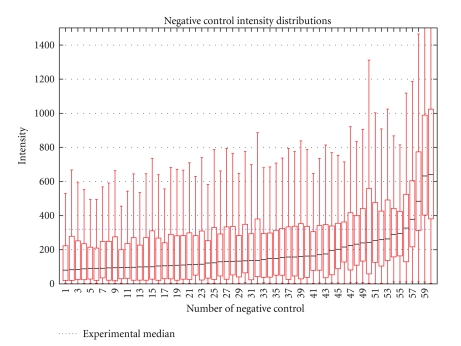
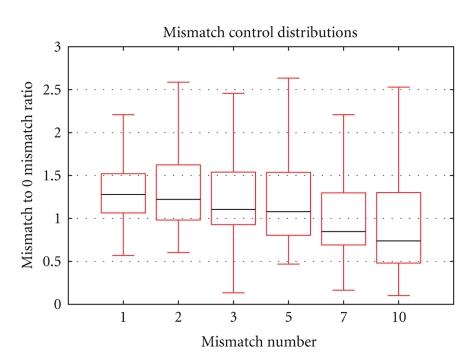
A total of 72 hybridizations to the bovine array were performed to assess the specificity, stringency, and repeatability of the platform. To measure the specificity of the hybridization conditions, the expression levels detected by the negative control probes were compared to those for the experimental probes. The expression distributions of the 60 negative control probes are plotted in Figure 4, with the median expression level of all experimental spots shown in blue. The median experimental expression level is 3 times greater than the median negative control expression level indicating strong specific hybridization in the experiment. However, 7 negative control probes detected mean expression levels greater than the mean for the experimental probes. The oligo sequences for these probes had no BLAT hits against the UMD3.0 bovine genome assembly or BLAST hits against the NCBI dbEST database. Despite no sequence-based evidence that these seven negative controls inadvertently target transcripts, due to the high level of mRNA expression detected by these probes, they are not suitable as negative controls. Analysis of the series of 60 mismatch probes also provided a measure of specificity of the hybridization reaction. Figure 5 shows the decline in detected expression relative to the 0 mismatch probe as the number of mismatches in each probe sequence increases. As expected, detected expression decreases as the number of mismatches in the probe sequence increases.
Figure 4.
Signal distribution of BOM negative controls. The median signal intensity for negative controls was calculated and compared to the average signal from noncontrols (blue line). The minimum and maximum intensity values for each negative control (vertical lines), the first and third quartiles (white boxes which contain 50% of the values), and the median (black line) are presented. Summary of results from 72 hybridizations representing 6 tissues from 6 animals, with two technical replicates at two locations is presented.
Figure 5.
Differential signal detection from mismatch-target oligonucleotides on the BOM array. The normalized signal intensity from target oligonucleotides with 1, 2, 3, 5, 7, and 10 mismatches are presented as a percentage of the log intensity for their respective perfect match target oligonucleotides. The minimum and maximum values for each number of mismatches (vertical lines), the first and third quartiles (white boxes which contain 50% of the values), and the median (black line) are presented.
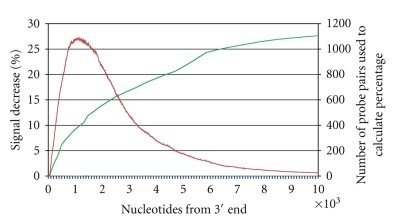
The location of a probe in relation to the 3′ end of a transcript has been shown to be related to the detected expression intensity presumably due to the premature termination of reverse transcription using poly-dT primed reactions [32]. A series of distance controls was also included on the bovine array to allow quantitation of this effect. Twenty one of the 60 mismatch control genes for which the RefSeq sequence was greater than 1800 bases were selected for the design of distance controls. For each sequence, four probes were designed with the first probe located within 500 bases of the 3′ end, the second probe within the region 500–1000 bp from the 3′ end, and so on. An additional 1,740 cDNAs have between 2 and 7 probes mapped to them. To determine the effect of probe distance from the 3′end of the transcript, expression levels detected by each of these probes were compared. For each adjacent probe pair, the mean decrease in signal (as a percentage, using the raw data from 144 measurements) between the two probes was calculated. The percent signal decrease was divided by the number of bases separating the probes to normalize for the distance between the two probes. The per-nucleotide percent decrease for all probe pairs was averaged to obtain an estimate of the effect of probe location on signal intensity. Figure 6 shows that the majority of probe pairs lay between 500 and 2500 kb of the 3′ end of their transcript, and that signal intensity drops between 6 and 15 percent over that range. Therefore probes far from the 3′ end of transcripts will systematically detect lower levels of expression than will probes lying near the 3′ end [33]. However, the relatively small decrease in detected intensity should have a marginal effect on the ability of the array to detect transcripts, and the relative differences in expression between cDNA samples should still be proportional to gene expression. Nevertheless, when conducting follow-up qRT-PCR validation of microarray results, it is important to design primers in the same location as the probe for the most reliable replication of the microarray results, but near the 3′ end for the most accurate measurement of transcript abundance. The performance characteristics of the positive and negative controls on the porcine array have previously been reported by Steibel et al. [6], who showed performance similar to the bovine array.
Figure 6.
Correlation between log-intensities (green curve) from multiple target oligonucleotides predicted to lie within the same gene according to distance of the target from the 3′ transcript end. The red line shows the number of probe pairs used to estimate the signal drop.
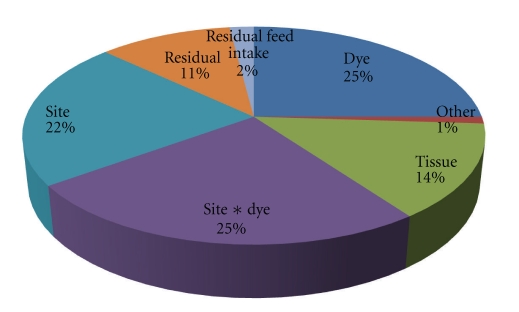
The same 36 array experiment was completed at two different labs by different personnel using slightly different techniques allowing the measurement of the overall variability present in expression measurements using the array. Principal component analysis of the data revealed that 46.56% of the total variance was assigned to site and site∗dye effects indicating that all sources of variation introduced in an offsite replication of an experiment are significant (Figure 7). However, these effects can be modeled using an appropriate linear model when analyzing the data.
Figure 7.
Sources of variability in Principal Components 1 through 3 (30.79% of Total Variance) in a 36 slide microarray experiment replicated at two locations. The majority of variation is due to dye and site effects, which can be controlled for during the data analysis. Tissue and residual feed intake (an experimental condition not analyzed for this paper) contribute measurable amounts of variation to expression levels enabling detection of differential expression.
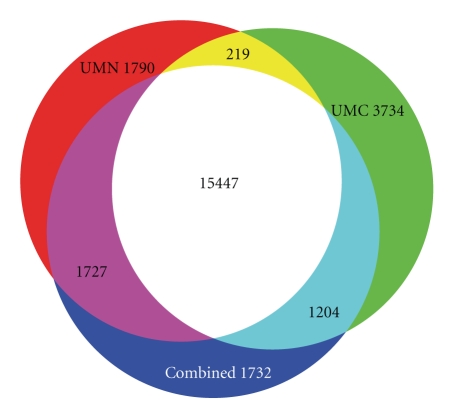
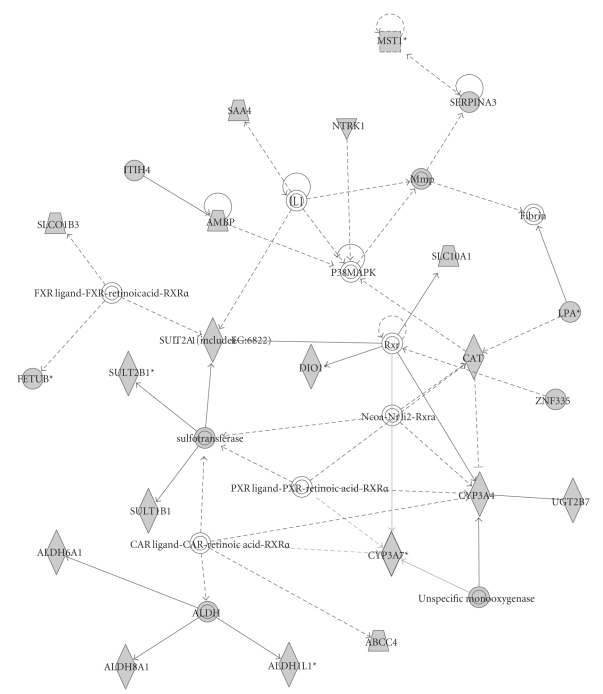
A total of 17,648 probes (74%) were determined to detect gene expression in at least one of the six tissues as summarized in Table 1. Expressed genes were determined using a two-sample t-test, where data from each unique spot × tissue combination were tested against the mean of the negative control probes. Tissue-specific genes are defined as those genes expressed in only one tissue with a pFDR of 0.0001. The observed range of 1–3% of probes which exhibit tissue-specific expression and 15% of probes which detect expression in a specific tissue is similar to previous studies in human, although direct comparison is difficult due to differences in methodology and numbers of tissues studied [34, 35]. When data from the two locations were analyzed separately, the probes identified as detecting expression were similar, with a 77% overlap (Figure 8). To further demonstrate the specificity of the array, the 729 probes that detected expression only in liver were selected for network analysis using Ingenuity Pathways Analysis (IPA). IPA identified several networks of interacting genes which included a significant number of genes involved in liver-specific functions. An example is the drug and lipid metabolism network shown in Figure 9. The six tissues selected for analysis are overrepresentative of endocrine tissues; however due to its whole-genome design the array should perform similarly when studying other tissues of interest in livestock species such as skeletal muscle and adipose tissue.
Table 1.
Bovine Oligonucleotide Microarray probes with statistically significant expression.
| Tissue | Probes Detecting Expression | Probes Detecting Tissue Specific Expression |
|---|---|---|
| Adrenal Gland | 13,462 | 681 |
| Anterior Pituitary | 12,793 | 587 |
| Liver | 11,959 | 729 |
| Small Intestine | 8,240 | 496 |
| Spleen | 12,861 | 719 |
| Thymus | 10,385 | 441 |
| Any | 17,648 | — |
| All | 6,799 | — |
“Any” refers to the number of nonredundant genes detected as expressed in at least one tissue. “All” refers to the number of genes detected as expressed in all tissues with a positive false discovery rate (pFDR) of 0.01. “Tissue specific” refers to genes detected as being expressed in only one tissue with a pFDR of 0.0001.
Figure 8.
Venn diagram showing the overlap between probes detecting gene expression from the analysis of the University of Minnesota (UMN), University of Missouri (UMC), and combined UMN-UMC data. When the UMN and UMC data were separately analyzed 77% of the probes identified as detecting gene expression were common between both data sets. When the data sets were combined an additional 1,732 probes (7%) were identified as detecting gene expression.
Figure 9.
A network identified by Ingenuity Pathway Analysis of 23 liver-specific genes involved in small molecule biochemistry, drug metabolism, and lipid metabolism.
4. Conclusion
Designing whole-genome oligonucleotide microarrays for species without a completely sequenced genome remains a challenge. This study introduces a phylogenomic approach to design oligonucleotide sequences in species with disparate volumes of genome and EST sequence information. Leveraging genomic data from related and better studied organisms enables the design of microarrays that maximize cardinality and reduce probe redundancy. The bovine microarray introduced here represents a significant improvement in genome coverage over older two-color microarray designs. The porcine array, while similar in coverage to another porcine microarray, was designed using a different method. The performance of the bovine microarray and the annotation developed for it shows it to be a suitable platform for use in genome-wide expression studies.
Acknowledgments
This work was supported by National Research Initiative (NRI) Grant nos. 2005-35205-15448, 2005-35604-15615, 2006-35205-16701, 2006-35616-16697, and 2007-35616-17882 from the USDA Cooperative State Research, Education and Extension Service (CSREES); and the swine oligonucleotide design was supported in part by funding from the USDA NAGRP NRSP-8. This work was also supported in part by the University of Minnesota Supercomputing Institute. Christine G.Elsik and Scott C. Fahrenkrug contributed equally to this work.
References
- 1.Kumar S, Hedges SB. A molecular timescale for vertebrate evolution. Nature. 1998;392(6679):917–920. doi: 10.1038/31927. [DOI] [PubMed] [Google Scholar]
- 2.Suchyta SP, Sipkovsky S, Kruska R, et al. Development and testing of a high-density cDNA microarray resource for cattle. Physiological Genomics. 2004;15(2):158–164. doi: 10.1152/physiolgenomics.00094.2003. [DOI] [PubMed] [Google Scholar]
- 3.Zhao SH, Recknor J, Lunney JK, et al. Validation of a first-generation long-oligonucleotide microarray for transcriptional profiling in the pig. Genomics. 2005;86(5):618–625. doi: 10.1016/j.ygeno.2005.08.001. [DOI] [PubMed] [Google Scholar]
- 4.Li X, He Z, Zhou J. Selection of optimal oligonucleotide probes for microarrays using multiple criteria, global alignment and parameter estimation. Nucleic Acids Research. 2005;33(19):6114–6123. doi: 10.1093/nar/gki914. [DOI] [PMC free article] [PubMed] [Google Scholar]
- 5.Liu Y, Qin X, Song XZH, et al. Bos taurus genome assembly. BMC Genomics. 2009;10, article 180 doi: 10.1186/1471-2164-10-180. [DOI] [PMC free article] [PubMed] [Google Scholar]
- 6.Steibel JP, Wysocki M, Lunney JK, et al. Assessment of the swine protein-annotated oligonucleotide microarray. Animal Genetics. 2009;40(6):883–893. doi: 10.1111/j.1365-2052.2009.01928.x. [DOI] [PubMed] [Google Scholar]
- 7.Boguski MS, Lowe TMJ, Tolstoshev CM. dbEST—database for ’expressed sequence tags’. Nature Genetics. 1993;4(4):332–333. doi: 10.1038/ng0893-332. [DOI] [PubMed] [Google Scholar]
- 8.Morgulis A, Gertz EM, Schäffer AA, Agarwala R. A fast and symmetric DUST implementation to mask low-complexity DNA sequences. Journal of Computational Biology. 2006;13(5):1028–1040. doi: 10.1089/cmb.2006.13.1028. [DOI] [PubMed] [Google Scholar]
- 9.Jurka J, Kapitonov VV, Pavlicek A, Klonowski P, Kohany O, Walichiewicz J. Repbase Update, a database of eukaryotic repetitive elements. Cytogenetic and Genome Research. 2005;110(1–4):462–467. doi: 10.1159/000084979. [DOI] [PubMed] [Google Scholar]
- 10.Hubbard T, Andrews D, Caccamo M, et al. Ensembl 2005. Nucleic Acids Research. 2005;33(supplement 1):D447–D453. doi: 10.1093/nar/gki138. [DOI] [PMC free article] [PubMed] [Google Scholar]
- 11.Wootton JC, Federhen S. Analysis of compositionally biased regions in sequence databases. Methods in Enzymology. 1996;266:554–571. doi: 10.1016/s0076-6879(96)66035-2. [DOI] [PubMed] [Google Scholar]
- 12.Pearson WR, Lipman DJ. Improved tools for biological sequence comparison. Proceedings of the National Academy of Sciences of the United States of America. 1988;85(8):2444–2448. doi: 10.1073/pnas.85.8.2444. [DOI] [PMC free article] [PubMed] [Google Scholar]
- 13.Pearson WR, Wood T, Zhang Z, Miller W. Comparison of DNA sequences with protein sequences. Genomics. 1997;46(1):24–36. doi: 10.1006/geno.1997.4995. [DOI] [PubMed] [Google Scholar]
- 14.Pertea G, Huang X, Liang F, et al. TIGR gene indices clustering tools (TGICL): a software system for fast clustering of large EST datasets. Bioinformatics. 2003;19(5):651–652. doi: 10.1093/bioinformatics/btg034. [DOI] [PubMed] [Google Scholar]
- 15.Zhang Z, Schwartz S, Wagner L, Miller W. A greedy algorithm for aligning DNA sequences. Journal of Computational Biology. 2000;7(1-2):203–214. doi: 10.1089/10665270050081478. [DOI] [PubMed] [Google Scholar]
- 16.Huang X, Madan A. CAP3: a DNA sequence assembly program. Genome Research. 1999;9(9):868–877. doi: 10.1101/gr.9.9.868. [DOI] [PMC free article] [PubMed] [Google Scholar]
- 17.Venktatraman A. Validation of a novel EST clustering method and development of a phylogenetic annotation pipeline for livestock gene families. College Station, Tex, USA: Texas A&M University; 2008. Ph.D. dissertation. [Google Scholar]
- 18.Slater GSC, Birney E. Automated generation of heuristics for biological sequence comparison. BMC Bioinformatics. 2005;6(1, article 31) doi: 10.1186/1471-2105-6-31. [DOI] [PMC free article] [PubMed] [Google Scholar]
- 19.Katoh K, Misawa K, Kuma KI, Miyata T. MAFFT: a novel method for rapid multiple sequence alignment based on fast Fourier transform. Nucleic Acids Research. 2002;30(14):3059–3066. doi: 10.1093/nar/gkf436. [DOI] [PMC free article] [PubMed] [Google Scholar]
- 20.Felsenstein J. PHYLIP (Phylogeny Inference Package) Version 3.6. Distributed by the Author. Seattle, Wash, USA: Department of Genome Sciences, University of Washington; 2005. [Google Scholar]
- 21.Fitch WM, Margoliash E. Construction of phylogenetic trees. Science. 1967;155(760):279–284. doi: 10.1126/science.155.3760.279. [DOI] [PubMed] [Google Scholar]
- 22.Zmasek CM, Eddy SR. RIO: analyzing proteomes by automated phylogenomics using resampled inference of orthologs. BMC Bioinformatics. 2002;3(1, article 14) doi: 10.1186/1471-2105-3-14. [DOI] [PMC free article] [PubMed] [Google Scholar]
- 23.Kapustin Y, Souvorov A, Tatusova T, Lipman D. Splign: algorithms for computing spliced alignments with identification of paralogs. Biology Direct. 2008;3, article 20 doi: 10.1186/1745-6150-3-20. [DOI] [PMC free article] [PubMed] [Google Scholar]
- 24.Finn RD, Mistry J, Tate J, et al. The Pfam protein families database. Nucleic Acids Research. 2010;38(1):D211–D222. doi: 10.1093/nar/gkp985. [DOI] [PMC free article] [PubMed] [Google Scholar]
- 25.Ashburner M, Ball CA, Blake JA, et al. Gene ontology: tool for the unification of biology. Nature Genetics. 2000;25(1):25–29. doi: 10.1038/75556. [DOI] [PMC free article] [PubMed] [Google Scholar]
- 26.Zimin AV, Delcher AL, Florea L, et al. A whole-genome assembly of the domestic cow, Bos taurus. Genome Biology. 2009;10(4, article R42) doi: 10.1186/gb-2009-10-4-r42. [DOI] [PMC free article] [PubMed] [Google Scholar]
- 27.Wu TD, Watanabe CK. GMAP: a genomic mapping and alignment program for mRNA and EST sequences. Bioinformatics. 2005;21(9):1859–1875. doi: 10.1093/bioinformatics/bti310. [DOI] [PubMed] [Google Scholar]
- 28.Galbraith DW, Elumalai R, Gong FC. Flow Cytometry Protocols. Vol. 263. Totowa, NJ, USA: Humana Press; 2004. Integrative flow cytometric and microarray approaches for use in transcriptional profiling; pp. 259–279. [DOI] [PubMed] [Google Scholar]
- 29.Smyth GK, Yang YH, Speed T. Statistical issues in cDNA microarray data analysis. Methods in Molecular Biology. 2003;224(4):111–136. doi: 10.1385/1-59259-364-X:111. [DOI] [PubMed] [Google Scholar]
- 30.r. R: A language and environment for statistical computing. R Foundation for Statistical Computing, Vienna, Austria, 2005, http://www.r-project.org/
- 31.Kasprzk A, Keefe D, Smedley D, et al. EnsMart: a generic system for fast and flexible access to biological data. Genome Research. 2004;14(1):160–169. doi: 10.1101/gr.1645104. [DOI] [PMC free article] [PubMed] [Google Scholar]
- 32.Lee M, Xiang CC, Trent JM, Bittner ML. Performance characteristics of 65-mer oligonucleotide microarrays. Analytical Biochemistry. 2007;368(1):70–78. doi: 10.1016/j.ab.2007.05.010. [DOI] [PMC free article] [PubMed] [Google Scholar]
- 33.Nielsen HB, Wernersson R, Knudsen S. Design of oligonucleotides for microarrays and perspectives for design of multi-transcriptome arrays. Nucleic Acids Research. 2003;31(13):3491–3496. doi: 10.1093/nar/gkg622. [DOI] [PMC free article] [PubMed] [Google Scholar]
- 34.Jongeneel CV, Delorenzi M, Iseli C, et al. An atlas of human gene expression from massively parallel signature sequencing (MPSS) Genome Research. 2005;15(7):1007–1014. doi: 10.1101/gr.4041005. [DOI] [PMC free article] [PubMed] [Google Scholar]
- 35.Hsiao LL, Dangond F, Yoshida T, et al. A compendium of gene expression in normal human tissues. Physiol Genomics. 2001;7(2):97–104. doi: 10.1152/physiolgenomics.00040.2001. [DOI] [PubMed] [Google Scholar]


