

Abstract
Fabrea salina is a hypersaline ciliate that is known to be among the strongest ultraviolet (UV)-resistant microorganisms; however, the molecular mechanisms of this resistance are almost unknown. By means of in vivo NMR spectroscopy, we determined the metabolic profile of living F. salina cells exposed to visible light and to polychromatic UV-B + UV-A + Vis radiation for several different exposure times. We used unsupervised pattern-recognition analysis to compare these profiles and discovered some metabolites whose concentration changed specifically upon UV exposure and in a dose-dependent manner. This variation was interpreted in terms of a two-phase cell reaction involving at least two different pathways: an early response consisting of degradation processes, followed by a late response activating osmoprotection mechanisms. The first step alters the concentration of formate, acetate, and saturated fatty-acid metabolites, whereas the osmoprotection modifies the activity of betaine moieties and other functionally related metabolites. In the latter pathway, alanine, proline, and sugars suggest a possible incipient protein synthesis as defense and/or degeneration mechanisms. We conclude that NMR spectroscopy on in vivo cells is an optimal approach for investigating the effect of UV-induced stress on the whole metabolome of F. salina because it minimizes the invasiveness of the measurement.
Introduction
Ultraviolet (UV) radiation significantly affects the biosphere by interacting with biomolecules as well as ecological communities, and causes different types of damage to living organisms. Photochemical damage to nucleic acids and proteins is brought about by active oxygen species and free radicals (1), formation of cyclobutane pyrimidine dimers in the DNA (2), and biochemical and physiological processes such as a reduction of mRNA synthesis, decreased enzyme production (3–5), long-term biological consequences (e.g., morphogenetic aberrations), impaired growth, and restricted mobility (6). In plants, a partial inhibition of photosynthesis is also observed (1). In ecological communities, UV radiation alters equilibrium by compromising the survival of less-resistant species and favoring the more-resistant ones (7,8).
One of the major concerns in this regard is the stability of marine ecosystems, which are the most important producers of organic matter on our planet (9). The effects of UV-B radiation on photosynthetic and nonphotosynthetic marine organisms involve significant DNA damage and reduction of the photosynthetic rate with a consequent decrease in primary productivity, which negatively affects all trophic levels in the food chain (10,11). Moreover, the reduced photosynthetic activity can increase the greenhouse effect by reducing the total ocean CO2 absorption, thus establishing a strong link among different global climate changes (12). On the other hand, to reduce the impact of UV-induced damages, marine organisms have developed several repair and attenuation mechanisms, including blue light and UV-A activated DNA repair processes (10,13), storage of protective agents such as carotenoids and detoxifying enzymes (14), and de novo production of mycosporine-like amino acids or other photoprotective compounds (15,16) and light-avoidance motility behavior (17).
UV effects on the ecology of the planet have recently been investigated by application of modern “omics” approaches such as genomics and proteomics, which respectively assess the genes and proteins that are affected by UV exposure. Here, we show that NMR-based metabolomics can be used to successfully investigate UV-induced alteration of metabolic profiles directly in vivo. Metabolomics focuses on the complete set of metabolites/low-molecular-weight intermediates, which are context-dependent and vary according to the physiology and developmental or pathological state of a cell, tissue, organ, or organism (18–21). In particular, environmental metabolomics characterizes the interactions of living organisms with the environment, with the goal of understanding organismal responses to abiotic stressors, including both natural (i.e., temperature or UV-B radiation), and anthropogenic (i.e., pollution) factors (22). Because UV (and in particular UV-B) radiation is an important abiotic stressor with adverse effects on plant growth and microorganisms (23–25), we believe that NMR-based metabolomics of living cells should be able to rapidly detect the metabolic pathways influenced by such environmental factors. In this study, we focused on the moderate halophile ciliate Fabrea salina (optimal growth at 5–16% NaCl), for two main reasons. First, ciliates play a prominent role in aquatic food webs, being a trophic link between phytoplankton and metazoan zooplankton. Although ciliates are fundamentally important for the stability of ocean ecosystems, only a few studies have examined the effects of UV radiation on them (8). Second, this extremophile shows a strong resistance to UV radiation (26), suggesting that the molecular devices involved in sensing and reacting against UV are very efficient and have potentially valuable applications.
It has been demonstrated that UV irradiation (in particular, UV-B) causes a transient increase of cell speed and a progressive decrease of positive phototaxis (27), but to date there is very little information on the molecular events brought about by UV radiation. In this study, we investigated living cells of F. salina by high-resolution NMR spectroscopy and obtained metabolic profiles of 1), control samples (CS) exposed to visible light (Vis); and 2), treated samples (TS) exposed to a polychromatic radiation ranging from UV-B to Vis, at increasing irradiation-time exposures. Multivariate data analysis based on NMR spectra showed differences between the metabolic profiles of CS and TS. Principal component analysis (PCA) revealed different trends and clusterings of the samples, and indicated clear UV-induced dose-dependent signals, with acetate, formate, glycine, betaine, and ectoine driving this differentiation. Furthermore, multivariate data analysis also detected diverse trends of UV-induced response. Acetate, formate, and saturated fatty acids were prevalently discriminant for immediate reaction to UV irradiation, whereas ectoine, glycine betaine, proline, and alanine were more characteristic of a late reaction. Because cytoplasmic uptake or de novo synthesis of a variety of osmolytes is a general phenomenon of osmoadaptation in halophiles (28), the differences in UV response of F. salina can be attributed to the activation of degradation, osmoprotection, and protein synthesis pathways. Finally, our results demonstrate that NMR spectroscopy directly applied to cultures of the hypersaline ciliate F. salina provides a convenient tool for investigating stress-induced metabolic changes on the whole metabolome with minimal invasiveness and without any chemical manipulation.
Materials and Methods
F. salina cultures
Cells of the halophile heterotrichous ciliate F. salina, originating from a strain collected ∼6 years ago from a salt marsh in Torre Colimena, Italy, were cultivated in sterilized artificial sea water (salinity of 76‰) and fed with the microalgae Dunaliella salina, which was grown under the same water temperature and illumination cycle conditions used for F. salina. All cultures were subjected to a 15 h light/9 h dark cycle, and the light sources were two fluorescent lamps emitting in the Vis spectrum (Philips TLD 30W/54, Royal Philips Electronics, Amsterdam, The Netherlands). The F. salina cells used for the experiment were starved for 2 days before the experiments were conducted, and collected by filtration using filters with a pore size of 30 μm (permeable to D. salina) to rule out any possible interference given by the algae.
Irradiation protocol
To be able to irradiate the samples as close as possible to the NMR spectrometer, we built a mobile irradiation apparatus. The apparatus was equipped with six lamps (four emitting in the UV spectrum (Philips PL-S 9W/12/2P 1CT) and two emitting in the Vis spectrum (Philips PL-S 2P 9W/840)). This setup allowed us to switch on all six lamps or only the Vis-emitting ones. We measured the spectra of both irradiation regimes using a calibrated Oriel Instanspec IV radiometric spectrograph (LOT-Oriel Europe, Milan, Italy), and the results are reported in Fig. 1. The total irradiances supplied in the two irradiation regimes are reported in Table 1, which clearly shows that the UV-B emitting lamps are also able to efficiently cover the UV-A spectral band, thus generating a polychromatic irradiation that mimics a UV-B enriched solar spectrum. In each experiment, cells were collected and concentrated by filtration, and randomly divided into two identical samples of∼40,000 cells each. These samples were put into quartz cuvettes (usually employed for optical fluorescence measurements) that were fully transparent to the actinic radiation. CS were exposed to only the visible component of the radiation, whereas TS were exposed to the entire spectrum (UV-B + UV-A + Vis). NMR spectra of both sample types were recorded at τ = 7, 15, 22, 30, 37, 45, and 60 min of total irradiation. Experiments were done in quadruplicate, with a different cell culture used each time. CS and TS of the same culture batch were run in parallel and processed with exactly the same protocol, with the only difference being the spectrum of the actinic radiation. During irradiation and spectrum acquisition, the temperature was kept constant at 23°C.
Figure 1.
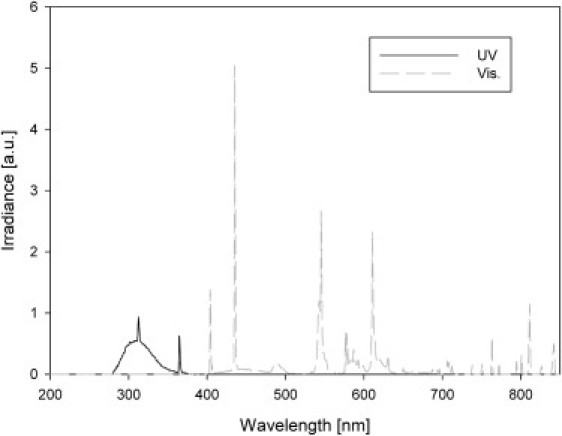
Spectra generated by the UV and Vis lamps in the in-house-made mobile irradiation apparatus.
Table 1.
Irradiance values for the three main spectral bands for TS (exposed to regime 1) and CS (exposed to regime 2)
| Spectral band | Regime 1 (UV-B + UV-A + Vis) irradiance values (W/m2) | Regime 2 (Vis) irradiance values (W/m2) |
|---|---|---|
| Vis | 78.09 | 51.79 |
| UV-A | 9.85 | 0.04 |
| UV-B | 16.13 | 0.00 |
| UV-B/UV-A | 1.64 | 0.00 |
NMR sample preparation
After irradiation was completed, 630 μL of each F. salina sample were rapidly transferred to an NMR tube. Then, 70 μL of a D2O solution (containing 1 mM sodium 3-trimethylsilyl (2,2,3,3-2H4) propionate (TSP)) as an internal chemical shift reference for 1H spectra, and 3-mM sodium azide) were added to obtain a field-frequency lock, resulting in a total volume of 700 μL.
NMR measurements
All spectra were recorded on a 600-MHz Bruker Avance spectrometer (Bruker BioSpin GmbH, Rheinstetten, Germany) equipped with a CryoProbe fitted with a gradient along the Z axis. One-dimensional (1D) 1H-NMR spectra were collected at 300 K with the excitation sculpting pulse sequence (29) to suppress the water resonance. We used a double-pulsed field gradient echo, with a soft square pulse of 4 ms at the water resonance frequency, with gradient pulses of 1 ms each in duration, adding 128 transients of 64 k complex points, with a spectral width of 7002.8 Hz. Time-domain data were all zero-filled to 128 k complex points, and before Fourier transformation an exponential multiplication of 0.6 Hz was applied. We recorded two-dimensional (2D), clean, total correlation spectroscopy (TOCSY) (30) spectra using a standard pulse sequence and incorporated the excitation sculpting sequence for water suppression. In general, 320 equally spaced evolution-time period t1-values were acquired, averaging four transients of 2048 points, with a spin-lock period of 64 ms, achieved with the MLEV-17 pulse sequence. Time-domain data matrices were all zero-filled to 4096 points in both dimensions, and before Fourier transformation, a Lorentz-to-Gauss window with different parameters was applied for both t1 and t2 dimensions for all experiments. Both 1D and 2D spectra were referred to 0.1 mM TSP, assumed to resonate at δ = 0.00 ppm.
For the natural abundance 2D 1H-13C heteronuclear single quantum coherence (HSQC) spectra, we used an echo-antiecho, phase-sensitive pulse sequence with adiabatic pulses for decoupling (31). We acquired 128 equally spaced evolution time period t1-values, averaging 48 transients of 2048 points and using GARP4 for decoupling. The final data matrix was zero-filled to 4096 in both dimensions and apodized before Fourier transformation by a shifted cosine window function in t2 and t1. Linear prediction was also applied to extend the data to twice its length in t1. Spectra were referred to the alanine doublet (βCH3) assumed to resonate at 1.49 ppm for 1H, and 16.80 ppm 13C.
Statistical analysis
Each NMR spectrum was reduced to 213 variables (buckets), obtained by integrating spectral regions of equal width (0.04 ppm) corresponding to a δ range of 0.5–9.0 ppm using the AMIX software package (version 3.6; Bruker BIOSPIN, GMBH). The region δ 4.22–6.00 was removed to exclude any spurious variability effect due to the suppression of water resonance, and finally the bucket integrals were normalized to the total spectral intensity. To discriminate and distinguish between the Vis and UV responses of F. salina, we carried out a multivariate statistical data analysis using projection methods to map the NMR spectra into a lower dimensional space such that sample clustering based on similarities of biochemical profiles could be easily determined. The integrated data reduced format of the spectra was imported into the SIMCA-P+ 12 package (Umetrics, Umea, Sweden), and Pareto scaling was applied as a data pretreatment. PCA was performed to uncover dominant UV-related biochemical changes in the spectra. This unsupervised analysis, which requires no a priori knowledge of the training set samples, was able to recognize different trends in the data and group the spectra accordingly, as reported in the score plots; the related loading plots show the variables responsible for such separation.
Results
1D-NMR spectroscopy of CS and TS
Typical 1H spectra of CS (trace A) and TS (trace B) after 45 min of total Vis and UV irradiation, respectively, are reported in Fig. 2. We assigned resonances to specific metabolites by comparing their chemical shifts with literature data (32–34) and/or an online database (35). We confirmed peak assignments in both CS and TS by resorting to homonuclear 2D TOCSY (Fig. 3 A) to identify 1H-1H connectivities, and heteronuclear 2D 1H-13C HSQC (not shown) for directly bonded 1H and 13C nuclei. The proton and carbon assignments are reported in Table 2.
Figure 2.
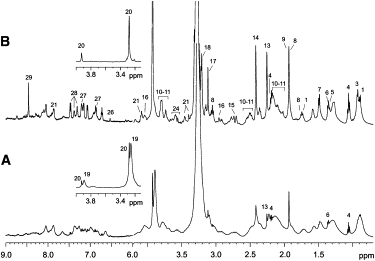
Representative 1D-NMR spectra of F. salina: (A) CS exposed to UV-B + UV-A + Vis, and (B) TS exposed to UV, both irradiated for 45 min. The two insets show corresponding regions with markedly spectral differences. Peak labeling refers to resonance identification reported in Table 2.
Figure 3.
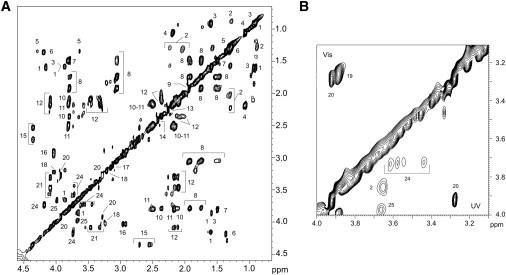
In vivo TOCSY spectra of F. salina cells. (A) Irradiated with UV for 45 min. (B) Expansion of F. salina cells comparing the effects of Vis (upper diagonal) and UV (lower diagonal), both irradiated for 45 min. Cross-peaks are labeled according to the assignments reported in Table 2.
Table 2.
1H and 13C chemical shift assignments (δ, ppm) of metabolites found for F. salina
| Entry | Metabolite | δ 1H | δ 31C | Group | Entry | Metabolite | δ1H | δ31C | Group |
|---|---|---|---|---|---|---|---|---|---|
| 1 | Glycyl-L-Leucine | 0.88 | 20.76 | CH3 | 16 | Asparagine | 2.87 | 36.32 | βCH |
| 0.97 | 21.66 | CH3 | 2.93 | 36.32 | β′CH | ||||
| 1.60 | 40.71 | βCH2 | 4.03 | 51.25 | αCH | ||||
| 3.77 | 39.59 | αCH | |||||||
| 2 | Saturated fatty acids | 0.88 | ωCH3 | 17 | Proline betaine | 3.12 | 46.37 | N'CH3 | |
| 1.27 | CH2-CH3 | ||||||||
| 2.05 | (CH2)3-CH3 | ||||||||
| 2.25 | (CH2)2-COO- | ||||||||
| 3 | Leucine | 0.93 | 22.61 | δCH3 | 18 | Choline moiety | 3.21 | 51.35 | NCH3 |
| 1.60 | 40.50 | βCH2 | 4.03 | 53.26 | αCH2 | ||||
| 3.87 | 54.20 | αCH | |||||||
| 4 | Propionate | 1.06 | 10.11 | βCH3 | 19 | Betaines | 3.25 | 55.86 | N(CH3)3 |
| 2.19 | 30.74 | αCH2 | 3.89 | 68.64 | NCH2 | ||||
| 5 | Threonine | 1.34 | 21.93 | γCH3 | 20 | Glycine betaine/β-Alanine betaine | 3.28 | 53.84 | NCH3 |
| 3.64 | 61.00 | αCH | 3.93 | 66.29 | αCH2/βCH2 | ||||
| 4.23 | 66.60 | βCH | |||||||
| 6 | Lactate | 1.35 | 19.81 | βCH3 | 21 | Tryptophan | 3.32 | 28.43 | βCH |
| 4.19 | 69.12 | αCH | 3.48 | 38.37 | β′CH | ||||
| 4.09 | 53.18 | αCH | |||||||
| 7.86 | C4H | ||||||||
| 7 | Alanine | 1.49 | 16.80 | βCH3 | 22 | α-Trehalose | 3.42 | 69.46 | C4H |
| 3.78 | 55.00 | αCH | 3.58 | 71.20 | C5H | ||||
| 3.73 | 72.85 | C3H | |||||||
| 3.75;3.85;3.86 | 60.12 | C6H | |||||||
| 5.24 | 72.40 | C2H | |||||||
| 94.65 | C1H | ||||||||
| 8 | Lysine | 1.47 | 21.96 | γCH2 | 23 | Sucrose | 3.43 | 72.40 | G4H |
| 1.74 | 26.72 | δCH2 | 3.65 | 62.00 | F1H | ||||
| 1.94 | 30.30 | βCH2 | 3.85 | 63.20 | F6H | ||||
| 3.05 | 39.45 | ɛCH2 | 3.98 | 74.43 | F4H | ||||
| 3.77 | 55.06 | αCH | 5.40 | 92.87 | G1H | ||||
| 9 | Acetate | 1.92 | 23.59 | βCH3 | 24 | PC∗/GPC∗ | 3.58 | βCH2 | |
| 3.62 | βCH2 | ||||||||
| 3.73 | 68.63 | βCH2 | |||||||
| 4.18 | αCH2 | ||||||||
| 10 | Glutamate | 2.07 | 27.34 | βCH | 25 | Shikimate | 3.65 | 70.20 | C5H |
| 2.35 | 32.92 | γCH2 | 3.98 | 70.20 | C6H | ||||
| 3.77 | 54.77 | αCH | |||||||
| 11 | Glutamine | 2.13 | 27.16 | βCH2 | 26 | Fumarate | 6.53 | 135.13 | α,βC=C |
| 2.48 | 31.50 | γCH2 | |||||||
| 3.78 | 54.87 | αCH | |||||||
| 12 | Proline | 2.01 | 23.40 | γCH2 | 27 | Tyrosine | 6.90 | 115.80 | C3,5H ring |
| 2.08 | 29.10 | β′CH | 7.20 | 128.49 | C2,6H ring | ||||
| 2.36 | 29.10 | βCH | |||||||
| 3.29 | 44.90 | δCH | |||||||
| 3.45 | 44.90 | δ′CH | |||||||
| 4.09 | 61.04 | αCH | |||||||
| 13 | Ectoine | 2.25 | 18.95 | CH3 | 28 | Phenylalanine | 7.31 | 127.15 | C4 ring |
| 7.37 | 130.30 | C2,6 ring | |||||||
| 7.46 | 130.30 | C3.5 ring | |||||||
| 14 | Succinate | 2.42 | 34.20 | α,βCH2 | 29 | Formate | 8.46 | HCOO- | |
| 15 | Malate | 2.54 | 70.29 | αCH | |||||
| 2.71 | 42.16 | βCH | |||||||
| 4.35 | 42.16 | β′CH |
Assignments were based on 1H-TOCSY and 1H-13C-HSQC-NMR experiments.
Abbreviations: PC, phosphocholine; GPC, glycerophosphocholine.
A visual inspection of the 1D spectra showed clear differences between CS and TS. In particular, we did not observe any significant change in the metabolic profile of CS spectra with increasing Vis exposure times (see below), whereas the TS spectra presented alterations that apparently were proportional to the increasing UV exposure. Furthermore, the signals in the TS spectra seemed to sharpen (Fig. 2 B). This can probably be attributed to a gradual membrane poration under UV action, which should permit the flow of metabolites out of the cells, thus favoring an increase of their correlation times with a consequent sharpening of the resonances. As an indirect confirmation, we observed a characteristic red-orange color of TS due to loss of pigment granules from the F. salina cytoplasm after extreme UV exposure time (τ = 60 min). Pigment granule extrusion is a well-known phenomenon that commonly occurs in all pigmented ciliates, extremophile or otherwise, in response to osmotic or thermal stress (36). This is further evidence that TS are subject to an osmotic stress.
A striking difference between CS and TS is observed in the 4.0–3.0 ppm region, which contains strong signals corresponding to betaine (labeled 19 in Table 2) and glycine betaine/β-alanine betaine (labeled 20). Although the CS spectrum presents both signals (inset in Fig. 2 A), signals 19 are virtually absent in the TS spectrum (inset in Fig. 2 B). This is evident in Fig. 3 B, which compares the TOCSY expansions of CS (upper triangle, labeled Vis) and TS (lower triangle, labeled UV), and shows peaks 19 only in the Vis spectrum, which, on the contrary, lacks saturated fatty acids (peak 2 in the UV spectrum), phosphocoline/glycerophosphocholine (peak 24), and shikimate (peak 25).
PCA of F. salina CS and TS
To obtain NMR-based statistical information about possible UV-dependent biochemical changes, we completely analyzed each spectrum (sample) and conducted a pattern recognition analysis. We performed PCA on a batch of 15 cell samples, five of which were CS irradiated with Vis for τ = 0, 15, 30, 45 and 60 min. The remaining 10 samples were TS irradiated with UV-B + UV-A + Vis for τ = 0 (duplicate), 7 (duplicate), 15 and 22 (duplicate), 30, 45, and 60 min. We obtained a robust two-component model with R2 = 89.89% and Q2 = 82.78%. In the scores plot of Fig. 4 A, CS (open squares) and TS (solid squares) are well separated along the first component t[1]. All CS are confined in a restricted area, except for a small spread in the t[2] component, whereas a specific trend is apparent for TS with increasing irradiation time. At τ = 0 (duplicate) min, TS are obviously identical to Vis-treated samples and therefore they fall in the CS area, and move away from it when the UV irradiation time increases. At τ = 7 min, both duplicate samples move toward positive values of the t[1] axis; from this τ-value on, TS are completely detached from CS appearing in the fourth quadrant of the plot (t[1] positive, t[2] negative) for intermediate τ-values [15, 22 (duplicate) min], and in the first quadrant of the plot (t[1] positive, t[2] positive) for τ = 30, 45, and 60 min. The difference observed within duplicate TS (0, 7, and 22 min) is linked to the longer time interval required to acquire the second NMR spectrum, which resulted in the cells being kept in the cuvette or NMR tube for a longer period of time. By exploring the associated loadings plot (Fig. 4 B), we identified the signals responsible for the separation of CS from TS, and more importantly, we recognized the metabolites that differentiate between intermediate and extreme UV exposure. Betaine and choline moieties, as well as sucrose and α-trehalose signals are prominent for CS (third quadrant), and therefore strongly contribute to the separation between CS and TS. Variation of saturated fatty acids, formate, and acetate is characteristic for TS irradiated at intermediate UV exposure time (τ = 15, 22 min; fourth quadrant). A large number of metabolites (glycine betaine, ectoine, proline, propionate, leucine, alanine, proline betaine, and succinate) is observed whose concentration is relevant for TS at extreme UV exposure time (τ = 30, 45 and 60 min; first quadrant).
Figure 4.
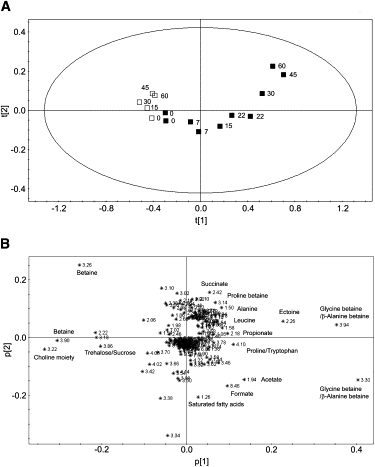
PCA of control and treated F. salina cells. (A) Scores plot of Vis-exposed control (open squares) and UV-treated (solid squares) samples at different irradiation time (τ, in min). (B) Loadings plot with the buckets responsible for the separation observed in the scores plot (A). The most relevant buckets are labeled.
The analysis of the bucket intensity corresponding to the above metabolites shows that, except for a slight increase of acetate, CS metabolites are basically constant with increasing Vis irradiation time (Fig. 5). In contrast, there is a large concentration variation for metabolites characterizing TS. Fig. 5, A and B, respectively compare the intensity of the buckets corresponding to choline moiety, betaines, and trehalose/sucrose, and formate, acetate, and saturated fatty acids in CS and TS. It can be seen that although trehalose/sucrose and saturated fatty acids are essentially constant at all Vis and UV irradiation times, a sharp increase of acetate is observed in TS (Fig. 5 B), reaching a maximum at τ = 15 min, and steadily decreasing upon lengthening of the UV irradiation time. This behavior appears to be characteristic of an abrupt, rapid response to UV irradiation (τ = 7–22 min). A similar outcome, albeit of less intensity, is observed for formate in TS (Fig. 5 B). The acetate level also shows a slight constant increase in CS (Fig. 5 B), probably due to the experimental stress of F. salina during Vis irradiation and spectra acquisition, but its intensity is always lower than the minimum level observed in TS. A clear reduction of choline moiety is observed in TS with increasing UV irradiation time (Fig. 5 A), whereas for betaines a zigzagging behavior is observed in TS, with an average level lower than the corresponding CS (Fig. 5 A). It is tempting to speculate that this undulating behavior reflects F. salina's efforts to adapt to UV-induced stress.
Figure 5.
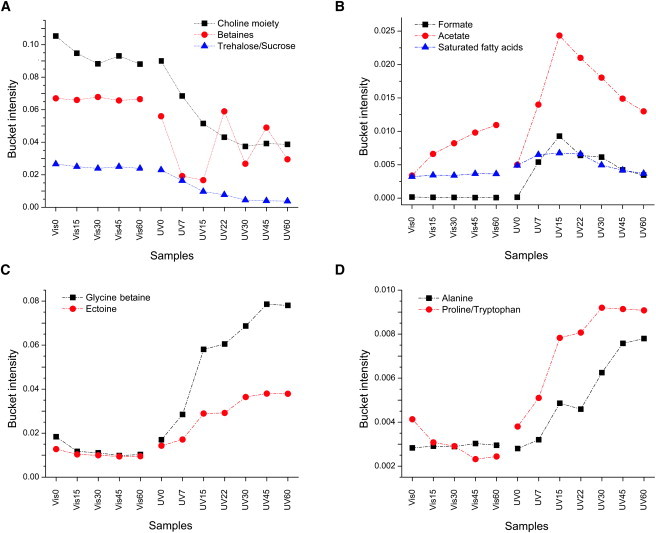
Trends of bucket intensities relative to different metabolites in CS and TS: (A) choline moiety, betaines, and trehalose; (B) formate, acetate, and saturated fatty acids; (C) glycine betaine and ectoine; and (D) alanine and proline/tryptophan.
Fig. 5, C and D, depict the different trends of glycine betaine and ectoine, and alanine and proline/tryptophan, respectively, for both CS and TS. As the irradiation time increases, the bucket intensities of all signals are essentially unchanged in CS, whereas in TS the metabolite concentration has a rapid increase, reaching a plateau between 45 and 60 min of UV irradiation time. Considering that metabolite variation has been obtained from spectra recorded from an in vivo culture of F. salina, the curves reported in Fig. 5 represent a direct measurement of the metabolic changes that take place in the cells upon UV irradiation.
We proved the reproducibility of the model and the dependence of F. salina's response on the culture by analyzing a second set of cell samples grown 1 month later. PCA was carried out on a new set of NMR spectra consisting of four CS and four TS samples irradiated respectively with Vis and UV-B + UV-A + Vis radiation for τ = 0, 15, 30, and 45 min. We again obtained a two-component model (R2 = 91.89% and Q2 = 77.65%), and the scores and loadings plots confirmed the trend reported in Fig. 4. By analyzing all data together, we obtained a statistical model that takes into account the potential dependence of metabolic profiles from different F. salina culture batches (Fig. 6 A). The PCA confirmed a two-component model with R2 = 89.62% and Q2 = 80.04%, with the new (circles) and old (triangles) samples located in distinct regions and arranged along two parallel trajectories. Each set is consistent with the PCA model previously described, as CS from each batch (open symbols) cluster at the beginning of the trajectory, whereas TS (solid symbols) follow a similar shape for corresponding irradiation times. The natural variability of F. salina in samples cultured at a 1-month interval justifies the parallel trajectories, meaning that different populations, although with different origin, evolve under preserved metabolic pathways that respond to stress with identical molecular mechanisms. As such, different populations of F. salina will generate a sheaf of straight lines, which are parallel because the cells will always activate the same metabolic pathways. Convergent trajectories would have implied that different populations of the same species activate different metabolic mechanisms, eventually crossing at some points, which would contradict the species-specific principle.
Figure 6.
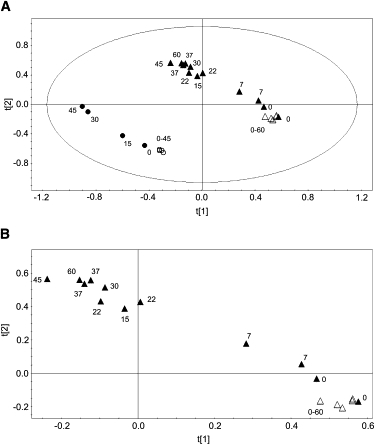
PCA of control and treated F. salina cells belonging to batches cultured with a 1 month interval. (A) Scores plot of two batches (triangles represent the starting samples, and circles indicate samples cultured 1 month later) of F. salina at different irradiation times (τ, in min). (B) Scores plot expansion of a single batch at different irradiation times, showing discrepancies in duplicate measures (τ = 0, 7, 22, and 37 min).
It is interesting to notice that, within the same batch, measures in duplicate (τ = 7, 22, and 37 min) are very close to each other (Fig. 6 B); the slight discrepancies observed are due to the longer interval required for acquisition of the second spectrum. However, at longer irradiation times the differences become smaller and cancel out at τ = 37 min, meaning that the metabolic changes induced by UV irradiation overwhelm those due to the delay between irradiation and NMR acquisition.
Discussion
Cell viability
In 60 min of irradiation, the TS received a total UV-B dose of ∼58 kJ/m2. Although such a dose is able to kill most known microorganisms, it does not kill F. salina cells. Previous studies (8,26,27), used similar or even higher doses; in particular, Marangoni et al. (8) showed that cell viability started to decrease only when the total dose reached 117 kJ/m2, far beyond the doses here used. The cell count confirmed a viability of ∼95% until 45 min of irradiation time, whereas after 60 min of irradiation the viability was ∼70%. It is important to emphasize that the irradiation time represents the total exposure time reached after several sessions that lasted 15 min each (except for the lower times of 7 min) and were separated by the NMR acquisition time. Therefore, the TS were irradiated for a total time of 60 min during the whole experiment, which lasted, on average, 10 h. All things considered, we believe that cell viability problems can only affect marginally the results obtained for the longest exposure times (>45 min).
UV-induced pathways
We have shown that in vivo NMR spectroscopy reveals different metabolic profiles for F. salina cells exposed to Vis, and the entire spectrum (UV-B + UV-A + Vis) for τ = 7, 15, 22, 30, 37, 45, and 60 min of total irradiation exposure. All of the proton and carbon resonances of metabolites present in CS and TS spectra were assigned. Of interest, the statistical trends obtained for CS and TS were reproducible even when the F. salina population was not at the same life cycle during the different set of experiments. We checked this by analyzing various batches of cells grown with a time interval of 1 month, to exclude the possibility that separate cultures could diversely react to UV irradiation. Our results indicate that F. salina responds quite uniformly upon irradiation, activating the same protection mechanisms.
Vis has no effect on CS metabolites, and the multivariate data analysis confirmed a strong homogeneity among them (Fig. 4 A), characterized by high and quite constant concentrations of betaines, choline moieties, sucrose, and α-trehalose (Figs. 4 B and 5 A). Only the acetate level increased slightly in CS (Fig. 5 B), possibly induced by stress from transferring the samples from the irradiation cuvette to the NMR tube, and from packing the F. salina cells in the tube during spectra acquisition. We can therefore define the metabolic profile of CS as the basal metabolism of F. salina irradiated with Vis. Betaines, choline moieties, sucrose, and α-trehalose, the main compounds in the CS profile, represent the osmoprotective response of F. salina to extreme but normal culture conditions in artificial sea water (e.g., a high salinity of 76‰). Osmoprotectants, which occur in all organisms from Archaea to higher plants and animals, serve to raise osmotic pressure in the cytoplasm, prevent cell death due to plasmolysis, and stabilize proteins and membranes when salt levels or temperatures are unfavorable (37). They are highly soluble compounds that carry no net charge at physiological pH, are nontoxic at high concentrations, and do not interfere with cellular functions. Chemically, they can be divided into four types: betaines and related compounds, polyols, sugars (e.g., simple sugars such as mannitol and sucrose, and complex sugars such as α-trehalose), and amino acids such as proline. Their biosynthetic routes and most of the enzymes participating in these pathways have been characterized, and the genes for some of them have been cloned (38).
As a consequence of UV-A + UV-B + Vis radiation, TS show strong alterations in the metabolic profile. In particular, the multivariate data analysis highlighted two different UV-induced responses: one early and one late. As reported in Fig. 5 B, acetate, formate, and saturated fatty acids show a similar sharp increase, although of different levels, from τ = 0 to reach the highest value at τ = 15 min of irradiation time, and then decrease down to τ = 60 min. This behavior could be attributed to a prompt response of F. salina, probably related to a degrading pathway that is exhausted shortly afterward. Formate is known as a toxic metabolite (39) that inhibits cytocrome oxidase activity, a component of the electron transport chain involved in ATP synthesis (40). The increase of saturated fatty acids could be related to the F. salina membrane response to UV-induced solicitation. Biological membranes play a central role in the response of living organisms to environmental stresses. The fluidity and permeability of the membrane are vital factors in maintaining cell homeostasis and facilitating effective transmembrane processes such as nutrient transport or solute gradients for energetic purposes. In bacteria, modifications of the membrane composition occur in response to environmental stress to prevent membrane structure destabilization (41).
The multivariate data analysis also highlighted a late response to UV-induced stress. As reported in Fig. 5, C and D, the intensity of glycine betaine/β-alanine betaine, ectoine, alanine, and proline/tryptophan increased rapidly and reached a plateau around τ = 60 min. This response suggests that these metabolites are certainly affected during the early reaction of cells to constantly increase as a consequence of the UV damage to the F. salina membrane (progressive UV-induced poration). Ectoine, proline, alanine, and glycine betaine/β-alanine betaine are all osmoprotectants. The opposite behavior of betaines and ectoine (Fig. 5, A and C) appears to be a switch in osmolyte accumulation, as betaines accumulate in high proportion with low cytoplasmatic NaCl, and ectoine accumulates at a high concentration of cytoplasmatic NaCl (42). Ectoine helps salt-tolerant organisms in highly saline environments and slows the diffusion of water through the cell membrane, allowing single-cell organisms to maintain the proper level of hydration. Proline and glycine betaine/β-alanine betaine can also stabilize the proteins that are ubiquitous in bacteria, plants, and animals. In particular, proline has an important role in osmoregulation, and under different stress conditions serves multiple key functions, including formation of carbon and nitrogen sources, protection of enzymes denaturation, regulation of cytoplasmic acidity, and detoxification of cells from free radicals (43–45). On the other hand, glycine betaine/β-alanine betaine, in addition to its osmoregulating function, stabilizes the oxygen evolution activity of the photosystem protein complex (46) in photosynthetic organisms. The alanine increase (Fig. 5 D) is probably involved in the production of the β-alanine betaine through its methylation (38) via N-methyl and N,N-dimethyl β-alanines. Furthermore, the observed decrease of choline moieties for TS (Fig. 5 A) is consistent with the synthesis of glycine betaine via oxidation, which increases for cumulative UV radiation (Fig. 5 C). The slight decrease of α-trehalose and sucrose could be ascribed to the protectant effect that intervenes as a consequence of the water leakage caused by UV-induced membrane poration. Indeed, the principal role of α-trehalose is to allow the cell to survive under anhydrous conditions, because the sugar is able to form a gel that prevents damage to intracytoplasmic organelles and preserves their vitality (47).
We observe that the average level of betaines decreases during UV exposure (Fig. 5 A). Although the main role of betaines is in osmoregulation, they are also used as an energy source during periods of prolonged stress (48), and as such, the zigzagging variation observed could be related to an on-off energy requirement. On the basis of these considerations, we can hypothesize that betaines act as a source in favor of other osmoconformers (e.g., glycine betaine/β-alanine betaine and proline) to be used as osmoprotectant under UV-induced stress conditions.
Conclusions
We have demonstrated that in vivo cell NMR spectroscopy is an efficient tool for investigating UV-induced metabolic perturbations of F. salina. The unsupervised pattern-recognition analysis PCA visualized the pattern of metabolic differences between Vis-irradiated CS and TS, irradiated with the entire spectrum (UV-B + UV-A + Vis). We proved that UV radiation induces clearly metabolic perturbations in the hypersaline ciliate, and we were able to distinguish two different trends of UV-induced responses. Acetate, formate, and saturated fatty acids are prevalently discriminant for immediate reaction to UV irradiation, whereas ectoine, glycine betaine, proline, and alanine are more characteristic of a late reaction. Such metabolic alterations suggest several effects caused by UV solicitations, including permeability (saturated fatty acids) and osmoregulatory problems (ectoine and glycine betaine), oxidation (formate) and impairment of protein synthesis (proline and alanine), and degradation (acetate).
Acknowledgments
We thank Alberto Pietrangeli for his contribution in cell culturing.
This work was partly supported by the National Research Council of Italy and personal funds of R.M. and G.C.
References
- 1.Caldwell M.M., Björn L.O., Tevini M. Effects of increased solar ultraviolet radiation on terrestrial ecosystems. J. Photochem. Photobiol. B. 1998;46:40–52. [Google Scholar]
- 2.Brash D.E. Sunlight and the onset of skin cancer. Trends Genet. 1997;13:410–414. doi: 10.1016/s0168-9525(97)01246-8. [DOI] [PubMed] [Google Scholar]
- 3.Kumar A., Sinha R.P., Häder D.-P. Effect of UV-B on enzymes of nitrogen metabolism in the cyanobacterium Nostoc calcicola. J. Plant Physiol. 1996;148:86–91. [Google Scholar]
- 4.Sinha R.P., Singh N., Häder D.-P. Effects of UV irradiation on certain physiological and biochemical processes in cyanobacteria. J. Photochem. Photobiol. B. 1996;32:107–113. [Google Scholar]
- 5.Sinha R.P., Klisch M., Häder D.-P. Ultraviolet-absorbing/screening substances in cyanobacteria, phytoplankton and macroalgae. J. Photochem. Photobiol. B. 1998;47:83–94. [Google Scholar]
- 6.Kennedy A.D. Antarctic terrestrial ecosystem response to global environmental change. Annu. Rev. Ecol. Syst. 1995;26:683–704. [Google Scholar]
- 7.Häder D.-P., Kumar H.D., Worrest R.C. Effects on aquatic ecosystems. J. Photochem. Photobiol. B. 1998;46:53–68. [Google Scholar]
- 8.Marangoni R., Messina N., Colombetti G. Effects of UV-B irradiation on a marine microecosystem. Photochem. Photobiol. 2004;80:78–83. doi: 10.1562/TM-03-14.1. [DOI] [PubMed] [Google Scholar]
- 9.Häder D.-P. Penetration and effects of solar UV-B on phytoplankton and macroalgae. Plant Ecol. 2004;128:5–13. [Google Scholar]
- 10.Sinha R.P., Klisch M., Häder D.-P. Responses of aquatic algae and cyanobacteria to solar UV-B. Plant Ecol. 2004;154:219–236. [Google Scholar]
- 11.Melis A., Nemson J.A., Harrison M.A. Damage to functional components and partial degradation of Photosystem II reaction center proteins upon chloroplast exposure to ultraviolet-B radiation. Biochim. Biophys. Acta. 1992;1100:312–320. [Google Scholar]
- 12.Häder D.-P., Kumar H.D., Worrest R.C. Effects of solar UV radiation on aquatic ecosystems and interactions with climate change. Photochem. Photobiol. Sci. 2007;6:267–285. doi: 10.1039/b700020k. [DOI] [PubMed] [Google Scholar]
- 13.Buma A.G.J., van Hannen E.J., Veldhuis M.J.W., Gieskes W.W.C. UV-B induces DNA damage and DNA synthesis delay in the marine diatom Cyclotella sp. Scientia Marina. 1996;60:101–106. [Google Scholar]
- 14.Middleton E.M., Teramura A.H. The role of flavonol glycosides and carotenoids in protecting soybean from ultraviolet-B damage. Plant Physiol. 1993;103:741–752. doi: 10.1104/pp.103.3.741. [DOI] [PMC free article] [PubMed] [Google Scholar]
- 15.Sinha R.P., Klisch M., Häder D.-P. Induction of a mycosporine-like amino acid (MAA) in the rice-field cyanobacterium Anabaena sp. by UV irradiation. J. Photochem. Photobiol. B. 1999;52:59–64. [Google Scholar]
- 16.Adams N.L., Shick J.M. Mycosporine-like amino acids provide protection against ultraviolet radiation in eggs of the green sea urchin Strongylocentrotus droebachiensis. Photochem. Photobiol. 2008;64:149–158. [Google Scholar]
- 17.Spudich J.L., Spudich E.N. The simplest eyes: rhodopsin-mediated phototaxis reception in microorganisms. In: Tsonis P.A., editor. Animal Models in Eye Research. Elsevier Ltd.; Amsterdam: 2008. pp. 6–14. [Google Scholar]
- 18.Oliver D.J., Nikolau B., Wurtele E.S. Functional genomics: high-throughput mRNA, protein, and metabolite analyses. Metab. Eng. 2002;4:98–106. doi: 10.1006/mben.2001.0212. [DOI] [PubMed] [Google Scholar]
- 19.Griffiths W. Royal Society of Chemistry; Cambridge, UK: 2007. Metabolomics, Metabonomics and Metabolites Profiling. [Google Scholar]
- 20.Harrigan G.G., Goodacre R. Springer; Boston: 2003. Metabolic Profiling: Its Role in Biomarker Discovery and Gene Function Analysis. [Google Scholar]
- 21.Lindon J.C., Nicholson J.K., Holmes E. Elsevier Science; London: 2006. The Handbook of Metabonomics and Metabolomics. [Google Scholar]
- 22.Bundy J.G., Matthew P.D., Viant M.R. Environmental metabolomics: a critical review and future perspectives. Metabolomics. 2009;5:3–21. [Google Scholar]
- 23.Day T.A., Ruhland C.T., Xiong F.S. Influence of solar ultraviolet-B radiation on Antarctic terrestrial plants: results from a 4-year field study. J. Photochem. Photobiol. B. 2001;62:78–87. doi: 10.1016/s1011-1344(01)00161-0. [DOI] [PubMed] [Google Scholar]
- 24.Lois R. Accumulation of UV-absorbing flavonoids induced by UV-B radiation in Arabidopsis thaliana. 1. Mechanisms of UV-resistance in Arabidopsis. Planta. 1994;194:498–503. [Google Scholar]
- 25.Broeckling C.D., Huhman D.V., Sumner L.W. Metabolic profiling of Medicago truncatula cell cultures reveals the effects of biotic and abiotic elicitors on metabolism. J. Exp. Bot. 2005;56:323–336. doi: 10.1093/jxb/eri058. [DOI] [PubMed] [Google Scholar]
- 26.Moeller K.M. On the nature of stentorin. Compt. Rend. Lab. Carlsberg. 1962;32:471–498. [PubMed] [Google Scholar]
- 27.Martini B., Marangoni R., Colombetti G. Effect of UV-B irradiation on motility and photomotility of the marine ciliate Fabrea salina. J. Photochem. Photobiol. B. 1997;39:197–205. [Google Scholar]
- 28.Pflüger K., Müller V. Transport of compatible solutes in extremophiles. J. Bioenerg. Biomembr. 2004;36:17–24. doi: 10.1023/b:jobb.0000019594.43450.c5. [DOI] [PubMed] [Google Scholar]
- 29.Hwang T.-L., Shaka A.J. Water suppression that works: excitation sculpting using arbitrary waveforms and pulse field gradients. J. Magn. Reson. 1995;112:275–279. [Google Scholar]
- 30.Griesinger C., Otting G., Ernst R.R. Clean TOCSY for proton spin system identification in macromolecules. J. Am. Chem. Soc. 1988;110:7870–7872. [Google Scholar]
- 31.Kay L.E., Keifer P., Saarinen T. Pure absorption gradient enhanced heteronuclear single quantum correlation spectroscopy with improved sensitivity. J. Am. Chem. Soc. 1992;114:10663–10665. [Google Scholar]
- 32.Sitter B., Sonnewald U., Gribbestad I.S. High-resolution magic angle spinning MRS of breast cancer tissue. NMR Biomed. 2002;15:327–337. doi: 10.1002/nbm.775. [DOI] [PubMed] [Google Scholar]
- 33.London R.E. 13C labelling in studies of metabolic regulation. Prog. Nucl. Magn. Reson. Spectrosc. 1988;20:337–383. [Google Scholar]
- 34.Fan T.W.M. Metabolite profiling by one- and two-dimensional NMR analysis of complex mixtures. Prog. Nucl. Magn. Reson. Spectrosc. 1996;28:161–219. [Google Scholar]
- 35.Whishart D.S., Tzur D., Querengesser L. Human Metabolome Database. Nucleic Acids Res. 2007;35:D521–D526. doi: 10.1093/nar/gkl923. [DOI] [PMC free article] [PubMed] [Google Scholar]
- 36.Prabhakara Rao A.V.S. Extrusion of a protein-pigment complex from Blepharisma undulans. J. Eukaryot. Microbiol. 1963;10:204–207. [Google Scholar]
- 37.Yancey P.H., Clark M.E., Somero G.N. Living with water stress: evolution of osmolyte systems. Science. 1982;217:1214–1222. doi: 10.1126/science.7112124. [DOI] [PubMed] [Google Scholar]
- 38.McNeil S.D., Nuccio M.L., Hanson A.D. Betaines and related osmoprotectants. Targets for metabolic engineering of stress resistance. Plant Physiol. 1999;120:945–950. doi: 10.1104/pp.120.4.945. [DOI] [PMC free article] [PubMed] [Google Scholar]
- 39.Treichel J.L., Henry M.M., Burke J.M. Formate, the toxic metabolite of methanol, in cultured ocular cells. Neurotoxicology. 2003;24:825–834. doi: 10.1016/S0161-813X(03)00059-7. [DOI] [PubMed] [Google Scholar]
- 40.Nicholls P. The effect of formate on cytochrome aa3 and on electron transport in the intact respiratory chain. Biochim. Biophys. Acta. 1976;430:13–29. doi: 10.1016/0005-2728(76)90218-8. [DOI] [PubMed] [Google Scholar]
- 41.Vanden Boom T., Cronan J.E., Jr. Genetics and regulation of bacterial lipid metabolism. Annu. Rev. Microbiol. 1989;43:317–343. doi: 10.1146/annurev.mi.43.100189.001533. [DOI] [PubMed] [Google Scholar]
- 42.Da Costa M.S., Santos H., Galinski E.A. An overview of the role and diversity of compatible solutes in bacteria and archaea. Adv. Biochem. Eng. Biotechnol. 1998;61:117–158. doi: 10.1007/BFb0102291. [DOI] [PubMed] [Google Scholar]
- 43.Alia S.P.P., Mohanty P. Proline in relation to free radical production in seedlings of Brassica juncea raised under sodium chloride stress. Plant Soil. 1993;155/156:497–500. [Google Scholar]
- 44.Delauney A.J., Verma D.P.S. Proline biosynthesis and osmoregulation in plants. Plant J. 1993;4:215–223. [Google Scholar]
- 45.Naqvi S.S.M., Mumtaz S., Khan A.H. Role of abscitic acid in regulation of wheat seedling growth under salinity stress. Biol. Plant. 1997;39:453–456. [Google Scholar]
- 46.Yeo A. Molecular biology of salt tolerance in the context of whole-plant physiology. J. Exp. Bot. 1998;49:915–929. [Google Scholar]
- 47.Iturriaga G., Suárez R., Nova-Franco B. Trehalose metabolism: from osmoprotection to signaling. Int. J. Mol. Sci. 2009;10:3793–3810. doi: 10.3390/ijms10093793. [DOI] [PMC free article] [PubMed] [Google Scholar]
- 48.Riou N., Poggi M.C., Le Rudulier D. Characterization of an osmoregulated periplasmic glycine betaine-binding protein in Azospirillum brasilense sp7. Biochimie. 1991;73:1187–1193. doi: 10.1016/0300-9084(91)90003-j. [DOI] [PubMed] [Google Scholar]