Abstract
Glycomic analysis is an increasingly important field in biological and biomedical research as glycosylation is one of the most important protein post-translational modifications. We have developed a new technique to detect carbohydrates using surface enhanced Raman spectroscopy (SERS) by designing and applying a Rhodamine B derivative as the SERS tag. Using a reductive amination reaction, the Rhodamine-based tag (RT) was successfully conjugated to three model carbohydrates (glucose, lactose and glucuronic acid). SERS detection limits obtained with 632 nm HeNe laser were ~1 nM in concentration for all the RT-carbohydrate conjugates and ~10 fmol in total sample consumption. The dynamic range of the SERS method is about 4 orders of magnitude, spanning from 1 nM to 5 µM. Ratiometric SERS quantification using isotope-substituted SERS internal references also allows comparative quantifications of carbohydrates labeled with RT and deuterium/hydrogen substituted RT tags, respectively. In addition to enhancing the SERS detection of the tagged carbohydrates, the Rhodamine tagging facilitates fluorescence and mass spectrometric detection of carbohydrates. Current fluorescence sensitivity of RT-carbohydrates is ~ 3 nM in concentration while the mass spectrometry (MS) sensitivity is about 1 fmol that was achieved with linear ion trap electrospray ionization (ESI)-MS instrument. Potential applications that take advantage of the high SERS, fluorescence and MS sensitivity of this SERS tagging strategy are discussed for practical glycomic analysis where carbohydrates may be quantified with a fluorescence and SERS technique, and then identified with ESI-MS techniques.
Keywords: Glycomic, Tag, Carbohydrate, Reductive Amination, SERS
INTRODUCTION
Glycosylation an important type of protein post-translational modification and is implicated in many physiological and pathological processes. Quantitative glycomics, the study of the types and quantities of carbohydrates (glycan) present in protein or tissue samples are of great importance in disease mechanism investigation, biomarker discovery as well as clinical diagnosis and prognosis. Carbohydrate analysis is intrinsically challenging. Unlike other biomolecules such as protein and DNA, carbohydrate has no endogenous chromophores, which precludes UV-Vis and fluorescence detection of unlabeled carbohydrates. In addition, mass spectrometric (MS) analysis of native, underivatized glycans is also difficult since they are usually neutral molecules with relatively poor ionization efficiency and their spectra are often complicated by loss of functional group(s). Essentially all the current glycomic analytical methods that are mainly fluorescence- or MS - based, involve fluorophore or mass tag labeling to facilitate carbohydrate detections. In the MS based carbohydrate analysis, by derivatization of oligosaccharide with the cationic carboxylmethyl trimethylammonium hydrazine or Girard’s T reagent, matrix assisted laser desorption ionization (MALDI) and electrospray ionization (ESI) MS detection sensitivity is greatly enhanced.1–3 A MS detection sensitivity of 20 fmol of the derivatized glycan has been reported.2 To date, various fluorophore tags have also been developed for carbohydrate analysis4 and sub pmol fluorescence sensitivity can be achieved with oligosaccharides labeled with fluorescence dyes.5–7
With its single molecule sensitivity demonstrated with selected molecules such as Rhodamine 6G and adenine,8 SERS has drawn significant interest for its potential application for ultrasensitive biomolecule detection.9, 10 While label-free SERS detection of protein, DNA, carbohydrate has been demonstrated, their quantification sensitivity is severely limited. To date, the best SERS sensitivity of label-free carbohydrate is low mM, which was demonstrated with monosaccharide glucose, fructose,11 and disaccharide lactose.12
One possible approach to improve the SERS detection sensitivity of biomolecule is the SERS tagging strategy, i.e, to covalently attach a known SERS active molecule, a fluorescence dye in many cases, to the biomolecules, hoping that SERS activity of the free dye can be entirely or largely translated to the biomolecule-dye conjugate. To date SERS tagging method has been explored with both DNA and protein detection.13–19 To the best of our knowledge, however, SERS tagging for carbohydrate detection is an entirely unexplored area.
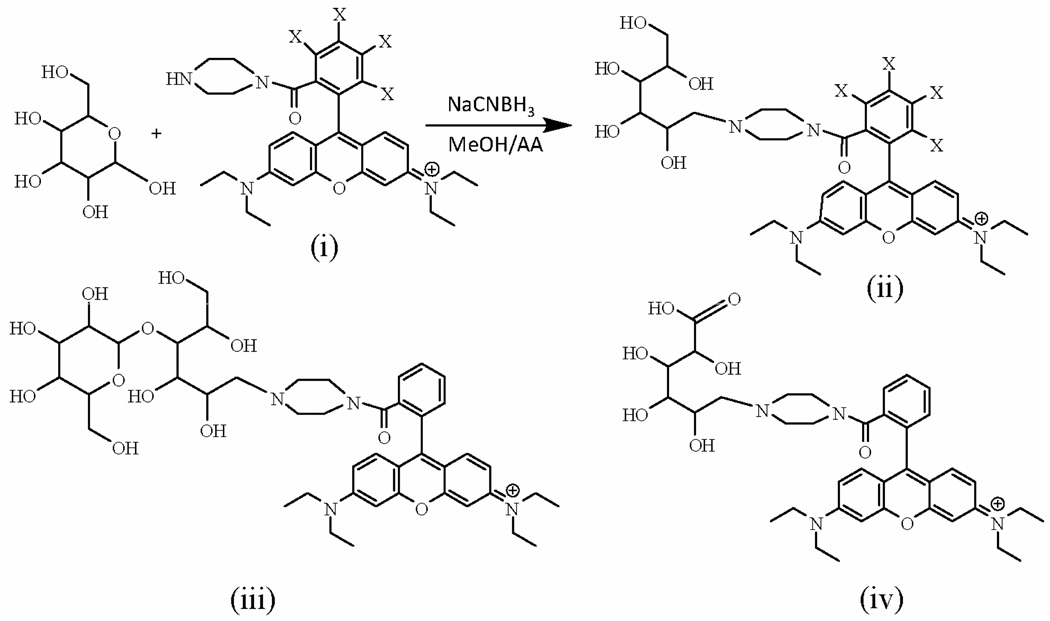
Herein, we demonstrated the first proof-of-concept study of SERS tagging method for carbohydrate detection based on reaction scheme shown in Figure 1. In addition to direct carbohydrate detection based on the SERS signal of the tag molecule, ratiometric SERS quantification was also explored using the pair of the Rhodamine tags that differ only in their isotope substitution (Fig. 1). In order to study the possible effect of carbohydrate charge and the size on the SERS detection sensitivity of this SERS tagging methods, three model carbohydrates, glucose, glucuronic acid and lactose, that differ in chain lengths and/or charge states were included in this investigation. While lactose is a neutral disaccharide consisting of galactose and glucose bonded through a β1→4 glycosidic linkage, glucose is a neutral monosaccharide well-known for its biological significance as an important biomarker for metabolic diseases, such as diabetes. Glucuronic acid (molecular formula: C6H10O7) is a glucose derivative that is produced by oxidation of the hydroxyl group of glucose. Since pKa of the glucuronic acid is 4.8,20 it is negatively charged at neutral pH. As an important food ingredient,21 glucuronic acid plays an essential role in body metabolism as it conjugates with exogenous and endogenous toxic substances to facilitate their excretion into urine or bile.22, 23 Detection of glucuronic acid and its derivatives is important in both food and biomedical research.23
Figure 1.
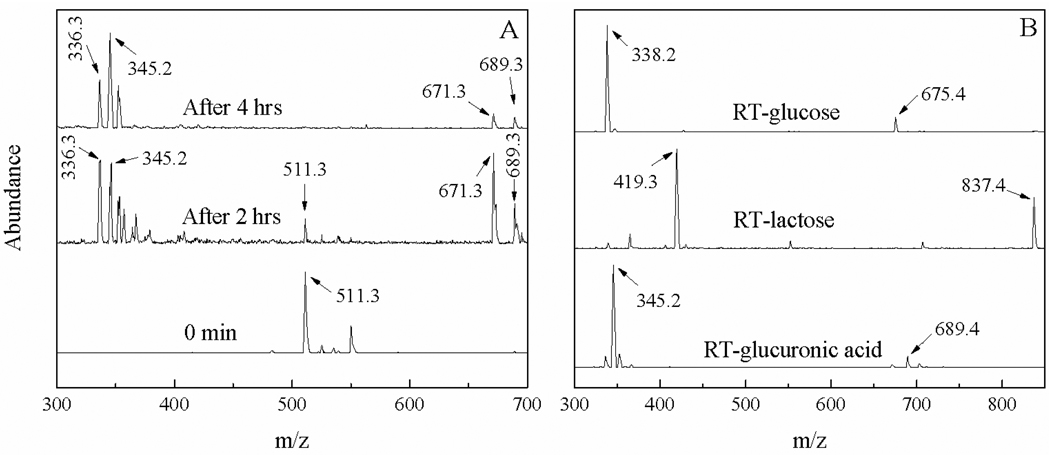
(A) Temporal ESI-MS spectra acquired with RT/glucuronic acid conjugation solution and (B) MS spectra of HPLC purified RT-carbohydrate conjugates.
To our knowledge, the use of Rhodamine B as a tag for carbohydrate detection has not been demonstratedin previous published studies. The choice to use the Rhodamine B derivative as our SERS tag is based on the following considerations: (i) The high SERS and fluorescence activity of the Rhodamine dyes, 24–26 and (ii) the potential to improve MS detection of tagged carbohydrates due to positive charge of the SERS tag moiety.27 As a result, our SERS tagging strategy may provide an advantage for facilitating multimode carbohydrate detection that includes SERS, fluorescence and MS methods. Such a characteristic, on one hand allows us to compare the SERS detection sensitivity with the fluorescence and MS methods. On the other hand, it provides a synergy for parallel or sequential carbohydrate analysis that combines SERS a fluorescence carbohydrate quantification with MS based carbohydrate identification. Such a feature is of tremendous importance in practical glycomic analysis where the information is often required about the identity and quantity of the carbohydrates derived from the biological sample.
EXPERIMENTAL
Chemicals and Instruments
All the reagents used were of analytical grade (Sigma-Aldrich, St. Louis, MO). High-purity water (Nanopure, Thermo Scientific) was used throughout this study. SERS spectra were obtained with LabRam HR Raman microscopy system (Horiba Jobin Yvon, Edison, NJ) with a 633 nm HeNe laser. The spectrograph used in this system has a focal length of 800 mm and a grating of 600 grooves/mm. Two Agilent ESI-MS systems were used in this work. While the progress of the RT-carbohydrate conjugation reaction was monitored using an Agilent 6120 Quadrupole HPLC/MS (Santa Clara, CA), the ESI-MS sensitivity of RT-carbohydrate was determined with a linear ion trap LTQ/Orbitrap XL (ThermoFisher Scientific, San Jose, CA) nanoLC-MS. Fluorescence measurement of the RT and RT-carbohydrates was determined with Olis spectrofluorimeter (Bogart, GA). The UV-Vis measurements were carried out with a Thermo Fisher Scientific Evolution 300 UV-Vis Spectrophotometer (Waltham, MA). The RamChip slides used for SERS spectra acquisition are acquired from Z&S Tech LLC. Before use, the Ramchips were rinsed with Nanopure water and dried under the flow of N2.
Preparation of RTd4
RTd4 was prepared according to published procedures19, 28. Briefly two equivalent of 3-(Diethylamino)phenol and one equivalent of pthalic –d4 anhydride was used in synthesizing rhodamine B-d4. The reaction was carried out at 170°C using o- dichlorobenzene as the solvent19 The product was then purified by flash chromatography using dichloromethane and methanol as the eluant. Rhodamine B-d4 was then treated with piperazine in the presence of HBTU at room temperature to give RTd4 that is also purified flash chromatography. Purified Rhodamine B-d4 and RTd4 were characterized using NMR and MS. Detailed synthetic procedure was given in the supporting information (Scheme S1)..
Synthesis of RT-carbohydrate conjugate
RT was prepared according to the published procedure,26 and was purified using flash column chromatography (Supporting Information, Scheme S2). Conjugation of RT and RTd4 with model carbohydrates was conducted based on the reductive amination reaction.29 Briefly, one equivalent of model carbohydrate was added to the reaction mixture of 1.5 equivalents of labeling RT and four equivalents of reducing agent NaCNBH3 in methanol/acetic acid (7:3). The reaction was carried at 60 °C for 4 hrs. The progression of conjugation reaction is monitored periodically with ESI-MS for every 20 mins by direct injection of the reaction mixture into the Agilent Quadrupole MS unit. Successful conjugation of RTd4 with glucose was confirmed with MS (Supporting Information S1). HPLC purification of the conjugated carbohydrates was conducted using HPLC-MS system with a C18 reversed phase column using acetonitrile and water that contained 1% acetic acid for gradient elution. The water content in the gradient elution changed from 80% to 20%. Because of the drastic difference in their polarity, RT-conjugated carbohydrates can be readily separated from the excessive dyes. Concentration of the RT-conjugated carbohydrates was determined with the UV-Vis by assuming that carbohydrate conjugation doesn’t change the extinction coefficient of the SERS tag that is 96,000 M−1cm−1. 26 Indeed, comparison of the UV-Vis spectra of RT before and after carbohydrate conjugation revealed no significant difference in their UV-Vis spectral profile (Supporting information, figure S2), confirming carbohydrate conjugation has no significant impact on the electronic transition of the Rhodamine tag moiety.
SERS spectral acquisition and data processing
AgNP used for the SERS measurements was prepared using citrate reduction method,30, 31 and it was stored in 4 °C. Typical SERS spectral acquisition was conducted as below: into a 10 µl sample solution 10 µl of as prepared AgNP was added, and the mixture was vortex for ~2 mins before the addition of 10 µl 1% KCl as aggregation agent.30, 32 10 µL of the final mixture was deposited onto a Ramchip slide for SERS spectral acquisition. It is important to note that Ramchip slide is a stainless steel based sample substrate essentially free of Raman and fluorescence background, thus no substrate background subtraction is needed.33 To minimize solvent evaporation, all the SERS spectra were acquired at ambient condition immediately after the sample deposition. Spectral acquisition was conducted with a 10X Olympus objective (NA=0.25) and the laser power before objective was reduced to ~1.3 mW to avoid possible photochemical/photothermal damage. Spectral integration time was varied from 1 s to 60 s. The Raman shift was calibrated using a neon lamp and the wavenumber accuracy is about 0.5 cm−1. The SERS spectral intensity was determined based on the net peak intensity that is calculated by subtracting the baseline intensity from the Raman peak intensity.
Ratiometric SERS glucose quantification
Feasiblity of ratiometric SERS quantification of carbohydrate was demonstrated with glucose only. Briefly a series of RT-glucose and RTd4-glucose mixtures were prepared with concentration ratios from 1:4 to 4:1 and the total RT (or glucose) concentration of 20 nM. Five independent SERS measurements were carried out for each sample.
Fluorescence measurements and data processing
The fluorescence emission spectrum was detected from 500 nm to 657 nm using a 1 mL quartz cell that has a pathlength of 1 cm. Quantization sensitivity of RT and RT-carbohydrate was determined using excitation wavelength of 565 nm, the peak UV-vis absorbance for the RT-carbohydrate, and the fluorescence emission intensity at 588 nm. For each sample an average of four repeated measurements were conducted to improve the spectral signal to noise ratio. The fluorescence intensity is calculated based on intensity difference between the sample and the blank.
pH dependence of SERS on RT and RT-carbohydrate
The pH dependence of SERS signal was investigated with the RT and RT-carbohydrate conjugates, each prepared with 0.1 M NaOH, 0.1 M HCl as well as high purity water respectively. The concentrations of analytes in all the solutions were kept constant at ~700 nM.
ESI-MS detection sensitivity of RT-carbohydrate
The ESI-MS detection sensitivity of the RT-carbohydrate was determined using a linear ion trap nanoLC LTQ/Orbitrap XL HPLC-MS. Briefly, RT-carbohydrates of varying concentrations were first loaded onto a trap cartridge (Agilent, Palo Alto, CA) at a flow rate of 2 µL/min. The trapped RT-carbohydrate were then eluted onto a reversed phase PicoFrit column (New Objective, Woburn, MA) using a linear gradient of acetonitrile (2–60%) containing 0.1% formic acid. The duration of the gradient was 25 mins at a flow rate of 0.25 µL/min. The eluted RT-carbohydrate conjugates were sprayed into a LTQ/Orbitrap mass spectrometer equipped with a nanospray ion source and detected with positive ion mode.
RESULT AND DISCUSSION
RT-carbohydrate conjugation
Reductive amination via a Schiff base was a well-documented method for conjugation of carbohydrate through their reducing end with fluorophore or MS tags for their optical detection or MS detection.34–36 To date, most of reactive groups in the tagging reagents has been either aryl or alkyl primary amines.34, 37, 38 There have been very few reports on carbohydrate conjugations with secondary amine.
Progress of the RT conjugation reaction with the model carbohydrates was monitored with both thin layer chromatography (TLC) and Quadrupole MS. Because of the large difference in their polarity, the mobility of the RT in the TLC plate is drastically different before and after its carbohydrate conjugation. While the TLC allows visual examination of the progress of the reaction, the ESI-MS offers confirmation of the reaction products. Figure 1 shows (A) the temporal MS spectra acquired with the RT/glucuronic acid solution and (B) MS spectra of HPLC purified RT-glucose, RT-lactose and RT-glucuronic acid.
The attenuation in the relative abundance of the molecular ion MS peak of RT (cal. 511.3, exp. 511.3) and the concurrent increment in the abundance of the RT-glucuronic acid (cal 689.5, exp. 689.3) in the MS spectra of the RT/glucuronic acid reaction solution indicate the successful conjugation reaction between RT and the glucuronic acid. Since RT is the limiting reagent in this conjugation reaction, the complete disappearance of RT peak after 4 hours of reaction period indicates that the conjugation reaction between glucuronic acid and RT completes within 4 hours. Similar results were found with the conjugation reactions between RT with glucose and lactose respectively (data not shown), indicating this conjugation reaction doesn’t depend significantly on the charge states and chain length of the three model carbohydrates.
The ESI-MS spectra in Figure 1(B) demonstrated that under our experimental conditions, all of RT-carbohydrate conjugates were dominantly doubly charged (M+ H)2+. This result is not surprising given the fact that the Rhodamine B moiety is singly charged, and the tertiary amine group produced by the reductive amination is most likely protonated under HPLC-ESI Quadrupole MS conditions where the solvent was acidified with 1% acetic acid. It is known the pKa of protonated alkyl amine is in the range of 9 to 11. As a result, the most of tertiary amine groups are protonated in neutral and acidic solutions. As for the glucuronic acid, since the pH value of HPLC solvent is about ~ 3, which significantly smaller than its pKa (4.8) of glucuronic acid,20 no significant ionization of the carboxyl group is expected for this functional group. As a result, most of the RT-glucuronic acid is doubly charged under our spectral acquisition conditions, similar to RT-glucose and RT-lactose. It is interesting to note, however, compared to the RT-lactose for which the ratio between the singly charged and doubly charged molecular ions is about 1:2, the ratio of the doubly charged RT-glucuronic acid and RT-glucose is significantly higher (singly:doubly charged ~ 1:4). Detailed reason for this difference is currently unclear; the results shown in Fig. 1 clearly demonstrate the successful synthesis of the RT-carbohydrate conjugate as depicted in the reaction scheme 1.
Scheme 1.
Conjugation of the Rhodamine-based tag (RT) with model carbohydrates via the reductive amination reaction. (i) X=H, RT; X=D, RTd4 (ii) X=H, RT-glucose; X=D, RTd4-glucose, (iii) RT-lactose, (iv) RT-glucuronic acid
SERS spectra of the RT-carbohydrate conjugates
The representative SERS spectra of RT and RT conjugated with three model carbohydrates were shown in Fig. 2 while the sample concentration of all the samples were kept ~50 nM. Evidently, all the samples have the essentially identical SERS features, indicating (a) the SERS feature of the RT moiety dominates the SERS spectra of the RT-carbohydrate conjugates and (b) carbohydrate conjugation has no significant discernible impact on the SERS spectral feature of RT. This result is not surprising given the single molecule SERS sensitivity demonstrated for Rhodamine dye such as Rhodamine 6G.8, 24 One important implication of this result is that like the fluorophore tagging, this SERS tagging method may be used for quantification of RT-carbohydrate conjugate but can’t identify the carbohydrate to which the RT is conjugated to. As a result, for practical glycomic analysis where the identity and quantity of carbohydrates derived from biological samples are often needed, this SERS tagging strategy has to been used in tandem with carbohydrate identification techniques such as MS method.
Figure 2.
SERS spectra of (a) RT, (b) RT-glucuronic acid, (c) RT-lactose, and (d) RT-glucose. Concentration of all the samples is 50 nM in concentration. Spectra were scaled and offset for clarity.
pH dependence of the SERS signal
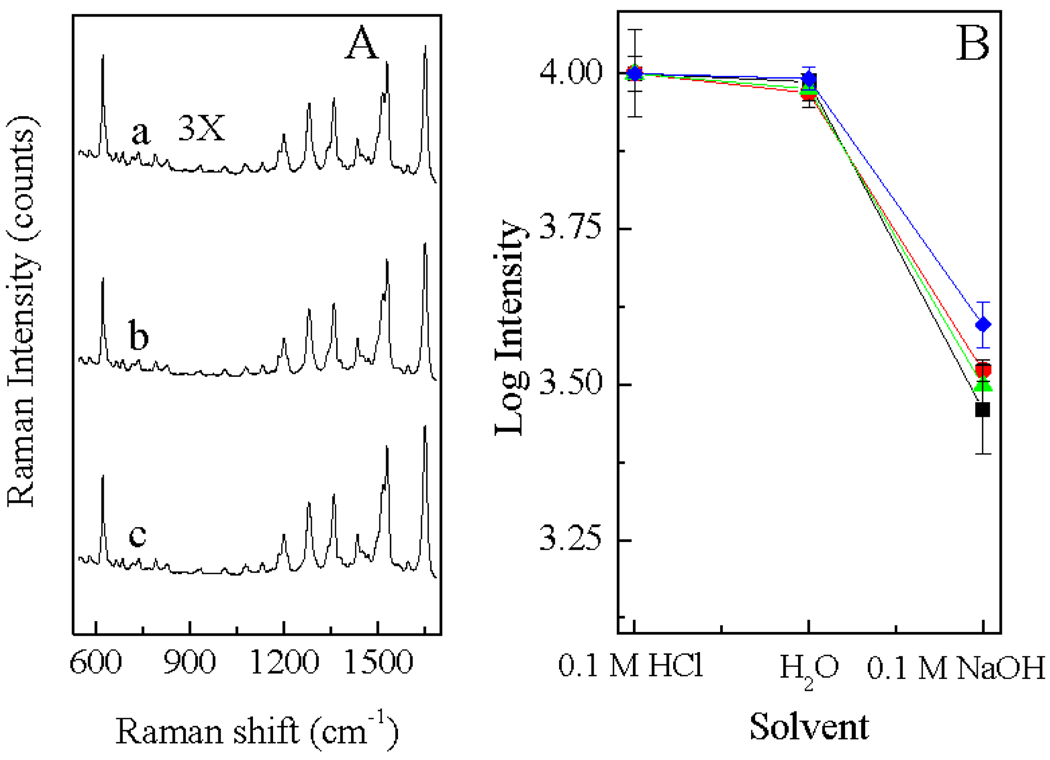
To be SERS active, the molecule of interest has to be in the close proximity to the SERS active surface through chemical bonding or physical adsorption. Since AgNP used in the SERS measurements was produced by the citrate reduction and is thus negatively charged,39, 40 the charge states of the analyte may play a significant role in the analyte adsorption onto the AgNP surface, which in turn change the SERS activity of the analyte molecule. For RT and RT–carbohydrates, while the Rhodamine moiety is positively charged, the protonization state of the secondary amine or the tertiary amine and the carboxyl group in RT-glucuronic acid are pH dependent. Investigation of the possible pH dependence of the SERS signal of RT-carbohydrate conjugates is important for optimization of the experimental conditions for optimal SERS detection of RT conjugated carbohydrates. Figure 3 (A) shows the representative SERS spectra of RT in 0.1 M NaOH, 0.1 M HCl and in water, and Fig 3(B) demonstrated the relative SERS intensity of RT, RT-carbohydrate conjugates in these solvents. It should be noted that for each sample, the spectral intensity were normalized so that the average SERS intensity in the spectrum of the acidic solution is 10,000 counts.
Figure 3.
(A) SERS spectra of RT in (a) 0.1 M NaOH, (b) water and (c) 0.1 M HCl. Spectra was plotted in the same scale but offsetted for clarity. (B) pH dependence of the SERS signal of RT (blue diamonds), RT-glucuronic acid (red circles), RT-glucose (black squares) and RT-lactose (green triangles). For each sample, the spectral intensity was normalized so that its average SERS intensity at acidic pH is 10,000 counts.
The result in Fig. 3(A) shows that the SERS spectral profile (peak correlations) of RT were identical in all the three pH conditions tested. Similar results were found for the RT-carbohydrate conjugates at different pHs (data not shown). However, in contrast to their SERS spectral profile that is pH independent, the SERS signal intensity of the all the analytes exhibited remarkable pH dependence as shown in Fig. 3(B). For each sample, similar SERS intensity was observed in the acidic and neutral solutions, which is about 3 to 5 times higher than the SERS signal obtained with the basic solution. While the similar SERS activity between their respective acidic and neutral pH solution is expected for RT-lactose and RT-glucose is somewhat expected as for both analyte the charge state remained unchanged between these pH conditions, the similar SERS activity for glucuronic acid at neutral and acidic solution can be perplexing. As demonstrated with the ESI-MS spectra of RT-glucuronic acid shown in Fig. 2, RT-glucuronic acid is doubly positively charged at acidic pH. However, at neutral pH RT-glucuronic acid is most likely to be singly positively charged because of the ionization of the carboxyl group, thus the affinity of RT-glucuronic acid to the AgNP is likely different at acidic and neutral pHs. The similar pH dependence of the SERS signal of three RT-carbohydrate conjugates and RT itself suggests that charge state of the carbohydrate moiety has no significant impact on the SERS characteristic of the RT-carbohydrate conjugates. The lower SERS activity of RT and RT-carbohydrates at their basic solutions may be associated with the fact the structural modification in the RT moiety at this pH. Indeed, UV-Vis measurement shows that unlike the RT in H2O and 0.1 M HCl that has similar UV-Vis spectral features, the peak UV absorbance of RT dissolved in 0.1M NaOH is blue-shifted 2 nm (Supporting Information, figure S3).
SERS Sensitivity
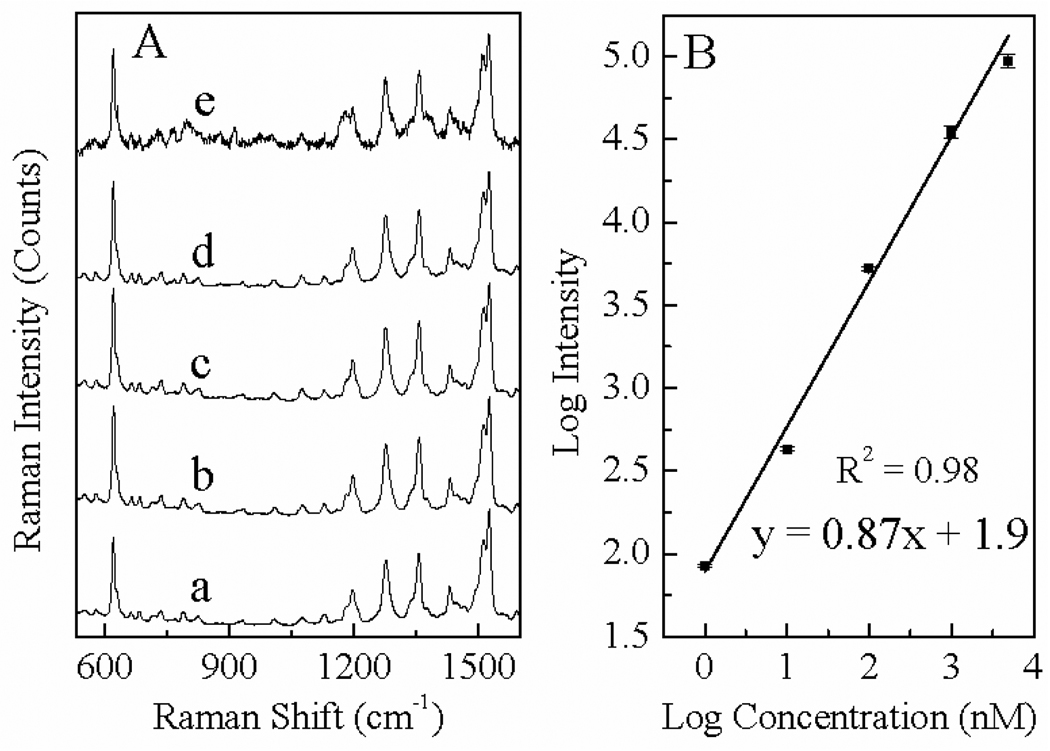
Since the acidic and neutral solution of RT and RT-carbohydrates exhibit higher SERS activities, the SERS detection sensitivity of RT-carbohydrate was determined with the HPLC purified RT-carbohydrate diluted 0.1 M HCl. Figure 4 shows (A) the representative SERS spectra obtained with the RT-glucose of different concentrations and (B) the correlations between the SERS signal intensity and concentrations of RT-glucose, both in logarithm scale. The SERS intensity was calculated based on the Raman intensity at 613 cm−1, and the spectral intensity was normalized to the spectral integration time.
Figure 4.
(A) SERS spectra of RT-glucose of concentrations of (a) 5 µM (b) 1 µM (c) 100 nM (d) 10 nM (e) 1 nM. The spectra were scaled and offset for clarity. (B) Correlation of the SERS intensity and concentration of RT-glucose, both in logarithmic scale.
The SERS spectra in Figure 4(A) demonstrate that quality SERS spectra can be acquired with RT-glucose with sample concentration as low as 1 nM. Spectral quality of further diluted sample is significantly worse, indicating that under our current experimental condition (633 nm HeNe excitation), the SERS sensitivity of the RT-glucose is in the range of 1 nM. Similar results were obtained with RT-glucuronic acid and RT-lactose (data not shown), indicating that for these three model carbohydrates, the SERS sensitivity of RT-carbohydrates has no significant dependence on the charge and chain length of the carbohydrate moieties. Considering the fact that the sample volume used in our SERS measurement is 10 µL, our detection sensitivity in terms of total sample consumption of RT-carbohydrate is 10 fmol, which is significantly better than the ~1 pmol fluorescence sensitivity reported in the literature for 8-aminopyrenesulfonic-acid conjugated monosaccharides.5
It should be noted that further improvement in our SERS detection scheme is possible by using surface enhanced resonance Raman excitation. Previous research has demonstrated that by resonance Raman excitation, 10 to 100 times improvement in the SERS sensitivity can be achieved.41, 42 Indeed, to date, most of the single molecule SERS was demonstrated with resonance Raman excitation.43, 44
Another important note is that, compared to the 100 pM SERS sensitivity of RT alone (without carbohydrate conjugation) obtained under our current spectral acquisition condition (data not shown), the 1 nM SERS limit-of-detection of RT-carbohydrate conjugate is about 10 times higher. The reduced sensitivity is presumably due to the fact that as carbohydrates are a class of highly water-soluble molecules, the affinity of the dye to the AgNP may be reduced after its conjugation to carbohydrate. Imaginatively the free energy associated with RT adsorption onto AgNP can be very different from the RT-carbohydrate as the later likely has lower salvation free energy. Detailed understanding of causes of SERS sensitivity difference between RT and RT-carbohydrate requires further experimental and theoretical work and it is beyond the scope of current study.
Results in Fig. 4(B) demonstrates a strong correlation between the SERS intensity and the analyte concentration over the concentration range from 1 nM to 5 µM, indicating the possibility for prediction of carbohydrate concentrations based on its SERS intensity in this calibration range. Excellent SERS spectra were obtained with RT-glucose samples with concentration of 10 µM or above, however, their SERS signal intensity because relatively constant for those highly concentrated samples, suggesting the RT-glucose reaches saturation packing on the AgNP surface at a sample concentration between 5 to 10 µM. This result indicates that linear dynamic range of this SERS detection scheme is from 1 nM to 5 µM under our current spectral acquisition conditions.
It is important to note that even though the R2 value, the measure of the goodness-of-fitting of the calibration curve in Fig. 4(B), is high, prediction of RT-carbohydrate concentration based on the SERS intensity may not be reliable for many applications which requires high quantification accuracy. Because of the wide sample calibration range (about four orders of magnitude) for the data shown in Fig 4(B), even relatively large quantification error may not appear significant in the calibration curve. Indeed, the largest relative standard deviation for the result shown in the Fig. 4(B) is ~ 20%, which can be too high for applications in which detecting a small difference in carbohydrate levels is important.
It is important to note that the SERS signal is not linearly dependent on sample concentration although on a logarithmic scale, the SERS signal may be approximated to be linearly dependent on sample concentration as shown in Fig. 4B. Indeed, if the SERS signal is linearly correlated to sample concentration, the slope in the log-log calibration curve in Fig. 4(B) should be 1, rather than the 0.87 observed in this work. Exact reasons for such a deviation are beyond the scope of the current work. Key factors may include (i) the intrinsically nonlinear dependence of analyte adsorption onto SERS substrates, (ii) signal variations from AgNP aggregations, laser heating, etc. Nevertheless, the result shown in Fig 4 clearly demonstrates the excellent SERS sensitivity and wide dynamic range of the RT conjugated carbohydrates.
Ratiometric SERS glucose quantification
Ratiometric SERS with an isotope substituted internal reference is a reliable SERS quantification technique28, 33. In this method, a known amount of internal reference that has the same molecular structure as the analyte but differs only in its isotope substitution, is added into the SERS sample. Because the analyte and the internal reference have essentially the same interfacial interaction characteristics with the same substrates, the concentration of the analyte can be deduced from the SERS intensity ratio of the analyte and the internal reference.
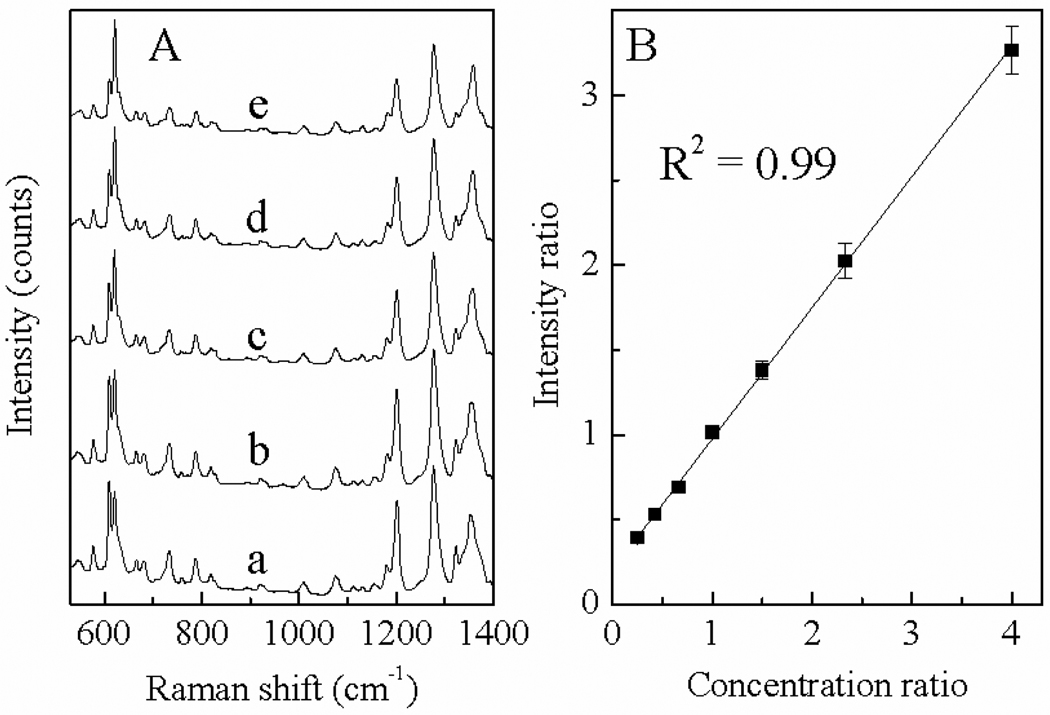
Ratiometric SERS carbohydrate quantification was demonstrated using glucose tagged with RT and RTd4. As expected from our experience with isotope substituted R6G28, there are small but definitive differences between the SERS spectra of RT-glucose and RTd4-glucose (Supporting information, figure S4). Such differences are sufficient for quantitative resolution of spectral contribution of individual analytes to the mixture SERS spectra according to the peak intensity specific for RT and RTd4 (figure S4). Fig. 5 shows the SERS spectra acquired with a series of RT-glucose and RTd4-glucose mixtures together with the correlations between the spectral peak intensity ratios with the concentration ratios. The excellent correlation in this calibration curve indicates that the concentration ratio can be accurately and precisely predicted looking at the peak intensity ratio of RT and RTd4. In addition to improving the SERS quantification accuracy of RT-carbohydrate, this ratiometric SERS technique may also be used for comparative glycomic analysis where two glycan samples are separately tagged with RT and RTd4 before combined together for ratiometric quantification.
Figure 5.
Ratiometric SERS quantification of RT and RTd4 conjugated glucose. (A) representative SERS spectra of RT-glucose and RTd4-glucose mixture with total glucose concentration of 20 nM and concentration ratio from 7:3, 6:4, 5:5, 4:6, 3:7. (B) calibration curve correlating the SERS intensity ratio of RT-glucose/RTd4-glucose to their concentration ratio.
Fluorescence of RT-carbohydrate
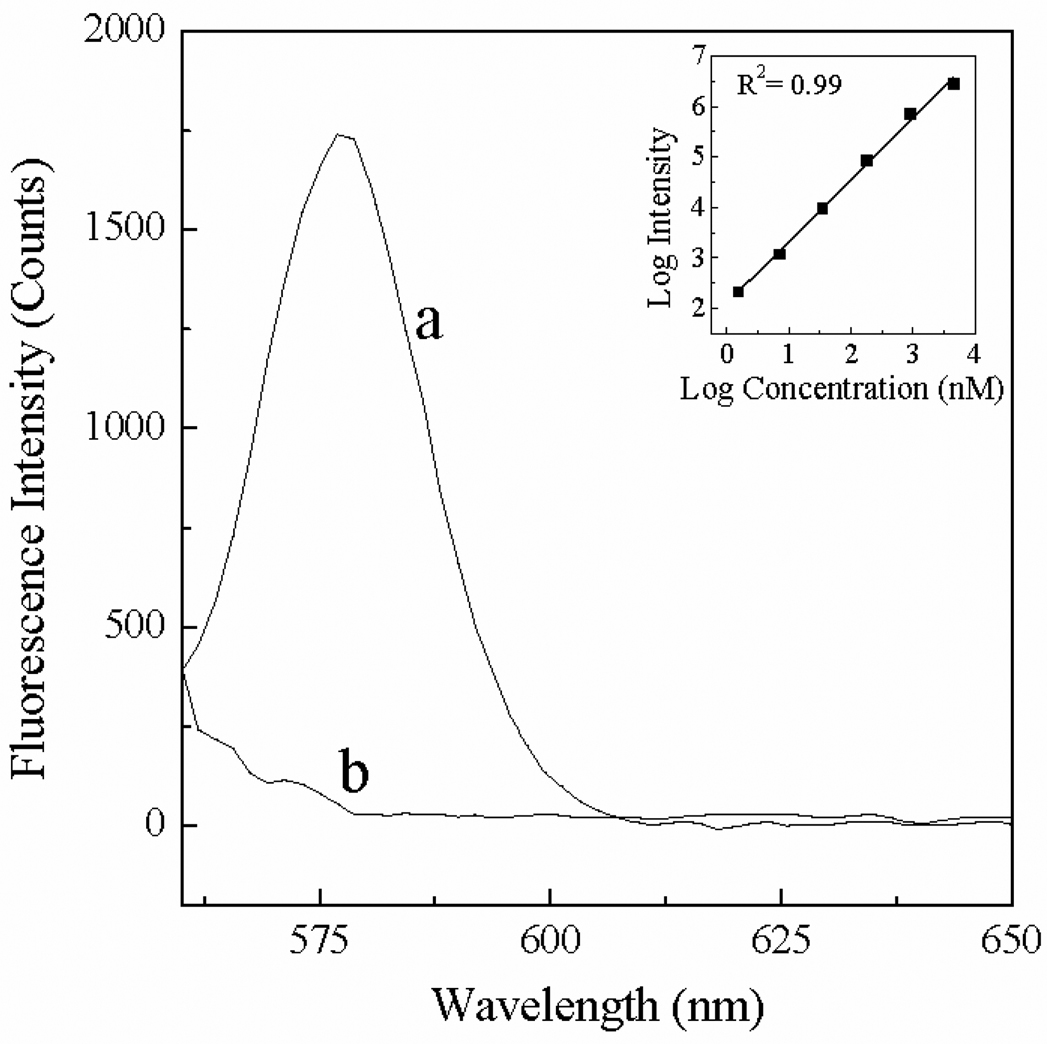
Rhodamine dyes are well-known for their fluorescence activity.24 As a result, in addition to their SERS detection, the RT-carbohydrate conjugates are also amenable for fluorescence detection. Fig. 6 shows the fluorescence spectra of 7 nM and 1 nM RT-glucose dissolved in water. Evidently the detection limit of the fluorescence method is somewhere between 7 nM and 1 nM. Result in the inset shows the correlation between the fluorescence intensity of RT-glucose with its concentration. Similar fluorescence spectra were obtained with RT-glucuronic acid, the other RT-carbohydrate tested with the fluorescence method (Supporting information, figure S5). Both the RT-glucose and glucuronic acid data suggest the fluorescence sensitivity of the RT-carbohydrates is ~ 3 nM in sample concentration and 3 pmol in total sample consumption (3 nM × 1 mL).
Figure 6.
The fluorescence spectra of RT-glucose with concentration of (a) 7 nM and (b) 1 nM. Inset showing the correlation between fluorescence intensity and concentration.
ESI-MS Detection of RT-carbohydrates
One key limitation in current fluorescence and SERS tagging methods is their inability in biomolecule identification as the optical spectral features of the tagged biomolecules often contain no structural information of the biomolecule moiety. In practical bioanalytical applications where information about quantity and identity of the biomolecules is often desired, the fluorescence and SERS method should be used in combination with a technique that can provide structural information of the molecule, which is mass spectrometry in most of the cases. 45–48 One key advantage of this Rhodamine dye/carbohydrate tagging is the positive charge of the Rhodamine moiety possesses, which facilitates the MS detection of the RT conjugated carbohydrates. As shown in the previous section, because of the positive charge of the Rhodamine dye and the alkalinity of piperazine moiety in the RT, molecular ion of RT conjugated carbohydrates can be readily detected under mild MS ionization conditions such as ESI. Clearly exploration of the ESI-MS sensitivity for RT conjugated carbohydrates is important to demonstrate the feasibility of this SERS tagging strategy for tandem SERS and MS measurement of carbohydrates.
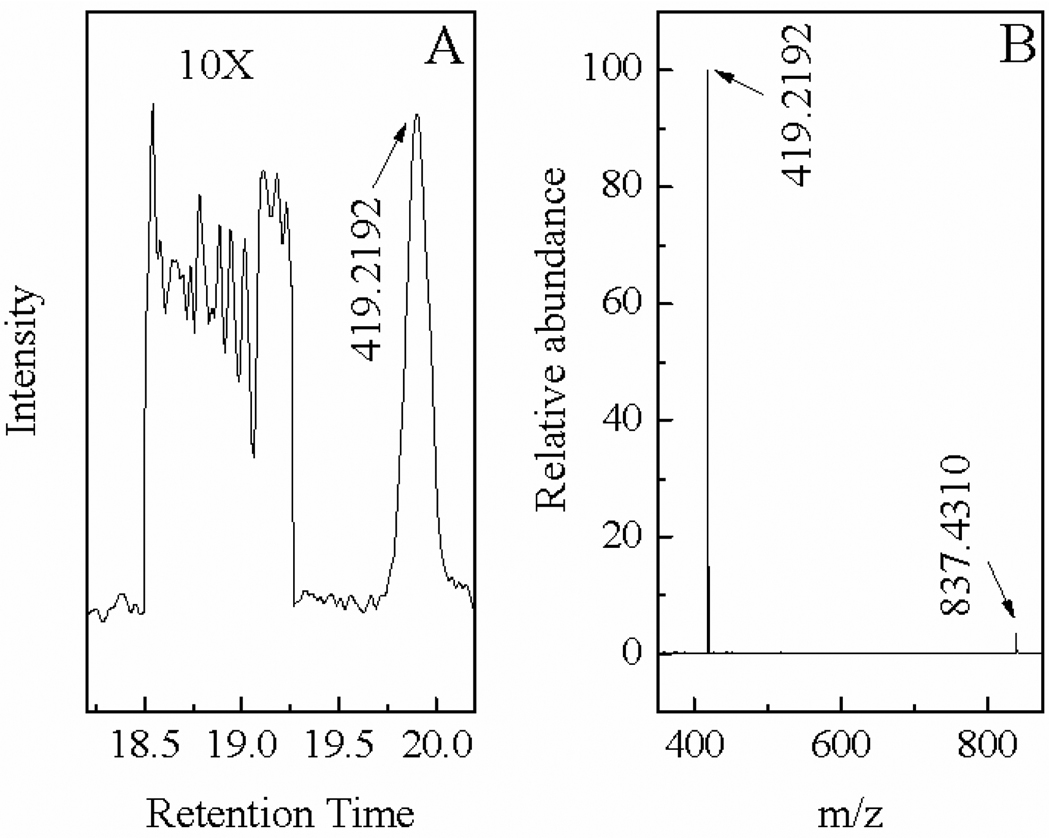
The Fig. 7 (A) shows the molecular ion current chromatograph of RT-lactose with total sample injection of 10 fmol, where a section of background signal was amplified 10 times to facilitate the determination of the signal to noise ratio of the chromatographic peak with m/z of 419.2192 for the doubly charged molecular ion of RT-lactose. Assuming the peak-to-peak noise in the chromatogram equal 3σ, where σ is the standard derivation of the noise, it can be calculated the signal-to-noise ratio of the chromatographic peak is ~30.
Figure 7.
(A) The ion current LC chromatogram of RT-lactose obtained with 10 fmole sample. The 419.2192 is the doubly charged molecular ion of RT-lactose. The background is amplified 10 times. (B) The ESI-MS spectrum of 1 pmol RT-lactose where 837.4310 is single charged RT-lactose.
Using the definition that detection limit of an analyte is the quantity of the analyte that gives rise signal 3 times higher than the standard deviation of the background signal plus the blank response,49 our current MS sensitivity, achieve with a linear ion trap ESI-MS, is ~1 fmol for RT-lactose. Similar result was achieved with RT-glucose and RT-glucuronic acid. Presumably the key to this exceedingly high MS sensitivity that all the RT-carbohydrate is positively charge so the high ionization efficiency of the analyte is ensured. In addition, as shown in Fig. 7(B), because of the softness of the electrospray ionization method, all the ionic species are either doubly or singly charged molecular ions of the analytes and there is essentially no further molecular ion fragmentation. Clearly both high ionization efficiency and simple ionization pattern are critical for the high MS detection sensitivity observed with the RT-carbohydrates.
It should be noted that the ESI-MS sensitivity is highly instrument dependent. While 1 fmol sensitivity was achieved with a linear ion trap MS instrument (LTQ/Orbitrap XL nanoLC-MS), RT-carbohydrates with concentrations as high as 1 µM couldn’t be detected with an Agilent 6120 Quadrupole HPLC/MS that we had used to monitor the conjugation reaction of RT and carbohydrate. One key feature for the improved limit of detection of the nano-LC-MS lies in its ability to concentrate analytes in the C18 reverse phase column and then inject the trapped analytes into the MS as a plug.
CONCLUSION
Using glucose, lactose and glucuronic acid as model carbohydrates, we demonstrated the first SERS tagging method for carbohydrate detection using a Rhodamine based dye as the SERS tag. Ratiometric SERS carbohydrate quantification was demonstrated using glucose tagged with RT and RTd4. Current SERS detection of the RT conjugated carbohydrate has a detection sensitivity of 1 nM in concentration and has a linear dynamic range from 1 nM to 5 µM. Further improvement of the SERS sensitivity by one to two orders of magnitude is expected with resonance Surface enhanced Raman excitation. Result from the three model carbohydrates glucose, lactose and glucuronic acid that differ in charge states and chain lengths showed no significant differences on their SERS tag labeling efficiency or in the SERS and fluorescence characteristics of the SERS tags. Definitive determination how carbohydrate affects the SERS and ESI-MS detection of the Rhodamine tag requires future investigation using carbohydrate with longer chain length and with more structural complexity.
In addition to its excellent SERS sensitivity, Rhodamine-tagged carbohydrates also exhibit low nM fluorescence and low fmol ESI-MS sensitivity. This feature is advantageous for multimode spectroscopic or spectrometric characterization of carbohydrates in complex mixtures where thousands of carbohydrates may be first quantified using fluorescence and/or Raman spectroscopic methods and then identified with MS. Such a scheme can be used for comparative glycomic analysis resulting in biomarker discovery and detection.
Supplementary Material
ACKNOWLEDGMENT
D.Z thanks Dr. Ed Lewis for allowing the use of the fluorimeter for the fluorescence measurement. This work was supported by a start-up funding from the Department of Chemistry at Mississippi State University provided to D.Z. and in part by the Intramural Research Program of the National Institute on Aging to S.Z and R.S.
Footnotes
Supporting Information Available. Detailed synthesis of Rhodamine tags (RT, RTd4), UV-Vis spectra of RT before and after conjugation, UV-Vis spectra of RT dissolved in different pH solutions, SERS spectra of RT-glucose and RTd4-glucose, fluorescence RT-glucuronic acid fluorescence sensitivity. This information is available free of charge via internet at http://pubs.acs.org.
REFERENCES
- 1.Jang K-S, Kim Y-G, Gil G-C, Park S-H, Kim B-G. Anal. Biochem. 2009;386:228–236. doi: 10.1016/j.ab.2008.12.015. [DOI] [PubMed] [Google Scholar]
- 2.Naven TJP, Harvey DJ. Rapid Commun. Mass Spectrom. 1996;10:829–834. doi: 10.1002/(SICI)1097-0231(199608)10:11<1361::AID-RCM642>3.0.CO;2-A. [DOI] [PubMed] [Google Scholar]
- 3.Gouw JW, Burgers PC, Trikoupis MA, Terlouw JK. Rapid Commun. Mass Spectrom. 2002;16:905–912. doi: 10.1002/rcm.654. [DOI] [PubMed] [Google Scholar]
- 4.Gil G-C, Kim Y-G, Kim B-G. Analytical Biochemistry. 2008;379:45–59. doi: 10.1016/j.ab.2008.04.039. [DOI] [PubMed] [Google Scholar]
- 5.Racaityte K, Kiessig S, Kálmán F. J. Chromatogr. A. 2005;1079:354–365. doi: 10.1016/j.chroma.2005.03.080. [DOI] [PubMed] [Google Scholar]
- 6.Kooy FK, Ma M, Beeftink HH, Eggink G, Tramper J, Boeriu CG. Anal. Biochem. 2009;384:329–336. doi: 10.1016/j.ab.2008.09.042. [DOI] [PubMed] [Google Scholar]
- 7.Song X, Xia B, Lasanajak Y, Smith D, Cummings R. Glycoconjugate J. 2008;25:15–25. doi: 10.1007/s10719-007-9066-8. [DOI] [PubMed] [Google Scholar]
- 8.Nie S, Emory SR. Science. 1997;275:1102. doi: 10.1126/science.275.5303.1102. [DOI] [PubMed] [Google Scholar]
- 9.Grubisha DS, Lipert RJ, Park H-Y, Driskell J, Porter MD. Analytical Chemistry. 2003;75:5936–5943. doi: 10.1021/ac034356f. [DOI] [PubMed] [Google Scholar]
- 10.Ni J, Lipert RJ, Dawson GB, Porter MD. Analytical Chemistry. 1999;71:4903–4908. doi: 10.1021/ac990616a. [DOI] [PubMed] [Google Scholar]
- 11.Shafer-Peltier KE, Haynes CL, Glucksberg MR, Van Duyne RP. J. Am. Chem. Soc. 2002;125:588–593. doi: 10.1021/ja028255v. [DOI] [PubMed] [Google Scholar]
- 12.Mrozek MF, Weaver MJ. Anal. Chem. 2002;74:4069. doi: 10.1021/ac020115g. [DOI] [PubMed] [Google Scholar]
- 13.Han XX, Kitahama Y, Itoh T, Wang CX, Zhao B, Ozaki Y. Analytical Chemistry. 2009;81:3350–3355. doi: 10.1021/ac802553a. [DOI] [PubMed] [Google Scholar]
- 14.Han XX, Kitahama Y, Tanaka Y, Guo J, Xu WQ, Zhao B, Ozaki Y. Analytical Chemistry. 2008;80:6567–6572. doi: 10.1021/ac800642g. [DOI] [PubMed] [Google Scholar]
- 15.Stokes R, Macaskill A, Lundahl P, Smith W, Faulds K, Graham D. Small. 2007;3:1593–1601. doi: 10.1002/smll.200600662. [DOI] [PubMed] [Google Scholar]
- 16.Demers LM, Mirkin CA, Mucic RC, Reynolds RA, Letsinger RL, Elghanian R, Viswanadham G. Analytical Chemistry. 2000;72:5535–5541. doi: 10.1021/ac0006627. [DOI] [PubMed] [Google Scholar]
- 17.Wang H-N, Vo-Dinh T. Nanotechnology. 2009;20:065101. doi: 10.1088/0957-4484/20/6/065101. [DOI] [PMC free article] [PubMed] [Google Scholar]
- 18.Chen Z, Tabakman SM, Goodwin AP, Kattah MG, Daranciang D, Wang X, Zhang G, Li X, Liu Z, Utz PJ, Jiang K, Fan S, Dai H. Nature Biotechnology. Vol. 26. Nature Publishing Group; 2008. pp. 1285–1292. [DOI] [PubMed] [Google Scholar]
- 19.Deb SK, Davis B, Knudsen GM, Gudihal R, Ben-Amotz D, Davisson VJ. Journal of the American Chemical Society. 2008;130:9624–9625. doi: 10.1021/ja800772p. [DOI] [PMC free article] [PubMed] [Google Scholar]
- 20.Delattre C, Michaud P, Courtois J, Vijayalakshmi MA. Current Science. 2008;94:1279. [Google Scholar]
- 21.Gomis DB, Tamayo DM, Valles BS, Mangas Alonso JJ. J. Agric. Food. Chem. 2003;52:201–203. doi: 10.1021/jf034697u. [DOI] [PubMed] [Google Scholar]
- 22.Chan TS, Wilson JX, Selliah S, Bilodeau M, Zwingmann C, Poon R, O'Brien PJ. Toxicol. Appl. Pharmacol. 2008;232:456–462. doi: 10.1016/j.taap.2008.07.020. [DOI] [PubMed] [Google Scholar]
- 23.He Y-Q, Yang L, Liu H-X, Zhang J-W, Liu Y, Fong A, Xiong A-Z, Lu Y-L, Yang L, Wang C-H, Wang Z-T. Chem. Res. Toxicol. 2010;23:591–599. doi: 10.1021/tx900328f. [DOI] [PubMed] [Google Scholar]
- 24.Dieringer JA, Lettan RB, Scheidt KA, Van Duyne RP. Journal of the American Chemical Society. 2007;129:16249–16256. doi: 10.1021/ja077243c. [DOI] [PubMed] [Google Scholar]
- 25.Nie S, Emory SR. Science. 1997;275:1102–1106. doi: 10.1126/science.275.5303.1102. [DOI] [PubMed] [Google Scholar]
- 26.Nguyen T, Francis MB. Organic Letters. 2003;5:3245–3248. doi: 10.1021/ol035135z. [DOI] [PubMed] [Google Scholar]
- 27.Chen S-H, Hsu J-L, Lin F-S. Analytical Chemistry. 2008;80:5251–5259. doi: 10.1021/ac800436j. [DOI] [PubMed] [Google Scholar]
- 28.Zhang D, Xie Y, Deb SK, Davison VJ, Ben-Amotz D. Analytical Chemistry. 2005;77:3563–3569. doi: 10.1021/ac050338h. [DOI] [PubMed] [Google Scholar]
- 29.Xia B, Feasley CL, Sachdev GP, Smith DF, Cummings RD. Analytical Biochemistry. 2009;387:162–170. doi: 10.1016/j.ab.2009.01.028. [DOI] [PMC free article] [PubMed] [Google Scholar]
- 30.Yoshikawa HAT, Sasaki G, Matsui T, Nakagima K, Masuhara H. J. Of Opt. A : Pure Appl. Opt. 2007;9:164–171. [Google Scholar]
- 31.Leopold N, Lendl B. The Journal of Physical Chemistry B. 2003;107:5723–5727. [Google Scholar]
- 32.Wang NYHF, Zhu x, Zhang R, Wang Y, Huang GF, Zhang ZR. Nanotechnoloy. 2009;20:315603–315609. doi: 10.1088/0957-4484/20/31/315603. [DOI] [PubMed] [Google Scholar]
- 33.Zhang D, Ansar SM. Analytical Chemistry. 2010;82:5910–5914. doi: 10.1021/ac1010124. [DOI] [PubMed] [Google Scholar]
- 34.Anumula KR. Anal. Biochem. 2006;350:1–23. doi: 10.1016/j.ab.2005.09.037. [DOI] [PubMed] [Google Scholar]
- 35.Bigge JC, Patel TP, Bruce JA, Goulding PN, Charles SM, Parekh RB. Analytical Biochemistry. 1995;230:229–238. doi: 10.1006/abio.1995.1468. [DOI] [PubMed] [Google Scholar]
- 36.Dalpathado DS, Hui J, Kater MA, Desaire H. Analytical & Bioanalytical Chemistry. Vol. 381. Springer Science & Business Media B.V; 2005. pp. 1130–1137. [DOI] [PubMed] [Google Scholar]
- 37.Halkes KM, Souza ACd, Maljaars CEP, Gerwig GJ, Kamerling JP. Eur. J. Org. Chem. 2005;2005:3650–3659. [Google Scholar]
- 38.Xia B, Kawar Ziad S, Ju T, Alvarez Richard A, Sachdev Goverdhan P, Cummings Richard D. Nature Methods. 2005;2:845–850. doi: 10.1038/nmeth808. [DOI] [PubMed] [Google Scholar]
- 39.Tan S, Erol M, Sukhishvili S, Du H. Langmuir. 2008;24:4765–4771. doi: 10.1021/la703831q. [DOI] [PubMed] [Google Scholar]
- 40.Lee PC, Meisel D. J. Phys. Chem. 1982;86:3391–3395. [Google Scholar]
- 41.Pieczonka NPW, Moula G, Aroca RF. Langmuir. 2009;25:11261–11264. doi: 10.1021/la902486w. [DOI] [PubMed] [Google Scholar]
- 42.Jensen L, Schatz GC. The Journal of Physical Chemistry A. 2006;110:5973–5977. doi: 10.1021/jp0610867. [DOI] [PubMed] [Google Scholar]
- 43.Pieczonka NPW, Aroca RF. Chem Soc Rev. 2008;37:946–954. doi: 10.1039/b709739p. [DOI] [PubMed] [Google Scholar]
- 44.Bravo-Vasquez J-P, Fenniri H. The Journal of Physical Chemistry C. 2009;113:12897–12900. [Google Scholar]
- 45.Goetz JA, Novotny MV, Mechref Y. Analytical Chemistry. 2009;81:9546–9552. doi: 10.1021/ac901363h. [DOI] [PubMed] [Google Scholar]
- 46.Atwood JA, Cheng L, Alvarez-Manilla G, Warren NL, York WS, Orlando R. Journal of Proteome Research. 2007;7:367–374. doi: 10.1021/pr070476i. [DOI] [PubMed] [Google Scholar]
- 47.Sato Y, Suzuki M, Nirasawa T, Suzuki A, Endo T. Analytical Chemistry. 2000;72:1207–1216. doi: 10.1021/ac9908750. [DOI] [PubMed] [Google Scholar]
- 48.Morelle W, Michalski J-C. Nat. Protocols. 2007;2:1585–1602. doi: 10.1038/nprot.2007.227. [DOI] [PubMed] [Google Scholar]
- 49.Skoog DA, West DM, Holler FJ, Crouch SR. Fundamentals of Analytical Chemistry. Eigth ed. Thomson Brooks/Cole; 2004. [Google Scholar]
Associated Data
This section collects any data citations, data availability statements, or supplementary materials included in this article.


