Abstract
One of the major challenges of functional magnetic resonance imaging (fMRI) data analysis is to develop simple and reliable methods to correlate brain regions with functionality. In this paper, we employ a detrending-based fractal method, called detrended fluctuation analysis (DFA), to identify brain activity from fMRI data. We perform three tasks: (a) Estimating noise level from experimental fMRI data; (b) Assessing a signal model recently introduced by Birn et al.; and (c) Evaluating the effectiveness of DFA for discriminating brain activations from artifacts. By computing the receiver operating characteristic (ROC) curves, we find that the ROC curve for experimental data is similar to the curve for simulated data with similar signal-to-noise ratio (SNR). This suggests that the proposed algorithm for estimating noise level is very effective and that Birn’s model fits our experimental data very well. The brain activation maps for experimental data derived by DFA are similar to maps derived by deconvolution using a widely used software, AFNI. Considering that deconvolution explicitly uses the information about the experimental paradigm to extract the activation patterns whereas DFA does not, it remains to be seen whether one can effectively integrate the two methods to improve accuracy for detecting brain areas related to functional activity.
Keywords: fMRI, Detrended fluctuation analysis, Brain activation identification, Noise estimation
Introduction
In the past decade, functional magnetic resonance imaging (fMRI) has emerged as a powerful non-invasive tool for studying brain function. One of the major tasks of fMRI data analysis is to find a few localized brain regions that are involved in certain functionality by studying huge but noisy fMRI data. In recent years, tremendous effort has been made to develop novel signal/image processing algorithms for analyzing fMRI data (Worsley and Friston 1995; Glover 1999; Bullmore et al. 2001; Thurner et al. 2003; Shimizu et al. 2004; Masayuki et al. 2004; Sun et al. 2004; Friman et al. 2001; McKeown et al. 1998; Muller et al. 2001). The most popular method used in fMRI data analysis assumes a linear transformation between neural activity and blood oxygenation level dependent (BOLD) contrast signals reflecting a hemodynamic response (HDR), plus a Gaussian noise residue. Recently, it is found that the residue may not be Gaussian, but instead a fractal signal (Bullmore et al. 2001). More surprisingly, it has been found that BOLD contrast signals without involving any assigned mental task are also fractal-like (Zarahn et al. 1997). Very interestingly, by applying fluctuation analysis and wavelet multi-resolution analysis to high temporal resolution fMRI data, it has been shown that the fractal feature of voxel time series can be utilized to separate active (HDR) from inactive (non-HDR) brain regions (Thurner et al. 2003; Shimizu et al. 2004). However, recently we have found that for real world pattern recognition applications, different fractal analyses methods have different level of effectiveness (Gao et al. 2006; Hu et al. 2006). Pertinent to fMRI data analysis, we have found that neither fluctuation analysis nor wavelet multi-resolution analysis can be used to effectively distinguish motion artifacts, especially task-related artifacts, from true HDRs, due to various sources of trends and/or non-stationarity contained in the data (Lee et al. 2008). This motivates us to use another type of fractal scaling analysis—detrended fluctuation analysis (DFA) (Peng et al. 1994; Hu et al. 2001) to identify brain activity from fMRI data. Specifically, we perform three tasks: (1) estimating noise level from experimental fMRI data; (2) assessing a signal model recently introduced by Birn et al.; and (3) evaluating the effectiveness of DFA for discriminating brain activations from artifacts. By computing the receiver operating characteristic (ROC) curves, we find that the ROC curve for experimental data is similar to the curve for simulated data with similar signal-to-noise ratio (SNR). This suggests that the proposed algorithm for estimating noise level is very effective and that Birn’s model fits our experimental data very well. The brain activation maps for experimental data derived by DFA are also very similar to maps derived by deconvolution using a widely used software, AFNI (Cox 1996).
Materials and methods
Experimental participants
All the subjects gave written informed consent in accordance with procedures established by the University of Florida Institutional Review Board. Two healthy older male volunteers (age = 71 and 76 years) and two healthy young male volunteers (age = 28 and 29 years) participated. All were strongly right-handed. Exclusion criteria included MRI contraindication; history of neurological disease, dementia or mild cognitive impairment; cardiovascular disease; uncontrolled hypertension; DSM IV Axis 1 diagnosis, learning disability, attention deficit disorder, or substance abuse; and poor visual acuity.
Experimental imaging parameters
Functional MRI data were acquired with a 3T Siemens Allegra head-only scanner using gradientecho echo planar imaging (TR = 1,700 ms, TE = 30 ms, 70° flip angle, matrix 64 × 64, 240 mm field of view, slice thickness of 5 mm with no gap between slices, and a total of 28 sagittal slices to cover the whole brain). Four runs were scanned, each run consisting of seven discarded initial images and 83 images obtained subsequently during the event-related behavioral protocol (332 images/session, 28 task events/session).
Task timing was controlled by the viewing of a video monitor. When the participant saw a green star flash three times during 1.7 s, they pressed a button three times using the index finger of the right hand as paced by the flashing star. Each such event was followed by a variable interval (i.e., 15.3, 17 or 18.7 s) with only a static red fixation star.
AFNI software (Cox 1996) reconstructed the DICOM files, which were spatially coregistered with 3-dimensional rigid-body transforms. The first seven images of each run were discarded to minimize magnetization instability, linear trends within runs were removed, and the runs were then concatenated into time series of 332 images. On a voxel-wise basis, the time series were deconvolved with respect to the time vector for the tasks, to obtain an estimated impulse-response function (IRF). How adequately the obtained IRF describes the voxel time series is determined by convolution of the task time vector with the IRF, then fitting this result by least-squares regression to the voxel time series, and estimating the proportion of variance explained by the fit (coefficient of determination, R2).
Selection of exemplar HDRs and motion artifacts from experimental data
Choosing a threshold of R2 ≥ 0.15 identified a small fraction of the 128 K acquisition voxels as being correlated in time with the task events. We chose this moderately low threshold so as to identify both HDRs and task-related artifacts, the latter of which might not as reliably accompany each task event. Most of the voxels so identified were inside the brain, although a minority of them were not. Acquisition voxels outside the body could not be task-correlated on the basis of HDRs. However, their magnetic signals could instead reflect task-correlated changes in susceptibility, namely artifacts. Similar to Birn et al. (1999), we therefore visually examined the estimated IRFs of voxels outside the brain to learn the temporal signatures of these artifacts, and then chose as exemplars of task-correlated artifacts voxels inside the brain with IRFs having the same or similar signatures. The remaining task-correlated voxels inside the brain were candidates to be exemplars of HDRs, while brain voxels not meeting the R2 threshold were taken to be noise. By this combination of R2 thresholding and visual inspection of IRFs, we identified 600 exemplars for HDR, 600 exemplars for motion artifact, and thousands of exemplars for noise voxels from the brain images of two healthy volunteers. We excluded voxels on large veins or at boundaries of the brain. Voxels were drawn from selected slices in regions of interest (ROI) related to the motor task, including premotor cortex, supplementary motor area, primary motor cortex, and superior lateral parietal cortex. These ROIs were more likely to be spatially contiguous than to be isolated. Slices not used for the selection of exemplars were reserved for evaluating the effectiveness of DFA in identifying brain activations.
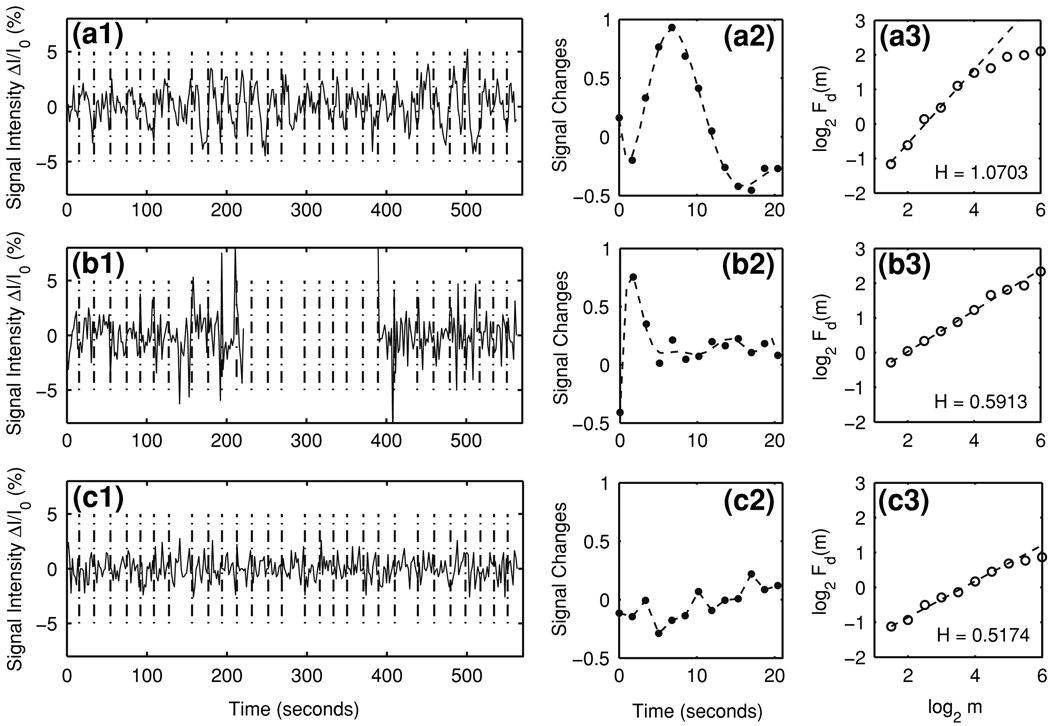
Figure 1 shows typical time series (Fig. 1a1, b1, c1) and hemodynamic response functions (the so-called impulse response functions, IRFs) (Fig. 1a2, b2, c2) for the three kinds of voxels: true HDRs (top), task-related motion artifacts (middle), and noise (bottom). IRFs were obtained by deconvolution with AFNI (Cox 1996). It is commonly assumed that the voxel time series is generated by the convolution of the task time vector with the IRF and adding a noisy baseline. The vertical dash-dot lines in Fig. 1a1, b1, c1 indicate the task event times of the experimental paradigm. We observed from Fig. 1a1, b1, c1 that the noise voxel time series has the smallest amplitude, while the motion artifact time series has a few very high peaks. By comparing the motion artifact time series with the task paradigm, we found that the peaks of motion artifacts occur randomly with equal probability at three different time instants: (1) the time coincident with the task event time, (2) the time with a delay of one TR (1.7 s) of the task event time, and (3) the time with a delay of two TRs of the task event time.
Fig. 1.
Representative time series, the corresponding hemodynamic responses and DFA curves of experimental data for the three types of voxels: (a1–a3) true HDRs, (b1–b3) task-related motion artifacts, and (c1–c3) noise. The dash-dot lines in (a1–c1) indicate the times of task events. The sampling time is 1.7 s. The smooth curves in (a2, b2) represent the estimated hemodynamic response functions fitted by 7-th order polynomials. The dashed lines in (a3, b3, c3) are straight lines fitted by linear least squares regression. The Hurst parameters H are obtained as the slopes of the straight lines
Estimation of noise level from experimental data
fMRI signals are always corrupted by noise. Presence of noise adds much difficulty in distinguishing true HDRs from motion artifacts—the higher the noise level, the harder the task of distinguishing between true HDRs and motion artifacts. To place a confidence score on a detection result, it is important to estimate the noise level.
We assume: (1) that true HDR or motion artifact time series are the superposition of noise with clean HDR signals or clean motion-induced signals, respectively, and (2) that these time series and the noise are independent. Thus the variance of an experimental HDR time series is equal to the summation of the variance of the clean HDR signal plus the variance of the noise . Likewise the variance of an experimental motion artifact time series is equal to the summation of the variance of the clean motion-induced signal plus the variance of the noise . If we knew , then we can easily estimate the noise level of experimental data by calculating
| (1) |
Hence, the problem is reduced to finding , which we estimated from variances of the exemplar HDRs, motion artifacts, and noise time series selected earlier. To evaluate the accuracy of our algorithm for estimating noise level, we performed numerical simulations using the Birn’s model (Birn et al. 2004) for fMRI signals.
Numerical simulation method
We simulated motion artifact and true HDR time series based on Birn’s model (Birn et al. 2004). The simulation procedure of that model can be divided into three steps: (1) Ideal motion-induced signal changes are simulated as large spikes in the signal intensity at times coincident with the performance of the task. The amplitude of these motion-induced signal spikes is a Gaussian random variable. (2) Ideal HDR signal changes are generated by convolving the task timing with a gamma variate function, with parameters according to Cohen (1997). (3) Gaussian white noise is added to each ideal motion-induced signal change as well as each ideal HDR signal change. The resulting data are the simulated motion artifact and simulated HDR time series.
In practice, the measured fMRI data may contain more sources of variability than what Birn’s model (Birn et al. 2004) describes. For example, motion artifacts might begin at slightly different times than the task events and might vary in amplitude and direction from event to event. HDRs might also vary from one task event to another. Furthermore, the noise residue of fMRI data may not be Gaussian (Bullmore et al. 2001). To better model our experimental data, we have made some changes to Birn’s model (Birn et al. 2004) by explicitly taking into account the issues mentioned above. Details of our simulation procedure follow:
- Ideal motion-induced signal changes were simulated as large spikes in the signal intensity at times coincident with the task event times (zero delay) or with one or two TR delay (TR = 1.7 s in our experiments), either increasing or decreasing the signal by variable amounts. Specifically, the motion-induced signal changes have the following form
where t is the event time, ts is the delay (0, 1 or 2 TR chosen with equal probability), and δ(t) is the impulse function. The parameter a1 can be both positive and negative. More precisely, its value was normally distributed with a mean of 3% and a standard deviation of 10% of the baseline intensity. We generated 332 samples per time series (565 s).(2) -
Ideal HDR signal changes were generated by convolving the task event times with a gamma variate function
where the parameter a2 scales amplitude of the simulated HDR to be 2% of the baseline with a standard deviation of 30% of this amplitude. In addition, we randomly changed the parameters a3 and a4 to be uniformly distributed with a means of 8.60 and 0.547, respectively (Cohen 1997), but with standard deviations of 10% of the corresponding mean. We also generate a total of 332 samples to match the length of the experimental data. Note that a similar model has been employed in the BOLD signal design for smart phantoms (Zhao et al. 2003).(3) The Gaussian distributions for the parameters a1 and a2 as well as the uniform distributions for the parameters a3 and a4 were chosen following Birn’s model (Birn et al. 2004). The mean values of a1 and a2 were estimated from our empirical motion artifact and HDR time series databases prepared earlier. The mean values of a3 and a4 were chosen according to Cohen (1997). The standard deviations for these four random variables were chosen somewhat arbitrarily. Note however, that our subsequent results do not depend sensitively on the specific values of those standard deviations.
Noise was randomly picked from the empirical noise database prepared earlier and added to ideal motion-induced signal changes and ideal HDR signal changes. Different scanners/subjects may have different noise level. It is important to consider distinction between true HDRs and motion artifacts under different SNRs. In fact, a recently developed product, SmartPhantom, can adjust SNR by varying the flip angle—a 90° corresponds to highest SNR; when the flip angle is decreased, SNR is also lowered (Zhao et al. 2003). We used the following procedure to simulate signals with different SNRs. Let a selected noise signal n(t) have standard deviation σnoise, an ideal HDR signal change have standard deviation , and an ideal motion-induced signal change have standard deviation . Then signal s(t) (for a true HDR or a motion artifact) with certain Si (i = HDR or motion) value was obtained by first re-scaling the noise signal by , and then adding n′ (t) to s(t).
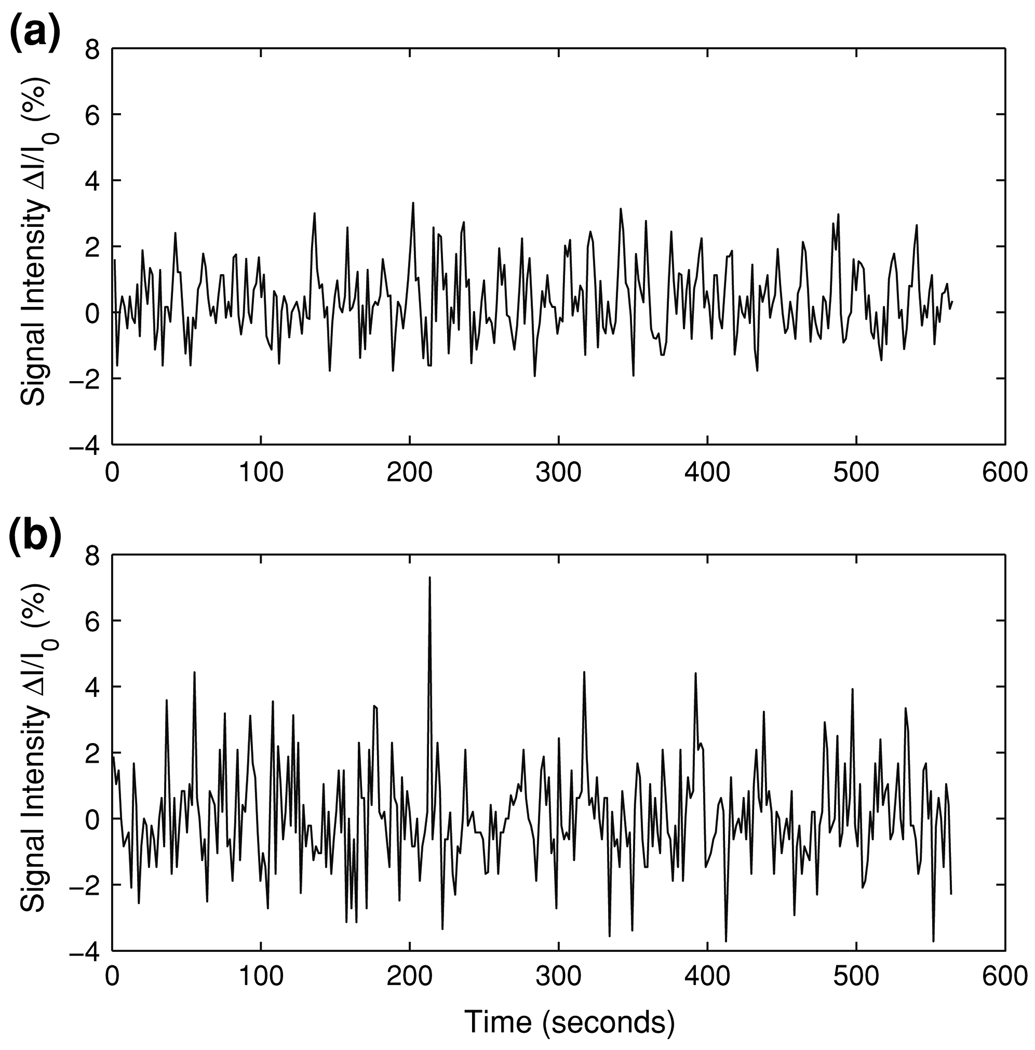
Figure 2 shows two typical examples of the simulated HDR and the simulated motion artifact time series corresponding to SHDR = Smotion = 0.75. These simulated signals approximate the empirical fMRI data seen in our motor tasks described earlier.
Fig. 2.
Examples of the (a) simulated HDR and (b) simulated task-related motion artifact time series corresponding to SHDR = Smotion = 0.75
Detrended fluctuation analysis
DFA (Peng et al. 1994; Hu et al. 2001) characterizes the second order statistic—the correlation, in a time series. It can automatically remove certain trends or non-stationarity contained in the data under study. When applying DFA, one works on a random-walk type process. Denote voxel time series by x(i), i = 1, 2,…, N. The random-walk type process y(n) can be obtained by first removing the mean value x̄ and then forming partial summation,
| (4) |
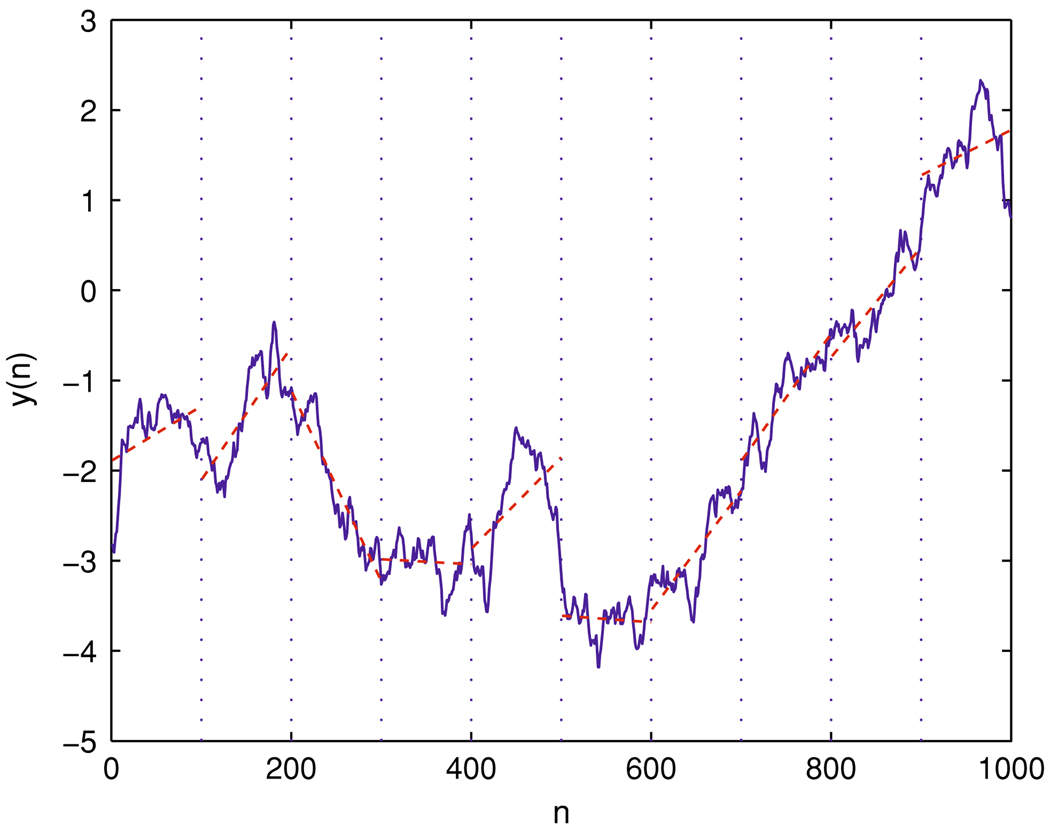
DFA works as follows. First, one divides the time series y(n) into ⌊N/m⌋ non-overlapping segments (where the notation ⌊x⌋ denotes the largest integer that is not greater than x), each containing m points; then one calculates the local trend in each segment to be the ordinate of a linear least squares fit for the data in that segment, and computes the “detrended data”, denoted by ym(i), as the difference between the original data y(i) and the local trend (a schematic figure illustrating the local detrending in the DFA method is shown in Fig. 3); finally, one examines if the following scaling behavior (i.e., fractal property) holds or not:
| (5) |
where the angle brackets denote ensemble average of all the segments. The parameter H is often called the Hurst parameter (Mandelbrot 1982). When the scaling law described by Eq. (5) holds, the process under investigation is said to be a fractal process. The autocorrelation γ(k) (where k is an integer) for the “increment” process, defined as x(i) = y(i + 1) − y(i), decays as a power-law (Gao et al. 2006),
| (6) |
where E is the expectation operator, x̄ is the mean value of the “increment” process. When H = 1/2, the process is called memory less or short range dependent. The most well-known example is the Brownian motion (Bm) process. In nature and in man-made systems, often a process is characterized by an H ≠ 1/2. Prototypical models for such processes are fractional Brownian motion (fBm) processes. When 0 ≤ H < 1/2, the process is said to have “anti-persistent” correlations (Mandelbrot 1982). For 1/2 < H ≤ 1, the process has “persistent” correlations, or long memory properties (Mandelbrot 1982). The latter is justified by noticing that
| (7) |
Fig. 3.
A schematic showing local detrending in the DFA method. y(n) is the integrated time series of voxel time series x(n), obtained by using Eq. (4). The vertical dotted lines indicate segments of length m = 100, and the dashed straight line represents the local “trend” estimated in each segment by a linear least-squares fit
In practice, quite often power-law relations are only valid for a finite region of k. Unfortunately, some researchers try to estimate the H parameter (or other scaling exponents such as the fractal dimension) by some optimization procedure without being concerned about the scaling region.
Results
Performance of DFA on simulated data
We apply DFA to simulated data of different SNRs. We vary Si, i = HDR and motion, between 0.1 and 2, since this range covers the typical noise levels of in vivo fMRI data. The smaller the Si value, the more noisy the simulated data.
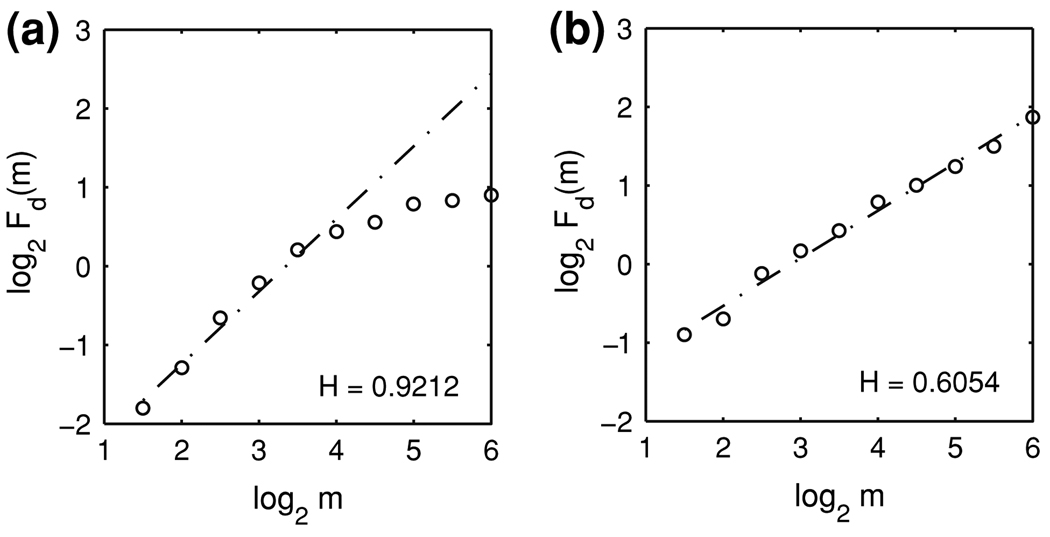
Figures 4a, b show the representative DFA curves for simulated HDR and motion artifact time series, respectively. From Fig. 4a, we observe that the HDR time series can be well described by Eq. (5) in the scale range of about m = 21.5 to m = 24, which corresponds to the time scale range of about 5–27 s, given the sampling time of 1.7 s. Thus in this time scale range the simulated HDR time series can be classified as fractal. The scaling behavior for the simulated motion artifact time series is very good, as shown in Fig. 4b. By comparing Fig. 4a, b, we notice that the H value of the simulated HDR is much larger than that of the simulated motion artifact.
Fig. 4.
Typical DFA curves for (a) simulated HDR and (b) simulated task-related motion artifact time series. The dash-dot lines are straight lines fitted by a linear least-squares regression. The Hurst parameters H are obtained as the slopes of the straight lines
Next, we quantitatively examine how effective DFA is for distinguishing motion artifacts from HDRs under different SNR scenarios. For each Si value, we simulate 5,000 motion artifact and 5,000 HDR time series. We set up the hypothesis tests for the two types of voxel time series as follows:
H0: motion artifacts.
H1: hemodynamic responses (HDRs).
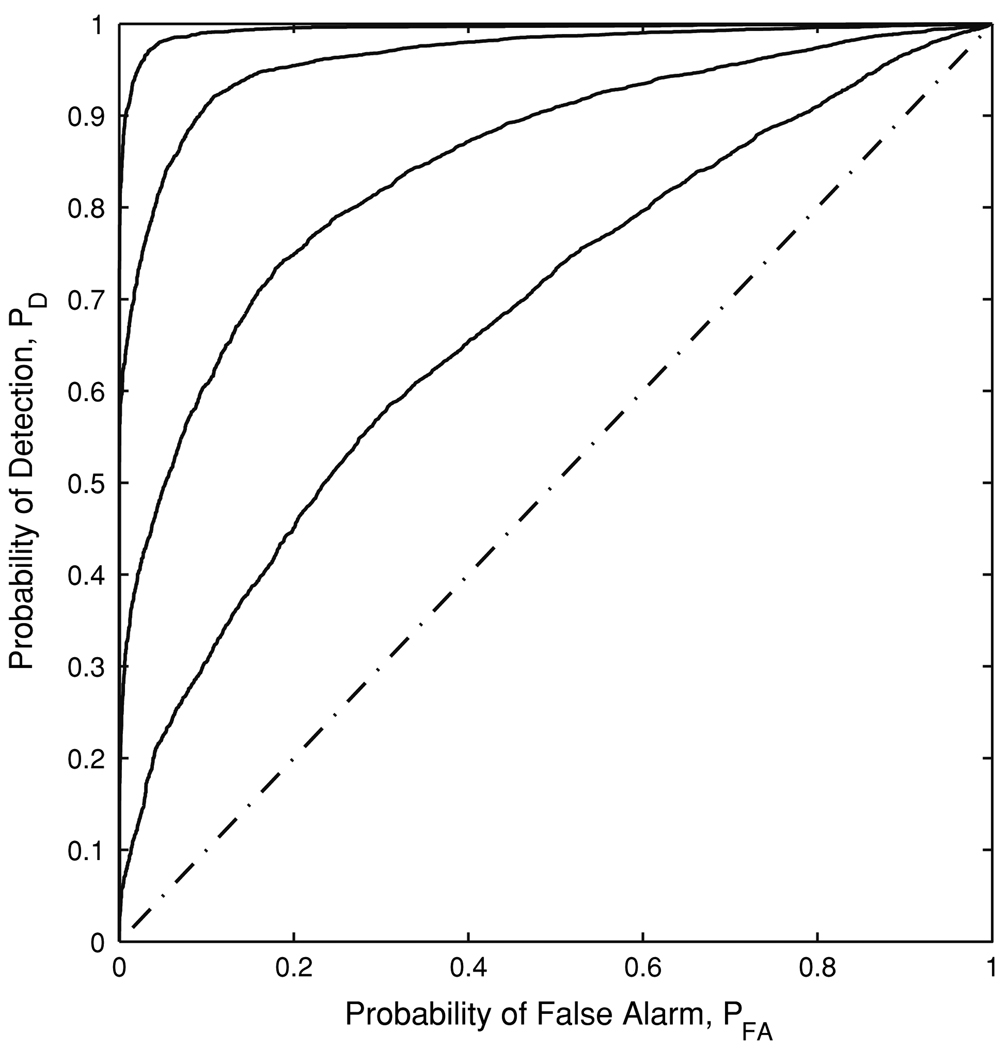
For this detection problem, the probability of deciding H1 when H0 is true can be thought of as a false alarm, denoted by PFA. Similarly, the probability of deciding H1 when H1 is true is the probability of detection, PD. We then carry out the ROC analysis to quantitatively examine the performance of the proposed method with respect to PD and PFA. The ROC analysis is a commonly used method for summarizing the relation between sensitivity and specificity of a measure. In recent years, it has been used to evaluate the accuracy and reliability of fMRI data analysis (Desco et al. 2001; Skudlarski et al. 1999). Figure 5 shows the ROC curves of the H parameter for the simulated HDRs and simulated motion artifacts corresponding to different Si values. We observe that as Si value becomes larger, PD becomes higher. The simulation results indicate that DFA can effectively distinguish motion artifacts from HDRs, especially when Si ≥ 0.75.
Fig. 5.
The ROC curves of the H parameter for simulated HDRs and simulated motion artifacts corresponding to different Si(i = HDR and motion) values. Four curves, from bottom to top, correspond to SHDR = Smotion = 0.3, 0.5, 0.75 and 1
Performance of DFA on experimental data
We now apply DFA to experimental fMRI data. Figure 1a3, b3, c3 show the representative DFA curves for the three types of voxels: true HDRs (top), task-related motion artifacts (middle) and noise (bottom). Similar to the simulated data, we observe that true HDR time series can be well characterized by Eq. (5) in the time scale range of about 5–27 s. The scaling behavior of the motion artifacts and the noise voxels is quite good. We also notice that the true HDRs have much larger H values than either the motion artifacts or the noise voxels.
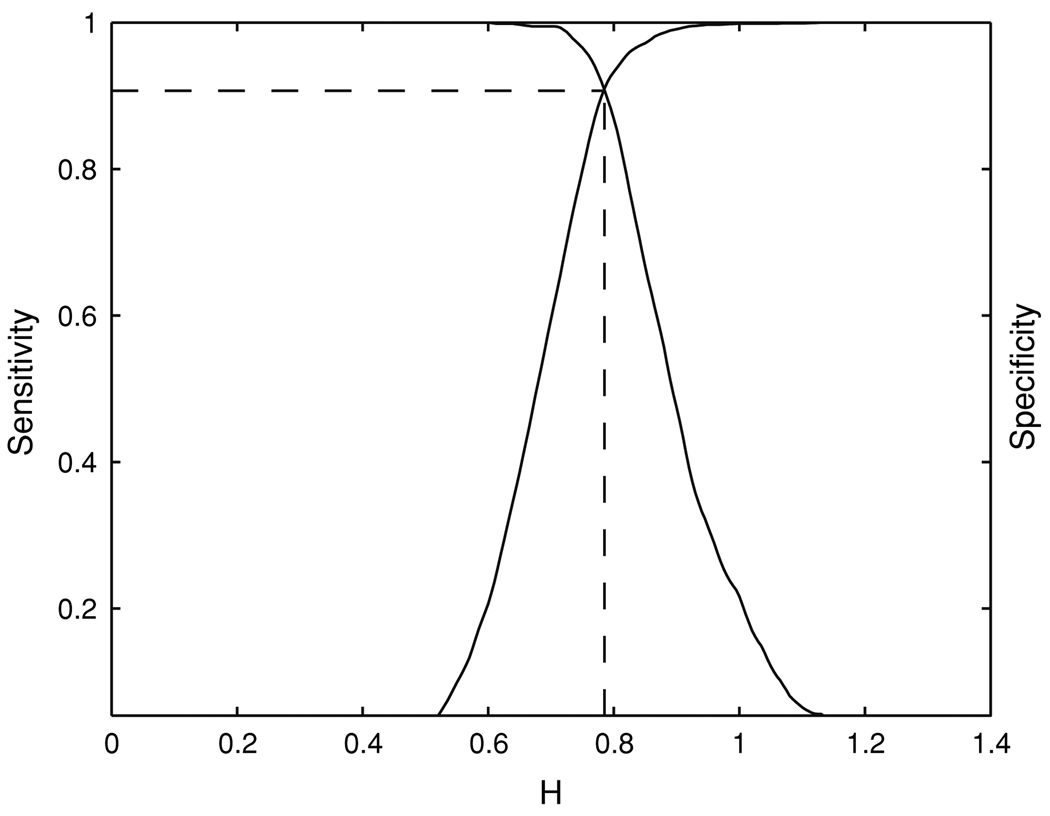
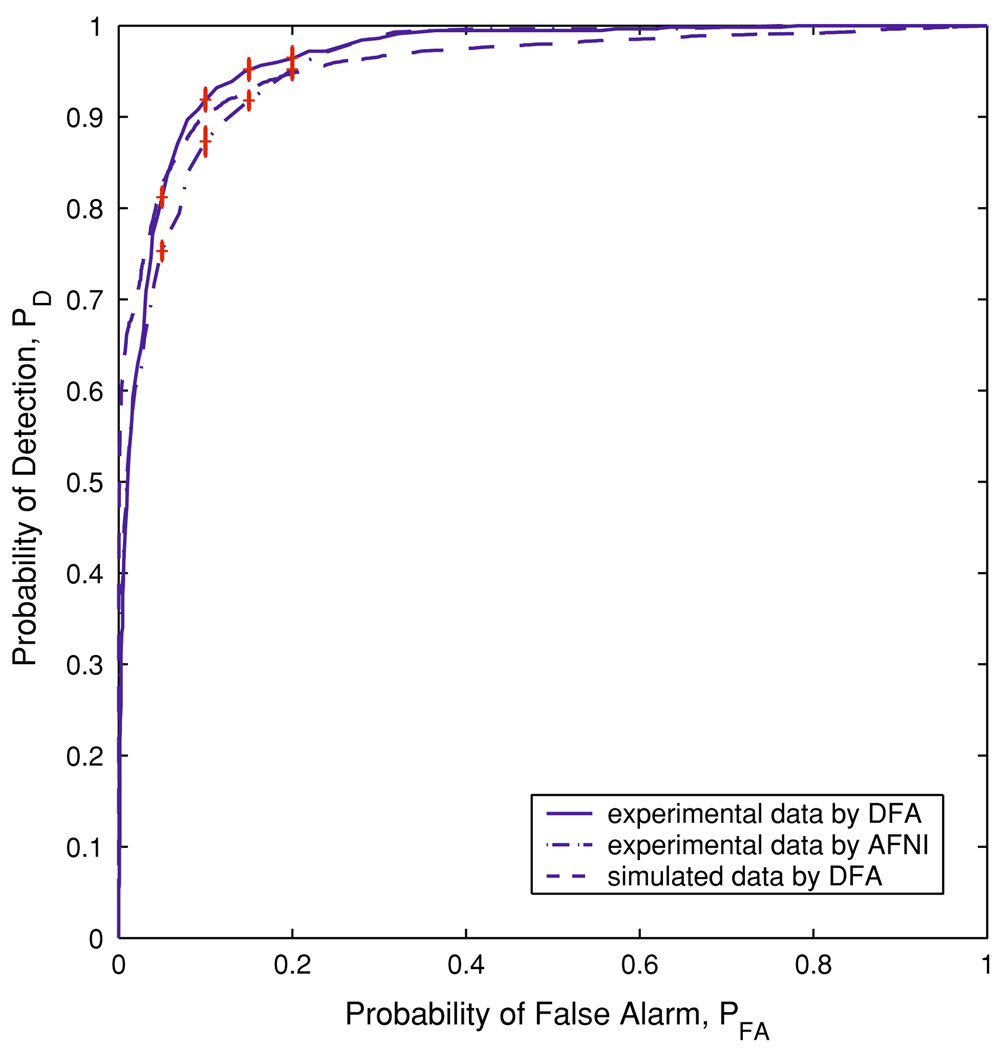
Next, we apply the proposed DFA method to the true HDR and task-related motion artifact time series databases prepared earlier, and quantitatively examine the effectiveness of DFA in distinguishing between these two types of voxel time series. Figure 6 shows the sensitivity and specificity curves of H for separating the true HDRs and task-related motion artifacts. A usual choice of H is the one that makes the sensitivity and specificity of H equal, and we obtain such a value of H to be about 0.78. With this optimal threshold for H, we obtain the probability of detection PD = 0.91 and the probability of false alarm PFA = 0.09. The ROC curve for these experimental data is shown in Fig. 7, denoted by the solid line. For comparison, we also apply the AFNI deconvolution to the same true HDR and task-related motion artifact time series databases, and examine how effective the AFNI deconvolution is in separating these two types of voxel time series. The corresponding ROC curve is shown in Fig. 7 as the dash-dot line. It is noted that for 0.016 ≤ PFA ≤ 0.24, the ROC curve for DFA is on top of that for the AFNI deconvolution; for other PFA values, the two methods are comparable. Therefore, DFA is more accurate than the AFNI deconvolution in distinguishing true HDRs from task-related motion artifacts.
Fig. 6.
The sensitivity and specificity curves of H for separating the true HDRs and the task-related motion artifacts in the empirical HDR and motion artifact time series databases
Fig. 7.
The solid, dash-dot, and dashed lines denote the ROC curves for experimental data using DFA, experimental data using AFNI deconvolution, and simulated data of similar SNR (SHDR = 0.73 and Smotion = 0.62) using DFA, respectively. The vertical bars on the ROC curves indicate the estimated standard errors of the means
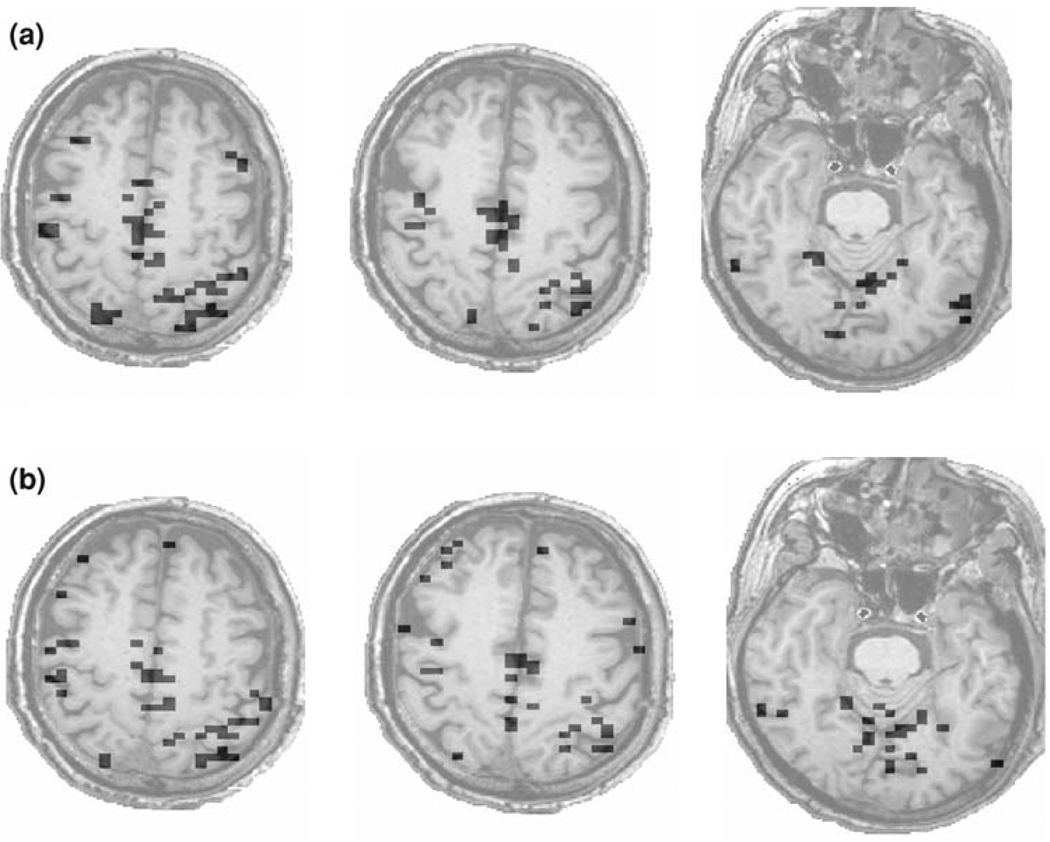
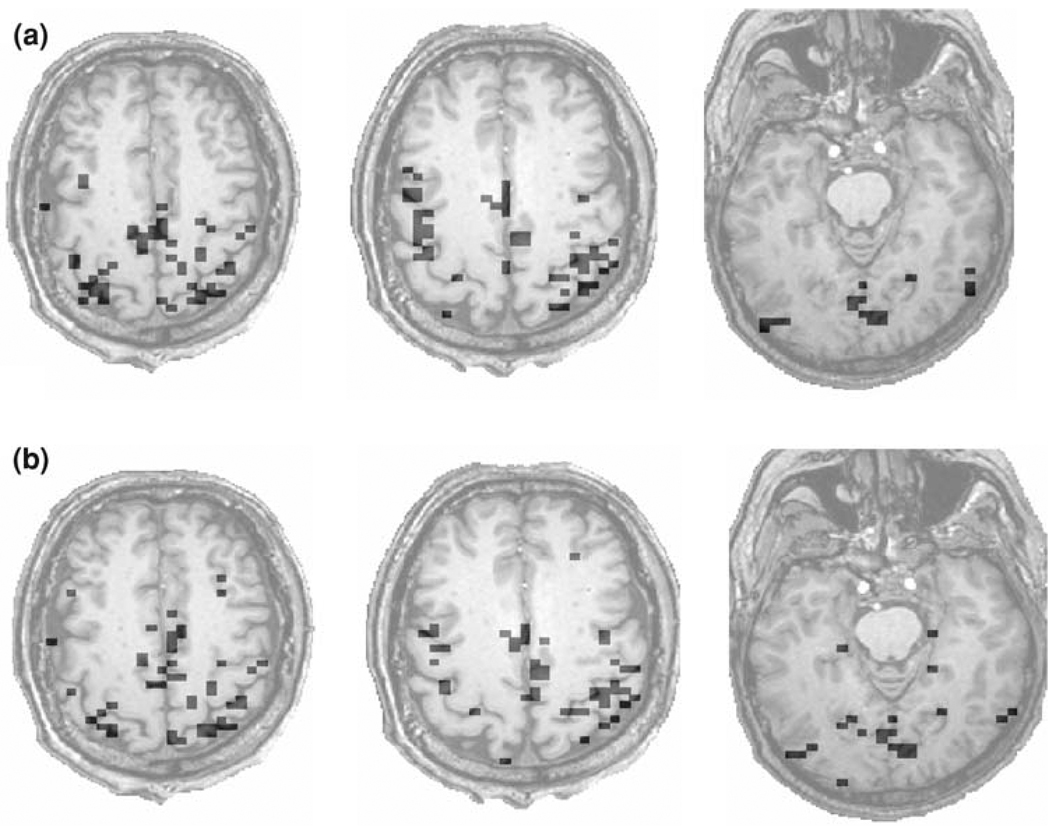
We also apply DFA to the voxel time series of the whole brain. Figure 8a shows three representative slices of the brain activation maps for one subject. Those maps were obtained with a threshold value of H* = 0.80, corresponding to PD = 0.81 and PFA = 0.05. Note that these particular slices were not included in the databases used in the computations of the sensitivity and specificity curves and the ROC curve. While one might question whether PFA = 0.05 represents the actual probability of false alarm presented in Fig. 8a, it is found that the brain activation maps do not change much when the threshold for H is changed slightly around H* = 0.80. Presumably, this is due to the fact that the number of activated voxels in a slice is small. For experimental paradigms like ours, which involved right-hand finger-tapping task (Yousry et al. 1997) as well as stimulation of the primary visual cortex (V1) by a flashing star, activations in the hand bump area and V1 are entirely as expected in Fig. 8a.
Fig. 8.
Brain activation maps derived by (a) the proposed DFA method and (b) ANFI deconvolution. The threshold chosen for the two methods is H = 0.80 and R2 = 0.16, respectively
For comparison, the brain activation maps for the same three slices derived by AFNI deconvolution, with a threshold value of R2 = 0.16, are shown in Fig. 8b. Comparing Fig. 8a, b, we observe that except in some small regions, the brain activation maps derived by the DFA method and AFNI deconvolution are largely similar. Note that DFA is more likely to identify clusters of voxels than AFNI deconvolution.
Figure 9a, b show three slices of the brain activation maps for another subject derived by DFA and AFNI deconvolution having threshold values of H* = 0.86 and R2 = 0.19, respectively. To choose those threshold values, we have followed the common practice of visually inspecting the brain activation patterns. Although this approach is a bit subjective, it is much less time-consuming than first computing PFA based on pre-prepared databases for HDRs and motion artifacts. From Fig. 9a, b, we observe that the brain activation maps derived by DFA and AFNI deconvolution are again very similar except for some small regions.
Fig. 9.
Brain activation maps for another subject derived by (a) the DFA method and (b) ANFI deconvolution. The threshold chosen for the two methods is H = 0.86 and R2 = 0.19, respectively
Estimation of noise from experimental data
We have prepared three databases (HDRs, motion artifacts, and noise databases) by selecting thousands of voxels from the brain images of two healthy volunteers. Within each database, we calculate the average variance among all the time series. The estimated variance for true HDRs, motion artifacts, and noise is about 1.52, 1.37, and 0.99, respectively. By Eq. (1), we obtain SHDR = 0.73 and Smotion = 0.62.
To evaluate the accuracy of the estimations of the noise level, we performed the following numerical simulations. We simulated 5,000 HDR time series using Eq. (3) with SHDR = 0.73 and 5,000 motion artifact time series using Eq. (2) with Smotion = 0.62. We then applied DFA to the random-walk type processes of all these simulated voxel time series, computed the ROC curve of H, and compared it with the ROC curve of H for experimental fMRI data. The two curves were shown in Fig. 7 as dashed line and solid line, respectively. They are very close. Note that if we increase SHDR and Smotion by decreasing the noise level, the dashed line will move up. Conversely, if we decrease SHDR and Smotion by increasing the noise level, the dashed line will move down. This suggests that the proposed algorithm for estimating noise level is very effective. In fact, Fig. 7 also suggests that Birn’s model (Birn et al. 2004) is a good model for fMRI signals.
Conclusion and discussions
In this paper, we have proposed an effective method for estimating noise level in experimental fMRI data. We have also introduced a detrending-based fractal method, DFA, to identify brain activity from fMRI data. We have applied the method to simulated data based on a signal model recently introduced by Birn et al. and computed the ROC curves for simulated data of different SNRs. We have also applied the proposed method to experimental fMRI data. It is found that the ROC curve for experimental data is very similar to the ROC curve for simulated data with similar SNR. This suggests that the proposed algorithm for estimating noise level is very effective and that Birn’s model fits our experimental data very well. Brain activation maps for experimental data derived by DFA are very similar to maps derived by AFNI deconvolution. Considering that deconvolution explicitly uses the information about the experimental paradigm to extract the activation patterns whereas DFA does not, it remains to be seen whether one can effectively integrate the two methods to improve accuracy for detecting brain areas related to functional activity.
We would like to make three comments. (1) We have examined how effective fluctuation analysis or wavelet multi-resolution analysis is for distinguishing task-related motion artifacts from true HDRs, and found that both methods are not very effective for this purpose (Lee et al. in preparation). (2) The fractal scaling behavior identified by DFA from true HDR time series in this experimental data set is only valid within the time scale range of about 5–27 s. The time scale of 27 s is only a bit longer than the average inter-event interval, which is about 18 s. This suggests that the fractal scaling is essentially limited by the experimental paradigm. Perhaps each event tries to re-set the physiological system and the system responds with some delay, due to a carryover or memory effect. If this speculation is correct, then DFA has effectively captured some information about the experimental paradigm. This may be one of the reasons that DFA is especially effective in distinguishing true HDRs from task-related motion artifacts. (3) We have mentioned that a similar signal model has been employed in BOLD signal modeling for smart phantoms (Zhao et al. 2003). Therefore, the proposed method may be effectively used to examine the performance of phantoms and the stability of scanners.
Acknowledgments
This work was supported by Brain Rehabilitation Research Center VA Center of Excellence grant VARR&D F2182C, Research Career Scientist Award VARR&D B3470S to BC, NIH grant P50-DC03888 (BC, core PI), and the Evelyn F. McKnight Brain Research Grant Program at the University of Florida (JBG, KDW).
Contributor Information
Jing Hu, Email: jinghu@ufl.edu, Department of Electrical and Computer Engineering, University of Florida, Gainesville, FL 32611, USA; 3380 Central Expressway, Santa Clara, CA 95051, USA.
Jae-Min Lee, Department of Electrical and Computer Engineering, University of Florida, Gainesville, FL 32611, USA.
Jianbo Gao, Department of Electrical and Computer Engineering, University of Florida, Gainesville, FL 32611, USA.
Keith D. White, Department of Psychology, University of Florida, Gainesville, FL 32611, USA Department of Clinical and Health Psychology, University of Florida, Gainesville, FL 32611, USA; Brain Rehabilitation Research Center, Malcom Randall Veterans’ Affairs Medical Center, Gainesville, FL 32608, USA.
Bruce Crosson, Department of Clinical and Health Psychology, University of Florida, Gainesville, FL 32611, USA; Brain Rehabilitation Research Center, Malcom Randall Veterans’ Affairs Medical Center, Gainesville, FL 32608, USA.
References
- Birn RM, Bandettini PA, Cox RW, Shaker R. Event-related fMRI of tasks involving brief motion. Hum Brain Mapp. 1999;7:106–114. doi: 10.1002/(SICI)1097-0193(1999)7:2<106::AID-HBM4>3.0.CO;2-O. [DOI] [PMC free article] [PubMed] [Google Scholar]
- Birn RM, Cox RW, Bandettini PA. Experimental designs and processing strategies for fMRI studies involving overt verbal responses. NeuroImage. 2004;23:1046–1058. doi: 10.1016/j.neuroimage.2004.07.039. [DOI] [PubMed] [Google Scholar]
- Bullmore E, Long C, Suckling J, Fadili J, Calvert G, Zelaya F, Carpenter TA, Brammer M. Colored noise and computational inference in neurophysiological (fMRI) time series analysis: Resampling methods in time and wavelet domain. Hum Brain Mapp. 2001;12:61–78. doi: 10.1002/1097-0193(200102)12:2<61::AID-HBM1004>3.0.CO;2-W. [DOI] [PMC free article] [PubMed] [Google Scholar]
- Cohen MS. Parametric analysis of fMRI data using linear systems methods. NeuroImage. 1997;6:93–103. doi: 10.1006/nimg.1997.0278. [DOI] [PubMed] [Google Scholar]
- Cox RW. AFNI: Software for analysis and visualization of functional magnetic resonance neuroimages. Comput Biomed Res. 1996;29:162–173. doi: 10.1006/cbmr.1996.0014. [DOI] [PubMed] [Google Scholar]
- Desco M, Hernandez JA, Santos A, Brammer M. Multiresolution analysis in fMRI: sensitivity and specificity in the detection of brain activation. Hum Brain Mapp. 2001;14:16–27. doi: 10.1002/hbm.1038. [DOI] [PMC free article] [PubMed] [Google Scholar]
- Friman O, Cedefamn J, Lundberg P, Borga H, Knutsson H. Detection of neural activity in functional MRI using canonical correlation analysis. Magn Reson Med. 2001;45:323–330. doi: 10.1002/1522-2594(200102)45:2<323::aid-mrm1041>3.0.co;2-#. [DOI] [PubMed] [Google Scholar]
- Gao JB, Hu J, Tung WW, Cao YH, Sarshar N, Roychowdhury VP. Assessment of long range correlation in time series: How to avoid pitfalls. Phys Rev E. 2006;73:016117. doi: 10.1103/PhysRevE.73.016117. [DOI] [PubMed] [Google Scholar]
- Glover GH. Deconvolution of impulse response in event-related BOLD fMRI. NeuroImage. 1999;9:416–429. doi: 10.1006/nimg.1998.0419. [DOI] [PubMed] [Google Scholar]
- Hu K, Ivanov PC, Chen Z, Carpena P, Stanley HE. Effect of trends on detrended fluctuation analysis. Phys Rev E. 2001;64:011114. doi: 10.1103/PhysRevE.64.011114. [DOI] [PubMed] [Google Scholar]
- Hu J, Gao JB, Posner FL, Zheng Y, Tung WW. Target detection within sea clutter: a comparative study by fractal scaling analyses. Fractal. 2006;14:187–204. [Google Scholar]
- Lee JM, Hu J, Gao JB, Crosson B, Peck KK, Wierenga CE, McGregor K, Zhao Q, White KD. Discriminating brain activity from task-related artifacts in functional MRI: fractal scaling analysis, simulation and application. NeuroImage. 2008 doi: 10.1016/j.neuroimage.2007.11.016. (in press). http://dx.doi.org/10.1016/j.neuroimage.2007.11.016. [DOI] [PMC free article] [PubMed] [Google Scholar]
- Mandelbrot BB. The fractal geometry of nature. San Francisco: Freeman; 1982. [Google Scholar]
- Masayuki K, Sung YW, Ogawa S. A dynamic system model-based technique for functional MRI data analysis. NeuroImage. 2004;22:179–187. doi: 10.1016/j.neuroimage.2003.12.037. [DOI] [PubMed] [Google Scholar]
- McKeown MJ, Makeig S, Brown GG, Jung TP, Kindermann SS, Bell AJ, Sejnowski TJ. Analysis of fMRI data by blind separation into independent spatial components. Hum Brain Mapp. 1998;6:160–188. doi: 10.1002/(SICI)1097-0193(1998)6:3<160::AID-HBM5>3.0.CO;2-1. [DOI] [PMC free article] [PubMed] [Google Scholar]
- Muller K, Lohmann G, Bosch V, vonCramon DY. On multivariate spectral analysis of fMRI time series. NeuroImage. 2001;14:347–356. doi: 10.1006/nimg.2001.0804. [DOI] [PubMed] [Google Scholar]
- Peng CK, Buldyrev SV, Havlin S, Simons M, Stanley HE, Goldberger AL. Mosaic organization of DNA nucleotides. Phys Rev E. 1994;49:1685–1689. doi: 10.1103/physreve.49.1685. [DOI] [PubMed] [Google Scholar]
- Shimizu Y, Barth M, Windischberger C, Moser E, Thurner S. Wavelet-based multifractal analysis of fMRI time series. NeuroImage. 2004;22:1195–1202. doi: 10.1016/j.neuroimage.2004.03.007. [DOI] [PubMed] [Google Scholar]
- Skudlarski P, Constable RT, Gore JC. ROC analysis of statistical methods used in functional MRI: individual subjects. Neuroimage. 1999;9:311–329. doi: 10.1006/nimg.1999.0402. [DOI] [PubMed] [Google Scholar]
- Sun FT, Miller LM, D’Esposito M. Measuring interregional functional connectivity using coherence and partial coherence analyses of fMRI data. NeuroImage. 2004;21:647–658. doi: 10.1016/j.neuroimage.2003.09.056. [DOI] [PubMed] [Google Scholar]
- Thurner S, Windischberger C, Moser E, Walla P, Barth M. Scaling laws and persistence in human brain activity. Physica A. 2003;326:511–521. [Google Scholar]
- Worsley KJ, Friston KJ. Analysis of fMRI time-series revisited again. NeuroImage. 1995;2:173–181. doi: 10.1006/nimg.1995.1023. [DOI] [PubMed] [Google Scholar]
- Yousry TA, Schmid UD, Alkadhi H, Schmidt D, Peraud A, Buettner A, Winkler P. Localization of the motor hand area to a knob on the precentral gyrus—a new landmark. Brain. 1997;120:141–157. doi: 10.1093/brain/120.1.141. [DOI] [PubMed] [Google Scholar]
- Zarahn E, Aguirre GK, D’Esposito M. Empirical analyses of BOLD fMRI statistics. Part 1. Spatially unsmoothed data collected under null-hypothesis conditions. NeuroImage. 1997;5:179–197. doi: 10.1006/nimg.1997.0263. [DOI] [PubMed] [Google Scholar]
- Zhao Q, Duensing G, Fitzsimmons J. Development of smart phantom for charactering fMRI informatics tools. Proc Intl Soc Mag Reson Med. 2003;11:1834. [Google Scholar]


