

Abstract
Autoimmune T cell responses directed against insulin-producing β cells are central to the pathogenesis of type 1 diabetes (T1D). Detection of such responses is therefore critical to provide novel biomarkers for T1D ‘immune staging’ and to understand the mechanisms underlying the disease. While different T cell assays are being developed for these purposes, it is important to optimize and standardize methods for processing human blood samples for these assays. To this end, we review data relevant to critical parameters in peripheral blood mononuclear cell (PBMC) isolation, (cryo)preservation, distribution and usage for detecting antigen-specific T cell responses. Based on these data, we propose recommendations on processing blood samples for T cell assays and identify gaps in knowledge that need to be addressed. These recommendations may be relevant not only for the analysis of T cell responses in autoimmune disease, but also in cancer and infectious disease, particularly in the context of clinical trials.
Keywords: ELISPOT, freezing, shipping, T cell, tetramer
Introduction
Autoreactive T cells that target insulin-producing β cells are the central players in the pathogenesis of type 1 diabetes (T1D). Detecting islet antigen-reactive T cells is like finding the proverbial needle in the haystack. Autoreactive T cells are present at very low frequency in peripheral blood, are often of low functional avidity and are surrounded by a multitude of potentially cross-reactive irrelevant cells. Their detection therefore challenges the boundaries of sensitivity of many techniques. Several innovations have been and will continue to be introduced to overcome this challenge. Among the plethora of factors influencing the detection of T cell responses, only some are associated intrinsically with the disease process (i.e. true biological variation), while many others are critically dependent upon experimental procedures (i.e. assay variability). It is for this reason that the T-Cell Workshop Committee of the Immunology of Diabetes Society (IDS) continues to devote substantial effort to developing and validating T cell assays. Less emphasis, however, has been put upon defining optimal procedures common to virtually all T cell assays, i.e. the isolation and preservation of peripheral blood mononuclear cells (PBMCs). Are there methods that we can recommend for these operations, based upon published evidence? What are the knowledge gaps that need to be filled?
We set out to define optimal, standardized conditions for the initial steps leading up to T cell assays, from blood-drawing to PBMC isolation, freezing/thawing, shipping, preservation and preparation for T cell analyses (Fig. 1). We limited our literature search to antigen-driven T cell responses, as mitogens [e.g. phytohaemagglutinin (PHA), anti-CD3/CD28 antibodies, lipopolysaccharide (LPS)] used in many studies target non-specifically a large proportion of T cells, resulting in non-physiological responses of high magnitude that do not mimic antigen processing and presentation to low-frequency T cells. Given the paucity of literature on these technical aspects in the autoimmunity field, we harvested information from the neighbouring fields of tumour and viral immunology. In so doing, we reasoned that what does not work adequately for analysing viral or tumour antigen-specific T cell responses is unlikely to work in the more challenging arena of autoimmunity. When possible, we then summarize recommendations for each of these procedures, or point out those parameters that need to be explored further before recommendations can be formulated. Moreover, the strength of recommendation when analysing islet antigen-specific T cell responses has been scored depending on whether data were generated in the diabetes autoimmunity field or in other domains, on whether the report was confirmed independently and on whether data addressing the point directly is available or not. Recommendations were therefore ranked by levels of evidence (A–E; Table 1), as follows:
Fig. 1.
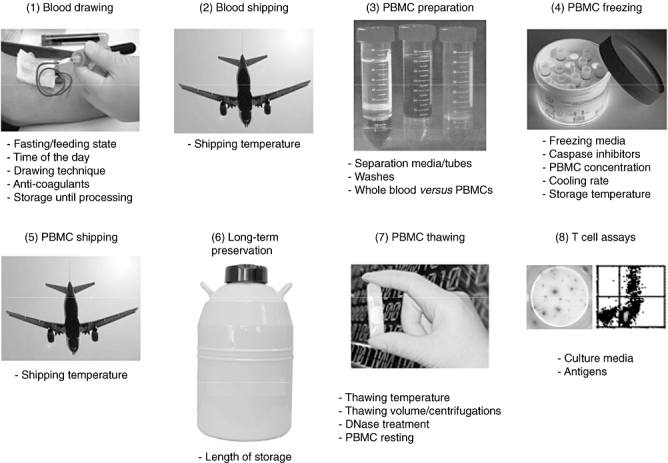
Critical steps in processing blood samples for T cell assays.
Table 1.
Levels of evidence used to formulate the present recommendations.
| T cell responses to: |
Published reports |
||||
|---|---|---|---|---|---|
| Level of evidence | Islet antigen | Other antigen | ≥ 2 | 1 | 0 |
| A | X | X | |||
| B | X | X | |||
| C | X | X | |||
| D | X | X | |||
| E | Any | X† | |||
Expert opinion, for which no supporting publications directly obtained with antigen-specific T cell assays are available. Available publications only suggest that the parameter under consideration may be relevant for T cell assays.
procedure validated in β cell antigen-specific T cell assays, confirmed independently (more than two peer-reviewed publications from different groups);
procedure validated in β cell antigen-specific T cell assays, awaiting independent confirmation (only one peer-reviewed publication);
procedure validated in antigen-specific T cell assays outside the diabetes field, confirmed independently (more than two peer-reviewed publications from different groups);
procedure validated in antigen-specific T cell assays outside the diabetes field, awaiting independent confirmation (only one peer-reviewed publication); and
expert opinion, for which no supporting publications directly obtained with antigen-specific T cell assays are available. There are published reports suggesting that the parameter under scrutiny may be relevant for T cell assays, but no direct proof is available. Therefore, it may be advisable to keep this parameter under consideration, but no recommendation can be formulated.
This position statement is not meant to offer the ultimate solution to all blood processing issues, but will hopefully be a starting point for further advancements in this field.
Blood-drawing
It is well known that multiple physiological factors such as nutritional status, hormone levels and circadian rhythms influence immune reactivity. In addition, some technical aspects of blood collection affect the viability, yield and functionality of immune cells contained in whole blood.
Fasting/feeding state
The immunosuppressive effects of nutritional deprivation may be exerted by different mechanisms. Notably, fasting is accompanied by a prompt decrease in serum leptin levels, an adipokine with immune modifying properties. Indeed, leptin administration to fasting mice reverses the immune-suppressive effects of acute (48 h) starvation, as assessed by delayed-type hypersensitivity responses [1]. Moreover, leptin boosts human T helper type 1 (Th1) and suppresses Th2 cytokine responses in the presence – but not in the absence – of antigen stimulation, thus behaving like a genuine co-stimulatory factor. The leptin effect is more pronounced on naive CD4+ T cell proliferation, and on memory CD4+ T cell interferon (IFN)-γ secretion (increased) and interleukin (IL)-4 production (decreased) [1]. Conversely, leptin potently inhibits proliferation of naturally occurring CD4+ regulatory T cells (Tregs) [2]. Hinting further at the potential confounding effects of leptin levels in autoimmune studies, leptin is required for and accelerates development of experimental autoimmune encephalomyelitis [3–5] and autoimmune diabetes in non-obese diabetic (NOD) mice [6–8]. In longer starvation protocols lasting 7 days, fasting was also accompanied by decreased plasma insulin-like growth factor (IGF)-I levels, decreased total T cell and CD4+ T cell counts, and reduced IL-2 production upon PHA stimulation [9]. However, as all these experimental protocols employed fasting periods of at least 36 h, it is not clear whether more customary 8–12-h fasting intervals would have appreciable effects.
Fewer studies have analysed the reverse situation, i.e. the effects of feeding on immune parameters. In one of these studies, healthy volunteers were either fasted or fed a standardized diet, and blood collected every 15 min for several hours. Meal intake was paralleled by a rise in plasma cortisol, which was accompanied by a decrease in lymphocyte count and IFN-γ responses to mitogen stimulation in vitro[10]. In healthy humans, raising blood glucose acutely while blocking endogenous insulin secretion by octreotide led to an increase in plasma IL-6, tumour necrosis factor (TNF)-α and IL-18 concentrations within 2 h, which returned to normal at 3 h. Interestingly, cytokine levels were higher both before and after glucose challenge in subjects with impaired glucose tolerance (IGT). This rise was dependent upon oxidative mechanisms, as concomitant infusion of glutathione as a reducing agent abolished the effect [11]. In further support of these data, agents that increase insulin secretion and decrease postprandial glycaemia, such as mitiglinide, blunt the increase both in oxidative stress and inflammatory markers [12]. Similar results were obtained upon a glucose challenge in vivo or in vitro, which up-regulated inflammatory genes [intercellular adhesion molecule (ICAM)-1, TNF-α, IL-6], especially in subjects with the metabolic syndrome [13].
In line with these data, observations in T1D patients document associations between blood glucose levels, C-peptide concentrations and HbA1c with antigen-reactive enzyme-linked immunospot assay (ELISPOT) T cell responses [14], as well as with systemic cytokine (IL-1RA, adiponectin, IL-6) and chemokine (CCL3, CCL4, CCL5) concentrations [15,16]. Taken together, these reports document that meal intake, glycaemic levels, metabolic derangements and the responses triggered by them (e.g. oxidative stress) lead to an increase in basal (non- antigen-stimulated) levels of inflammatory cytokines.
Another critical parameter introducing variation might be the fluctuation in serum insulin concentrations between the fasting and the fed state. This could be particularly relevant when investigating insulin-specific T cell responses. Moreover, other effects of insulin on T lymphocytes and other immune cells cannot be excluded [17–20].
In summary, nutritional state and circulating hormones and cytokines may influence T cell responses. However, available reports document only changes in spontaneous T cell responses, without data investigating how this may affect antigen-specific T cell responses. Based upon these data, blood-drawing for T cell analyses may be performed under the same conditions for all the blood samples analysed, preferably in the fasting state, to minimize variations introduced by different dietary patterns (level of evidence: E). As pointed out by the E level of evidence, there are not enough data supporting a clear recommendation at this stage. Logistic issues further weigh against a firm proposition until additional evidence becomes available.
Time of day for blood-drawing
Apart from the fasting/feeding state, many immune functions exhibit circadian rhythmicity [21], and thus the time of day at which blood is taken may also be an important variable. In response to tetanus toxoid, the ratio of IFN-γ/IL-10 secretion in whole blood attained its zenith during early morning (3 a.m.) and reached its nadir in the late morning and afternoon (10 a.m.–8 p.m.) [22]. The zenith corresponded with the peak of plasma melatonin, while the nadir was related with the peak of plasma cortisol. These hormones have reversed circadian rhythms and opposed immune effects, with cortisol inhibiting and melatonin enhancing proinflammatory immune responses (e.g. IFN-γ and IL-1 production). Further suggesting a cause–effect link between these hormone–cytokine associations, the IFN-γ/IL-10 ratio was reduced significantly by late evening administration of cortisone (due mainly to reduced IFN-γ levels) [22]. The circadian rhythmicity of immune function suggests that blood drawing for T cell studies may be performed at the same time of day for more accurate comparison (level of evidence: E). Further studies are needed to clarify whether this would apply to PBMCs purified from whole blood, as washing steps would greatly reduce cortisol and melatonin concentrations during T cell stimulation.
Blood-drawing technique
A comparison between blood drawn with heparinized syringes versus blood collected using vacuum-driven devices [such as BD Vacutainer® tubes (BD, Franklin Lakes, NJ, USA)] was performed recently [23]. No significant difference was found either in terms of PBMC yields or T cell function. The latter was assessed by human leucocyte antigen (HLA) class I multimer and IFN-γ ELISPOT assays, both targeting viral epitope-specific CD8+ T cell responses (level of evidence: D).
Anti-coagulants
It is often assumed that ethylenediamine tetraacetic acid (EDTA)-anti-coagulated blood is not suitable for T cell analyses, because its Ca2+-chelating properties may inhibit T cell activation. Bull et al. [24] compared EDTA, acid–citrate–dextrose (ACD) and sodium heparin as anti-coagulants for collecting blood samples. Contrary to common belief, they concluded that these anti-coagulants did not differ in terms of cell recovery, viability and function (as assessed by IFN-γ ELISPOT and intracellular staining of PBMCs stimulated with CD8+ T cell peptide epitopes). However, the performance of EDTA-stored blood tended to deteriorate more quickly with increasing storage time (24 h) before processing. This deterioration was less pronounced with heparin, as both viability and IFN-γ secretion were more stable over time (8 versus 24 h).
Similar conclusions were also obtained by comparing physical and phenotypic parameters with older technologies [25]. Light-scatter distributions were stable for ACD- or heparin-treated blood, whereas EDTA caused changes in the granulocyte distributions. Phenotypic determination of CD4+ (defined as Leu3+) and CD8+ (Leu2+) lymphocytes was also most stable for ACD or heparinized blood compared to EDTA [25].
No significant differences were recorded when cytomegalovirus (CMV)-specific responses were analysed by intracellular IFN-γ assays on PBMCs isolated from blood drawn on sodium heparin, lithium heparin or sodium citrate. However, when whole blood assays were performed in parallel, lithium heparin yielded slightly higher CMV-specific responses [26]. Hence, we recommend using heparin as anti-coagulant for T cell assays (level of evidence: C). Lithium heparin may have an additional edge over sodium heparin for blood assays (level of evidence: D).
Blood storage until processing
This issue has been analysed thoroughly in the human immunodeficiency virus (HIV) field, where it was found that time from venipuncture to cryopreservation was the most critical parameter affecting subsequent cell recovery and function [24]. In this multi-centre study, the other parameters considered were type of anti-coagulant used, method of PBMC isolation and procedure for sample shipping. Although the performance of fresh PBMCs was not considered, an increase from 8 h to 24 h before processing and cryopreservation greatly affected sample quality. When PBMCs were drawn in sodium heparin and separated on a Ficoll gradient, 24 versus 8 h reduced recovery by 30% (from 83% to 53%), viability by 4% (from ∼96% to 92%) and viral peptide-reactive T cells (IFN-γ ELISPOT) by 36–56% [24]. Similar results were obtained in an HIV vaccine trial, in which processing of blood samples within 12 h led to threefold higher IFN-γ ELISPOT responses [27].
One possible reason for blood stored for prolonged periods at room temperature performing less well in T cell assays is an increase in granulocyte contamination of the PBMC preparation. Granulocytes become activated upon prolonged storage, which affects their buoyancy profile resulting in less efficient separation by density gradient procedures [28,29]. In a recent study addressing this point [29], it was found that PBMC contamination by activated (CD11b+CD15+) granulocytes was observed within 8 h after venipuncture and room temperature storage (2·3–fold increase), and increased to 11·3-fold by 24 h, in comparison to PBMCs from fresh blood (< 3 h after venipuncture). Granulocyte contamination not only reduced the relative number of T cells present in PBMCs, but also inhibited T cell proliferation following PHA stimulation in ∼75% of samples [29] and IFN-γ ELISPOT responses to CD8+ T cell viral epitope peptides [23]. Both granulocyte contamination and inhibition of T cell responses were effectively limited when granulocyte activation was reduced by diluting blood in phosphate-buffered saline (PBS) or RPMI-1640 (1:1) prior to storage [23,29]. Similar observations were made in a macaque study, in which granulocyte contamination affected the quality and quantity of spots in IFN-γ ELISPOT assays [30]. It should be noted, however, that granulocyte contamination is not the only factor altering T cell responsiveness upon prolonged blood storage. Indeed, blood samples kept under conditions minimizing granulocyte contamination (i.e. gentle agitation) also displayed decreased CD8+ T cell responsiveness against viral epitopes compared to short-stored blood and functional recovery upon preliminary dilution [23]. Interestingly, a trend towards increased counts of viral epitope-loaded HLA tetramer-positive CD8+ T cells was observed instead upon prolonged blood storage. Also in this case, blood dilution prior to storage corrected this phenomenon. The mechanism underlying this observation may be the same one at play for reduced IFN-γ ELISPOT responses. T cells from stored blood may be less responsive to antigen-specific stimulation, as elicited by peptide-loaded antigen-presenting cells in ELISPOT assays and by peptide-loaded HLA molecules in HLA multimer assays. While this translates into lower T cell responses in the case of ELISPOT, it may lead to increased multimer binding when tetramer assays are performed, as the T cell receptor may be less down-regulated upon peptide-HLA interaction. This mechanism is similar to that proposed for the facilitating effect of protein kinase inhibitors on HLA multimer staining [31].
Comparison of samples kept under gentle agitation on a rocking platform versus tubes stored horizontally without any agitation showed similar recoveries, but non-agitated samples were highly contaminated with granulocytes after prolonged (18 h) storage [23]. Also in this case, the granulocyte contamination was associated with a significant decrease in IFN-γ ELISPOT CD8+ T cell responses against viral peptide epitopes. Blood storage at room temperature rather than at 4°C is also most suitable for PBMC preservation and to avoid non-specific T cell stimulation. In line with this widespread laboratory tradition, light-scatter distributions as well as CD4+ and CD8+ T cell frequencies were found to be more stable upon storage at room temperature versus 4°C, due mainly to changes in granulocyte distribution [25,32]. Granulocyte contamination also increases substantially upon storage at 4°C [29].
Based upon these data, blood should be processed as soon as possible after drawing, ideally within 8–12 h (level of evidence: C). While waiting to be processed, blood should be agitated gently at room temperature (18–22°C) (level of evidence: D). If blood is not processed immediately (i.e. waiting time > 8 h), it should be stored diluted in RPMI-1640 (1:1) under gentle agitation, in order to decrease granulocyte contamination and to preserve detectable T cell responses (level of evidence: C). HLA multimer-based assays may instead perform better with undiluted blood (level of evidence: D).
Blood shipping
Conditions for shipping blood specimens for the eventual isolation of PBMCs have been identified recently as important for obtaining β cell-driven T cell responses. Islet-reactive IFN-γ ELISPOT CD8+ T cell responses were detected using PBMCs obtained from blood specimens shipped at room temperature in insulated containers [33,34], although no comparison with other shipping methods or with islet-reactive CD4+ T cell responses was performed. Based upon these observations, it is advisable to ship blood specimens in insulated containers that limit temperature variations (level of evidence: B).
PBMC preparation
Several factors may influence the outcome of PBMC separation upon blood-drawing and storage. Addition of medium to whole blood before centrifugation, separation media from different sources, separation tubes, centrifugation speed and frequency and addition of serum are likely to have an impact on cell quality, quantity and/or function.
Separation media and separation tubes
A small study with a single blood donor investigated a commercially available Ficoll separation medium (Lymphoprep, Nycomed, Zurich, Switzerland) compared with an institutionally made Ficoll preparation (5·7% Ficoll, 9% sodium amidotrizoate; prepared by the Department of Immunohaematology and Blood Transfusion at Leiden University, the Netherlands). The latter yielded more CD3+ cells and higher tetanus toxoid-specific proliferative (up to 50% increase) and cytokine (up to 200% increase) responses [as measured by enzyme-linked immunosorbent assay (ELISA) on culture supernatants][35].
Another study compared standard Ficoll gradient centrifugation with BD Vacutainer® cell preparation tube (CPT™) (BD, Franklin Lakes, NJ, USA) and Leucosep® tube (Greiner Bio-One, Kremsmuenster, Austria) techniques [36]. The BD Vacutainer® CPT™ is a vacuum-driven drawing tube containing anti-coagulant and a cell separation medium, comprising a polyester gel and a density gradient liquid. It therefore enables blood to be drawn and PBMCs to be separated in the same tube, without the need for blood dilution or transfer to other containers. The Greiner Bio-One Leucosep® tubes have a porous membrane that separates the density gradient medium from the blood sample, thus avoiding their accidental mixture before centrifugation. This barrier thus eliminates the need for blood dilution and overlay on the Ficoll phase. Moreover, the same membrane keeps the PBMC layer separated from the red blood cell pellet and buffy coat after density gradient centrifugation, thus allowing PBMC recovery simply by decanting the tube. Ficoll and CPT™ were compared initially at a Swedish institution, leading to similar results in terms of PBMC yield, viability and function (IFN-γ ELISPOT responses to a viral peptide pool). The same was not true when the study was repeated in a Tanzanian laboratory, where Ficoll separation yielded a higher number and viability of PBMCs than CPT™ tubes [36]. Another report comparing Ficoll and CPT™ separation reached opposite conclusions, with CPT™ giving higher yields and lower granulocyte contamination but lower viability [37]. A third report concluded that the recovery, viability and performance (IFN-γ ELISPOT responses to CMV and HIV peptides) of cryopreserved PBMCs separated by Ficoll or CPT™ were similar [38]. Therefore, Ficoll and Leucosep® separation were compared additionally at the Tanzanian institute, highlighting better yields and viability with this second approach. IFN-γ ELISPOT responses were not different with any of the three separation techniques using either fresh or frozen/thawed PBMCs [36].
The better performance of the Leucosep® device over Ficoll separation has to be interpreted in light of the degree of experience of laboratory personnel preparing blood. Indeed, the Ficoll separation technique is highly operator-dependent, while the CPT™ and Leucosep® tubes are designed to avoid such variations. Conceivably, less experienced operators would benefit the most from these simplified devices, and this could explain the better performance of the Leucosep® tubes in the less specialized Tanzanian setting. Indeed, similar to most results obtained with CPT™ tubes [36,38], another study found no difference in the yields obtained between standard Ficoll versus Leucosep® separation, and no effect on IFN-γ ELISPOT and class I tetramer readouts for viral epitope-specific CD8+ T cells [23]. The only difference was for blood stored 18 h prior to processing, as IFN-γ ELISPOT responses to CD8+ T cell viral epitopes were higher for Ficoll-separated PBMCs, and equivalent to those detected upon shorter (3 h) storage. However, this difference was abolished when blood was diluted prior to storage. Of note, these are encouraging results, as they invite the use of simplified procedures such as Leucosep® or CPT™ separation for improved consistency among different operators, without a major loss in cell recovery and function.
Based upon data available to date, it is therefore recommended that blood is processed using Ficoll density gradient centrifugation. Ficoll separation can be performed using either standard tubes or special devices such as Leucosep® or CPT™ tubes for easier handling and better consistency (level of evidence: D). The level of experience of operators is an important factor in choosing between standard and Leucosep®/CPT™ tubes, as the latter are more convenient in less experienced hands or when multiple operators with different skills are involved in blood processing. Cost per sample also needs to be considered, especially for CPT™ tubes. Clearly, different Ficoll separation media can affect PBMC yields, but this issue needs to be further explored.
Washes
Several washing steps are involved during PBMC preparation. The use of different washing media [e.g. RPMI-1640, Hanks' balanced salt solution (HBSS) or PBS] has not been analysed thoroughly. However, addition of human serum to the washing buffer was found to enhance final PBMC yields greatly (up to 40·5% median increase). Yield improvement was proportional to the amount of human serum added up to 10%. Further increasing human serum concentrations did not raise PBMC counts further, but led to significantly reduced HLA tetramer staining (40·0% median decrease), without changes in IFN-γ ELISPOT responses [23]. No comparison with sera or albumin of animal origin was performed, but these reagents should be avoided to rule out T cell responses to xeno-proteins. Based upon these results, it is recommended to perform PBMC washes in PBS or RPMI-1630 containing 10% human serum (level of evidence: D). The best compromise between human serum concentration/cost and subsequent PBMC yields may be determined by each laboratory, depending upon the application. For 5,6-carboxy-succinimidyl-fluorescence-ester (CFSE)-based proliferation assays [39], cells should be transferred to serum-free media prior to labelling and/or the CFSE concentration increased to avoid the blocking effect of serum.
Use of whole blood versus PBMCs
A feature of PBMCs is that they have been isolated from their physiological environment in blood by manipulation in a hyperosmolar Ficoll solution. Moreover, PBMCs are resuspended subsequently in artificial media containing serum or other growth-supporting factors, which may have profound modifying effects on T cell function. Changes in the function of dendritic cells (DCs) removed from their physiological environment may also affect adversely T cell responses to antigens that require processing and presentation. Unmanipulated whole blood approximates most closely the state of circulating cells in vivo and contains factors at physiological concentrations that influence T cell function. Moreover, whole blood assays can be performed more rapidly and conveniently, even in a non-specialized setting. Following culture with antigens or other stimuli, lysed/fixed blood or plasma can be frozen down and shipped to a central facility for analysis [40]. Another notable advantage is that smaller volumes are needed when blood is used without preliminary PBMC purification, making this type of assay particularly attractive in children or in settings where repeated testing is performed. Petrovsky and colleagues [41] suggested that blood should be used undiluted, as cytokine secretion (assessed by ELISA on plasma supernatants) decreases gradually with serial blood dilution. The optimal stimulation period in the presence of antigen was of 36–48 h, after which haemolysis becomes a problem. Time from venisection affected assay performance critically, already at 1 h after drawing [41]. The performance of PBMC versus whole blood T cell assays was compared by Suni and colleagues [42] using intracellular cytokine staining after a 6-h challenge with CMV. Undiluted whole blood consistently yielded higher T cell frequencies than purified PBMCs [42]. However, a more recent study [26] also using similar stimuli and the same T cell readout (intracellular IFN-γ staining) reached the opposite conclusion: responses were consistently higher in PBMCs than in whole blood, occurred at lower concentrations of stimulant and were sometimes detected only on PBMCs [26]. In conclusion, further studies are needed to settle the question of the sensitivity of whole blood versus PBMC assays, and how red blood cell lysis affects T cell recovery and function.
PBMC freezing
Rationale
As with many biological investigations, it is often desirable to perform batch analyses of T cell responses on stored samples. This requirement stems from logistic considerations and from a need to reduce interassay variations, especially when samples are collected longitudinally from the same subjects. Moreover, large multi-centre clinical trials often demand that T cell analyses are performed in a centralized specialist laboratory. Availability of frozen aliquots also enables complementary analyses at later times, as new hypotheses arise or novel techniques become available. Attempts have therefore been made to optimize and standardize freezing protocols for human PBMCs, and to investigate the relative contribution of reagents, handling and timing on PBMC viability and function.
Freezing affects PBMC proliferation and cytokine secretion as well as protein and mRNA expression. Various mechanisms are responsible for cell damage during freeze–thaw processes, including oxidative stress, mechanical injury due to ice crystal formation, altered physical properties of cellular structures, osmotic injury, disturbed ion homeostasis due to Na+/K+-adenosine triphosphatase (ATPase) inhibition and apoptosis. Traditional protocols rely on supplementation of freezing media with penetrating cryoprotectants such as dimethylsulphoxide (DMSO), glycerol, ethylene glycol or hydroxyethyl starch [43]. Their major role is the prevention of lethal ice crystal formation and osmotic injury.
Overall impact of freezing/thawing on PBMC viability and function
Studies of the effects of freezing/thawing on PBMCs have been performed with blood of T1D patients [35,44], healthy subjects and patients with other diseases such as HIV infection [24,45,46]. As expected, all show that fresh blood yields more viable cells than frozen PBMCs. In T1D children, frozen PBMCs were found to secrete spontaneously more IL-6, IFN-γ, IL-10, IL-12, IL-13 and monocyte chemoattractant protein (MCP)-1 upon thawing as compared to fresh PBMCs, using a multiplex ELISA technique on 72 h culture supernatants [44]. This was especially true for IFN-γ, the spontaneous secretion of which was undetectable in fresh samples compared to ∼70% of cryopreserved samples. This observation is in line with data obtained with IFN-γ ELISPOT formats, examining low-grade CD8+ T cell responses against viral peptide epitopes [33]. Basal IFN-γ secretion was much higher in cryopreserved versus fresh PBMCs, but the net antigen-specific response remained comparable [33]. Similarly, increased net (i.e. basal-subtracted) antigen-specific secretion of IL-6, IFN-γ, TNF-α and MIP-1α was observed upon stimulation of frozen/thawed cells with the T1D-associated self-antigen GAD65, whereas net IL-10 and IL-13 responses to GAD65 were diminished [44]. All other spontaneous and antigen-induced cytokine and chemokine responses tested [IL-5, IL-17; interferon gamma-induced protein (IP)-10, MIP-1β, regulated on activation normal T cell expressed and secreted (RANTES)] did not differ significantly between fresh and cryopreserved samples. Furthermore, spontaneous mRNA expression of forkhead box P3 (FoxP3) and transforming growth factor (TGF)-β1 was increased upon freezing [44]. The authors concluded that these differences between fresh and frozen PBMCs do not preclude T cell studies on cryopreserved material, as most antigen-specific cytokine responses are preserved or even amplified. Along the same lines, studies using conventional recall antigens concluded that optimized PBMC handling procedures allow detection after cryopreservation of similar frequencies of CD4+ and CD8+ T cells expressing type 1/type 2 cytokine signatures measured by ELISPOT [24,47]. This is partially at variance with another report looking at IFN-γ, IL-4, IL-5, IL-9, IL-10 and IL-13 responses measured by ELISA, ELISPOT and/or real-time reverse transcription–polymerase chain reaction (RT–PCR) in the basal state and after stimulation with self-antigens, allergens and mitogens in different patient groups (multiple sclerosis patients, atopic and non-atopic children and pregnant women). Significant differences were documented between fresh and cryopreserved samples, depending upon patient group, antigen stimulus and cytokine response. In particular, IL-4 expression was decreased in spontaneous and self-antigen/allergen-stimulated conditions in cryopreserved cells [48].
Another study addressed the effects of Ficoll isolation and cryopreservation on DCs, showing that these procedures affect the ratio of plasmacytoid to conventional DC subsets and their chemokine receptor expression, resulting in more mature phenotypes [49]. B cells were also shown to be influenced by freezing [50]. Density gradient isolation, cryopreservation and thawing led to a significant loss of CD19+ B cells, whereas CD4+ and CD8+ T cells were unaffected. However, small decreases in HLA-DR+ CD38+ and CD45RA+ CD62L+ lymphocytes were observed within both the CD4+ and CD8+ subsets [50]. Similarly, a loss of CD62L and CCR5 expression in cryopreserved versus fresh PBMCs has been documented [51]. Despite these alterations, fewer than 10% of specimens that had proliferative responses to mitogens or microbial antigens lost their responsiveness after cryopreservation [50]. Another investigation reported significant (∼36%) reductions in Treg (CD4+FoxP3+) cell frequencies in all samples from healthy subjects following cryopreservation. A strong correlation between the percentages of CD4+FoxP3+ T cells in fresh and frozen PBMC samples was maintained, however [52].
Overall, these investigations underscore the importance of developing standardized procedures optimized for the intended research purpose, in terms of antigens used, cytokine or other T cell readouts and subject groups. When frozen PBMC samples are used, it is essential to document the degree of reproducibility between fresh and frozen samples for each particular T cell assay employed. However, few systematic studies have tried to define the relative contribution of handling, timing and reagents used for freezing and thawing of human PBMCs. As readouts differ among studies, it is not always easy to generalize these findings. We summarize below the critical parameters analysed in these studies. Different freezing protocols do differ in their performance, and analysing the effects of these protocols on the autoimmune responses of T1D patients is an area of ongoing study for the IDS T-Cell Workshop Committee. While waiting for these and other investigations to fill gaps relevant to the T1D field, a tentative consensus is proposed where possible.
Freezing media
As explained above (see paragraph ‘Blood storage until processing’), the critical parameter affecting PBMC recovery after freezing is the length of time of blood storage before processing [24,27]. To a lesser extent, this is also true for fresh PBMC preparations, and is associated with increased granulocyte contamination [29]. In the study by Bull and colleagues [24], blood samples were either stored for less than 8 h or for 24 h before PBMC isolation and cryopreservation. Results showed that storage of blood before processing for 24 h resulted in decreased PBMC viability (≥ 86–92%) and yields, compared to processing within 8 h (≥ 94% viability).
Bull and colleagues [24] also compared the performance of two different freezing media, i.e. 10% DMSO diluted in fetal bovine serum (FBS) or in 12·5% human serum albumin (HSA)/87·5% RPMI-1640. No significant differences in PBMC viability or yields were recorded [24]. In another study, Disis and colleagues [53] compared a larger panel of freezing media, namely FBS, human AB serum, HSA (12·5% in RPMI-1640) and dextran-40, all containing 10% DMSO. Surprisingly, PBMC viability using human AB serum was clearly inferior to all other media (77·9% versus > 93%, respectively), while dextran-40 resulted in significant cell clumping. Overall, these results are in line with those of Bull and colleagues [24], as FBS and HSA performed equally well. When these two media were compared for the resulting T cell responses ([3H]-thymidine proliferation against tetanus toxoid), only responses from HSA-cryopreserved PBMCs, although reduced, showed an acceptable correlation with responses of fresh PBMCs [53].
Overall, these results favour HSA-containing freezing media. One problem, also shared by FBS and human AB serum preparations, is the variable quality and performance of different HSA sources and preparations. In particular, lipid contaminants present in HSA can affect T cell responses significantly. Use of recombinant HSA could be a viable alternative, but it has not been tested thoroughly. To limit lot-to-lot variability, serum-free freezing media have been considered. Martinuzzi and colleagues [54] reported superior PBMC recoveries in samples frozen in AIM-V® medium (Invitrogen, Carlsbad, CA, USA) compared to human AB serum, both containing 10% DMSO. After thawing, the IFN-γ ELISPOT signal against CD8+ T cell viral peptides titrated at minimal concentrations did not differ significantly, but AIM-V® freezing medium allowed an average recovery of 17% more cells (P < 0·04) [54]. Interestingly, AIM-V® medium contains HSA, which may explain its superior performance.
Based on available data, no clear recommendation can currently be formulated. Further comparison of different freezing media needs to be carried out in the T1D field before a consensus can be reached.
Caspase inhibitors
Given that freezing/thawing procedures trigger apoptotic mechanisms, investigators have tried to inhibit these by adding the caspase-3 inhibitor zVAD-fmk in the freezing and/or thawing medium [55]. This was shown to reduce cell death by only ∼5% under optimal storage conditions, associated with efficient down-regulation of caspase-3 activation [55]. These studies were, however, performed on cell lines and haematopoietic progenitor cells. In the absence of data on PBMCs and relevant T cell readouts, no recommendation can be formulated currently.
PBMC concentration for freezing
In the study by Disis and colleagues [53], no significant differences in viability were observed when PBMCs were frozen at concentrations of 1 × 10⁷, 2 × 10⁷ or 3 × 10⁷ cells/ml per cryovial (1 ml per cryovial). Thus, it seems safe to recommend freezing PBMCs at concentrations ≤ 3 × 10⁷ PBMCs/ml (level of evidence: E). Higher concentrations have not been tested systematically.
Rate of PBMC temperature decrease during freezing
A major aim in PBMC cryopreservation is to avoid intracellular freezing, which occurs when cooling is too rapid and insufficient intracellular water is removed osmotically. Equations have been developed which describe the kinetics of this water loss and permit one to predict the likelihood of intracellular freezing as a function of cooling rate. Conversely, slow freezing can also cause cell injury because, as ice forms outside the cell, the residual unfrozen medium forms channels of decreasing size and increasing solute concentration. Cells lie in these channels and shrink in osmotic response to the rising solute concentration. It is for these reasons that, upon suspension in the freezing solution, PBMCs should be gradually brought to lower temperatures. To ensure stepwise temperature decrease, devices such as ‘Mr Frosty’ containers (Nalgene/Thermo Fisher, Rochester, NY, USA) are used which exploit exchange with an isopropyl alcohol medium to achieve temperature lowering at ∼1°C/min rates. Alcohol-free containers using different temperature exchange systems (e.g. CoolCell, BioCision, Larkspur, CA, USA) achieve the same rate of temperature reduction. They have the notable advantage of lower run-to-run variability, as there is no alcohol to be replaced every five freezing cycles. Such containers should be placed in −70/−80°C refrigerators, and transferred quickly into liquid nitrogen tanks after 24–72 h.
An issue which remains unsettled is whether the starting temperature of the freezing medium should be 4°C or room temperature. Traditionally, ice-cold freezing medium containing DMSO has been added to cells inactivated metabolically by chilling on ice to minimize toxic side effects of DMSO. An initial study from Kreher and colleagues [47] compared freezing cells according to this classic protocol with adding freezing medium at room temperature. This latter procedure afforded a cell recovery of ∼84% with a viability of ∼94%. In contrast, when chilled freezing medium was added, only 54% of the cells were recovered. Cold-frozen PBMCs were also less functional in an ELISPOT assay compared to warm-frozen cells [47]. The authors hypothesized that the metabolic toxicity of DMSO may be outweighed by a temperature-sensitive mechanism involving membrane lipids. At room temperature, membrane lipids are in a fluid state and the lipophilic DMSO can integrate evenly into the membranes to exert its cryoprotective effect. In contrast, chilling causes a membrane transition to a gel phase involving lipid crystallization that interferes with the integration of DMSO [56]. A subsequent study by Tree and colleagues [35] came to opposite conclusions: PBMCs frozen in warm medium lost recall responses to low-dose tetanus toxoid by ELISPOT, with higher numbers of IFN-γ-secreting cells observed in the medium-only control. Responses were, however, detectable with cold-frozen PBMCs. A warm-freeze protocol has been implemented by the Immune Tolerance Network (http://immunetolerance.org/sites/files/ITN_Protocol_PBMC-CPT.pdf).
In conclusion, it is not clear at what temperature (4°C or room temperature) the freezing medium should be added to PBMCs. However, the temperature should be gradually (1°C/min) decreased to −70°C (level of evidence: E). Cryovials should then be transferred promptly to liquid nitrogen (i.e. within 24–72 h) (level of evidence: E).
Storage temperature of frozen PBMCs
The duration of storage of frozen PBMCs is not indefinite (see the section ‘Long-term PBMC preservation in liquid nitrogen’) and the storage temperature will influence directly the time during which the samples can be recovered without damage. Lower storage temperatures are associated with extended viability of the preserved samples. Long-term (i.e. > 1 week) storage at −80°C should therefore be avoided, as PBMC recovery and viability are impaired severely upon thawing (level of evidence: D) [24]. In a comparison between Ficoll-isolated PBMCs stored and shipped in liquid nitrogen versus PBMCs stored for 3 weeks at −70°C followed by dry ice (i.e. −70°C) shipping, percentage of median cell recovery was 92% versus 80% and percentage of median viability 94% versus 91%, respectively, both differences being statistically significant [24]. However, short-term storage (i.e. ≤ 72 h) is not significantly different at −80°C or in liquid nitrogen (mean viability 97·3 ± 1·0% versus 98·2 ± 1·0%, respectively) [53]. Short-term storage at −80°C can be an option when PBMCs are shipped shortly after freezing, as shipping can then be carried out on dry ice rather than in liquid nitrogen, without major losses (see paragraph ‘Shipping of frozen PBMCs’).
Lower PBMC recovery after prolonged storage at −80°C is due to the fact that, at this temperature, metabolic activity of the cells has not ceased, due to small residual amounts of unfrozen water. All metabolic activity ceases only when sample temperature is reduced to below the glass transition phase of water (−132°C). Storage below −130°C in liquid nitrogen therefore offers the most secure form of preservation. Because it is clear that storage in liquid nitrogen containers represents at present the best long-term option for PBMC preservation, the question is whether storage should be in the liquid or vapour phase. In liquid phase, samples are completely submerged in liquid nitrogen at a temperature of −196°C. Above the liquid nitrogen, the vapour phase is at a temperature of −150°C. As this is well below the glass transition phase of −132°C, storage in the vapour phase is sufficient for efficient PBMC cryopreservation (level of evidence: E).
Shipping of frozen PBMCs
Once stored in liquid nitrogen, frozen PBMCs should be maintained as such until use. This is particularly relevant when PBMC samples need to be shipped from one centre to another, as evaluated thoroughly in a multi-centre HIV trial [24]. PBMCs were prepared and stored at −70°C for 24 h, after which they were either shipped in liquid nitrogen containers (with vials stored in the vapour phase) or in dry ice. Although final PBMC performance (assessed by IFN-γ ELISPOT and intracellular staining) was equivalent for both methods, shipping in liquid nitrogen proved superior, with PBMC recovery (92% versus 87%) and viability (94% versus 91%) differing slightly but significantly [24]. It is therefore recommended that PBMCs are shipped in liquid nitrogen (level of evidence: D). Although the T cell function (but not viability) was unaffected by storage and shipping at −70°C, in this case PBMCs were stored at −70°C for only 1 night before shipping, a condition difficult to achieve in the routine setting. More realistically, longer-term storage may be needed before samples can be shipped, a condition requiring temperatures below −132°C. Although not tested formally in any study, it is suggested that, unless the thawing step is under way, shifting PBMCs to higher temperatures once they are stored in liquid nitrogen should be avoided. This includes transferring cells from −180°C (i.e. liquid nitrogen) to −70°C (i.e. dry ice) or prolonged handling of vials as they are transferred from one container to another.
Long-term PBMC preservation in liquid nitrogen
Are some PBMC subsets more affected by liquid nitrogen storage? In HIV-1-infected patients, PBMC density gradient isolation, cryopreservation and thawing resulted in significant loss (∼8%) of CD19+ B cells, but no measurable loss of total T cells or CD4+/CD8+ subsets. Interestingly, this loss was not specific to the freezing procedure, as it was already observed upon PBMC separation compared to whole blood. Only small decreases in activated (HLA-DR+ CD38+; 3–6%) and naive (CD45RA+ CD62L+; 7–8%) fractions were observed within both CD4+ and CD8+ T cells. Loss of activated T cells had also already occurred upon PBMC isolation from whole blood [50].
How long can PBMCs be stored in liquid nitrogen? Owen and colleagues [57] found that long-term (> 1 year) cryopreservation of PBMCs from HIV-infected individuals in the vapour phase of liquid nitrogen resulted in greater losses of IFN-γ responses compared to short-term (< 6 months) storage, as measured by intracellular cytokine staining. These losses were observed for CD4+ T cells stimulated with either whole protein or peptide antigens, and for CD8+ T cells stimulated with whole protein, but not with peptide antigens. In other words, peptide-specific CD8+ T cell responses were the only ones to be preserved faithfully. Despite cell viabilities maintained at acceptable levels (81–95%), these losses may be due to a reduction in critical antigen-presenting cell (APC) populations. Indeed, adding exogenous APCs [in the form of autologous Epstein–Barr virus (EBV)-transformed B cells] partially restored IFN-γ responses to protein antigen stimulation for both CD4+ and CD8+ T cells, but it did not restore CD4+ T cell IFN-γ responses to peptide stimulation. Losses were also correlated with increased CD4+ T cell apoptosis [57]. Based upon these observations, it is advisable not to store PBMC samples for more than 6 months whenever possible, especially when studying CD4+ T cell responses (level of evidence: D). Peptide-specific CD8+ T cell responses may be less susceptible to longer storage times. However, this recommendation can rarely be fulfilled in clinical trial settings or in longitudinal studies exploring the natural history of T1D.
Thawing of PBMCs
Thawing temperature
It is common laboratory practice to thaw cryopreserved PBMCs rapidly by transferring them directly from liquid nitrogen to 37°C, while promptly diluting and washing away the DMSO-containing freezing solution with pre-warmed medium. As for freezing, the rationale is to minimize osmotic variations likely to occur with slow thawing, and to avoid the toxic effects of DMSO. The study from Disis et al. supports this practice: when the thawing medium was pre-cooled to 4°C, mean viability was 69·7% compared to 92·5% at 25°C and to 95·1% at 37°C (level of evidence: E) [53].
Thawing volume, centrifugation time and speed
No differences in PBMC viability were observed when cryovials were resuspended after thawing in a large volume (50 ml) versus low volume (15 ml), or washed and centrifuged for 5 min compared with 10 min, or at 280 g compared to 450 g (level of evidence: E) [53].
DNase treatment
Cell clumping is a frequent problem following PBMC thawing, leading to loss of cells. This is due commonly to cell death with release of viscous DNA, leading to cell aggregates which further adhere to and incorporate viable cells. Garcia-Pineres and colleagues, together with several other groups, reported that incorporation of a DNAse treatment step in the standard thawing procedure efficiently avoided clumping and did not result in detectable changes in cell viability, expression of standard leucocyte surface markers or T cell proliferation (as assessed by [3H]-thymidine incorporation) and cytokine secretion (as assessed by cytokine multiplex assay on culture supernatants) in response to a variety of stimuli (PHA, tetanus toxoid and influenza A virus) [58]. Therefore, this procedure is compatible with T cell assays when cell clumping is an issue (level of evidence: C). DNase preparations purified from bovine or porcine organs should be avoided, however, as T cells could be activated by xeno-protein contaminants.
Resting PBMCs before T cell analyses
Several groups have reported that detection of antigen-specific T cell responses by IFN-γ ELISPOT using cryopreserved PBMCs is improved when cells are rested prior to assay [27,46,59,60]. This is due probably to the fact that a fraction of cells undergoing death is eliminated with resting, thus allowing more accurate counts of viable cells used for assay and eliminating interference by non-viable cells (particular with respect to background noise). This resting period has traditionally been overnight (∼12 h) [27,46,59,60], but the optimal period has not been investigated. None the less, a resting period seems advisable for T cell assays such as ELISPOT and, possibly, for other functional assays using different readouts (level of evidence: C).
Critical parameters in performing T cell assays
Culture media
Most protocols with PBMCs use serum to provide optimal conditions for T cell viability, reactivity and expansion. As use of autologous serum or plasma is often impractical, human serum from AB-positive donors devoid of natural antibodies against the major AB blood antigens is used most commonly. Fetal bovine or fetal calf sera are sometimes used as alternatives, as they are more readily accessible and less expensive. Obtaining this material from animal fetuses assures a low level of immunoglobulins, thus limiting undesired cross-species reactions. All types of sera are heat-inactivated before use by exposure to 45–56°C to destroy complement activity without affecting their culture-promoting properties. However, the use of human serum is recommended over serum from other species, as human T cells may have unexpected reactivities with xeno-proteins (level of evidence: E).
Another drawback shared by all serum preparations is the high lot-to-lot variability. This requires testing and comparing several batches to identify those with the best performance (defined typically as a low background : high signal ratio in the assay of choice). Such testing is recommended for human serum used not only during T cell assays, but also throughout PBMC isolation and freeze/thawing procedures. In this respect, use of serum-free culture media (e.g. AIM-V®, Invitrogen, Carlsbad, CA, USA; or X-VIVO®, Lonza, Walkersville, MD, USA) eliminates much of this variability. These media are proprietary formulations containing human serum albumin and different growth factors. A recent study by Martinuzzi et al. [54] found that PBMCs isolated freshly from healthy donors and stimulated in AIM-V® medium yielded higher (2·4-fold) antigen-specific signals in IFN-γ ELISPOTS upon challenge with low-dose HLA-A2-restricted viral peptides, compared to RPMI-1640 supplemented with human serum. AIM-V® performance was also superior to serum-supplemented RPMI-1640 for detecting the IFN-γ ELISPOT CD8+ T cell responses of T1D patients against the HLA-A2-restricted glutamic acid decarboxylase (GAD)114–123 epitope [54]. Interestingly, the advantage conferred by AIM-V® as well as other serum-free media such as X-VIVO® was not due to the absence of serum itself, as it was preserved when serum-free media were supplemented with the same percentage and lot of serum used in standard RPMI-1640 medium [54]. Limited lot-to-lot variability and better performance in functional assays are arguments in favour of serum-free media (level of evidence: B).
Supplementation with low-dose cytokines such as IL-2 [33,34] or IL-7 [54] may further improve detection of T cell responses to islet antigens. Indeed, addition of low concentrations (0·5 ng/ml) of IL-7 was found to enhance (1·5-fold) the signal-to-noise ratio in IFN-γ ELISPOT assays with CD8+ T cell peptides. In this respect, IL-7 proved superior to IL-2, due perhaps to its preferential action on effector/memory [IL-7 receptor (CD127)+]versus regulatory (CD127–) T cells, or on memory versus naive T cells. Other cytokines found previously to increase detection sensitivity such as IL-15 [61] did not have the same effect, as they greatly increased background with little advantage on the net signal [54]. Interestingly, the IL-7 effect was highly synergic with that of serum-free AIM-V medium. Indeed, incorporating both variations into the ELISPOT procedure greatly amplified (35·1-fold increase) detection of low-grade responses to CD8+ T cell epitopes in T1D [54], compared to a previously optimized procedure using human serum-supplemented medium and low-dose IL-2 [33]. Currently available data suggest therefore that IL-7-supplemented media may increase detection of antigen-specific IFN-γ ELISPOT T cell responses, including islet-specific ones (level of evidence: B), but this superior performance needs to be confirmed.
Antigens
Another critical parameter is the quality of the antigens used in T cell assays. This is especially true for recombinant protein antigens, which are produced commonly in bacterial (Escherichia coli), yeast or Baculovirus systems. These technologies can carry over contaminants from the host cells to the final recombinant antigen preparation, including irrelevant proteins and endotoxin [62,63]. The quality of antigen, including purity and endotoxin concentration, should therefore be evaluated thoroughly before application to T cell assays. The panel of recombinant protein antigens fulfilling these requirements can thus be limited. None the less, proteins allow exploration of the whole repertoire of T cell responses against the selected antigen rather than responses against specific epitope-HLA combinations elicited by peptide antigens.
Conversely, peptides can be synthesized by biochemical techniques at high purity. It is for this reason that many investigators prefer peptides as antigens for T cell assays. It should be noted, however, that even peptides are not completely free from minor contaminants that can affect results. For example, Mannering and colleagues [64] found that a CD4+ T cell clone raised against a 10-mer proinsulin C65-A9 peptide was specific for a minor (< 0·5%) contaminant N-terminal Fmoc (9-fluorenylmethoxycarbonyl) adduct. During peptide synthesis, Fmoc is used to block the N-terminus between additions of each amino acid and is removed normally in a final de-blocking step. The universal use of Fmoc chemistry means that traces of peptides with uncleaved Fmoc at the N-terminus may be present in many synthetic peptides. Indeed, subsequent analysis by mass spectrometry of a peptide set containing 72 15-mer proinsulin peptides revealed that up to 15% contained species that were 222 Da heavier than the target peptide, consistent with Fmoc adducts [64]. Hence, T cell responses to Fmoc-blocked peptides can potentially confound the interpretation of T cell assays. Other peptide adduct contaminants have also been described [65–67].
The same types of preparations, i.e. proteins or peptides, used to evaluate disease-related T cell responses should also be used as positive controls to elicit memory recall responses in a majority of study subjects. Examples include tetanus toxoid or different cocktails of viral peptides. Polyclonal stimuli such as PHA, PMA/ionomycin or anti-CD3/CD28 antibody should be included only as supplementary positive controls for those patients who do not respond to the recall antigens of choice. They should in no case substitute for recall protein or peptide antigens, as T cell stimulation by these agents is less physiological and does not follow the same rules of antigen-specific stimulation.
In conclusion, neither protein nor peptide antigen preparations can be assumed to be completely free from potential contaminants. High-quality antigens (> 95% pure, endotoxin-free) are essential, although not necessarily sufficient (level of evidence: A). Similar reagents that elicit memory responses should also be included in T cell assays, along with polyclonal stimuli (level of evidence: E).
Reporting T cell assays
The lack of conformity on reporting T cell assay data often hampers the ability to objectively evaluate data, in the diabetes field as well as in other domains. To address this issue, a project christened MIATA (Minimal Information About T cell Assays) has been launched [68]. This project proposes to generate recommendations on the minimum information required to allow an objective and thorough interpretation of published results from immunological T cell assays. The initiative is currently undergoing a public consultation phase, in order to integrate the input and experience from a large number of experts in the field (http://www.miataproject.org). The long-term objective of this effort is to transform this initial consultation document into an acceptable framework for reporting data from T cell-based immunoassays. The vision for this project is to allow the establishment of an openly accessible and searchable public database to facilitate objective evaluation and meta-analysis of data generated in immune monitoring studies. The framework generated by this initiative will probably also be an important reference for reporting T cell assay results in the T1D field.
Conclusions
What we know
When comparing antigen-specific T cell responses in different individuals, it is of the upmost importance to standardize the procedures used for blood collection, processing and preservation. The following recommendations are proposed (Table 2). The strength of these recommendations should be gauged following two criteria: (i) the level of evidence upon which they are based, from A (highest) to E (lowest; see Table 1; level of evidence for each recommendation is indicated in brackets); and (ii) the T cell assays used in published reports from which the recommendation was derived, as different T cell readouts may or may not be sensitive to the same parameter. These T cell assays are summarized in Table 2.
Table 2.
Recommended procedures in processing blood samples for T cell assays.
| Step | Recommendations | Level of evidence | Major unknowns | T cell assays used for validation | References |
|---|---|---|---|---|---|
| Blood drawing | Fasting state | E | n.a. | [1–20,71,72] | |
| Same time of the day | E | Whole blood IFN-γ/IL-10 ELISA | [21,22] | ||
| Vacuum tubes or syringes | D | IFN-γ ELISPOT, class I MMrs | [23] | ||
| Sodium or lithium heparin | C | IFN-γ ELISPOT, IFN-γ ICS | [24–26] | ||
| Minimum delay in processing (8–12 h) | C | IFN-γ ELISPOT | [23,24,27–30] | ||
| Room tewmperature storage, gentle agitation | D | IFN-γ ELISPOT, class I MMrs | [23,25,29,32] | ||
| Dilution if storage > 8 h | C | IFN-γ ELISPOT, class I MMrs | [23,29] | ||
| Blood shipping | Insulated containers | B | IFN-γ ELISPOT | [33,34] | |
| PBMC preparation | Ficoll ± Leucosep® or CPT™ tubes | D | IFN-γ ELISPOT, class I MMrs | [23,36–38] | |
| Ficoll preparations? | [35] | ||||
| Washes with media containing human serum | D | IFN-γ ELISPOT, class I MMrs | [23] | ||
| Whole blood versus PBMCs? | [26,40–42] | ||||
| PBMC freezing | Freezing media? | [24,53,54] | |||
| Medium temperature? | [35,47,56] | ||||
| Caspase inhibitors? | [55] | ||||
| PBMC concentration ≤ 3 × 10⁷/ml | E | n.a. | [53] | ||
| Cooling rate 1°C/min down to −70°C | E | n.a. | |||
| Prompt transfer to liquid nitrogen (24–72 h) | E | n.a. | [24,53] | ||
| Storage temperature ≤ −132°C (vapour or liquid nitrogen) | E | n.a. | [24,53] | ||
| PBMC shipping | Liquid nitrogen (vapour or liquid phase) | D | IFN-γ ELISPOT, IFN-γ ICS | [24] | |
| Long-term preservation | Better if < 6 months | D | IFN-γ ICS | [57] | |
| PBMC thawing | Rapid, 37°C thawing temperature | E | n.a. | [53] | |
| 15–50 ml thawing volumes | E | n.a. | [53] | ||
| 280–450 g, 5–10 min centrifugation | E | n.a. | [53] | ||
| DNase treatment if clumping | C | [3H]-TdR, cytokine ELISA | [58] | ||
| 1–12 h PBMC resting | C | IFN-γ ELISPOT | [27,46,59,60] | ||
| T cell assays | Human serum-supplemented media | E | n.a. | ||
| Serum-free media | B | IFN-γ ELISPOT | [54] | ||
| Addition of low-dose cytokines (e.g. IL-7)? | [33,34,54] | ||||
| High quality protein or peptide antigens | A | [3H]-TdR | [62–67] | ||
| Positive controls: recall antigens and polyclonal stimuli | E | n.a. |
[3H]-TdR: thymidine incorporation; ICS: intracellular cytokine staining; MMrs: human leucocyte antigen multimers; n.a.: not available; PBMC: peripheral blood mononuclear cells; IL: interleukin; IFN: interferon; ELISPOT: enzyme-linked immunospot; ELISA: enzyme-linked immunosorbent assay.
Blood-drawing:
Preferably in the fasting state (E)
Preferably at the same time of the day for all draws (E)
Vacuum tubes or syringes (D)
Sodium or lithium heparin as anti-coagulant (C)
Minimum delay in processing, preferably within 8–12 h after drawing (C)
Blood storage at room temperature with gentle agitation prior to processing (D)
If delay (> 8 h), dilute 1:1 with PBS or RPMI (C)
Blood shipping:
Insulated containers controlling for temperature variations (B)
PBMC separation:
Ficoll density gradient centrifugation with standard tubes or designer tubes such as Leucosep® or CPT™, depending on the experience of the operators (D)
Washes in PBS or medium containing human serum (D)
PBMC freezing:
PBMC concentrations ≤ 3 × 10⁷/ml (E)
Gradual reduction in temperature to −70°C at ∼1°C/min with Mr Frosty or CoolCell device (E)
Prompt transfer (after 24–72 h) of cryovials to liquid nitrogen (E)
Long-term storage at ≤ −132°C in the vapour (−150°C) or liquid (−196°C) nitrogen phase (E)
Shipping of frozen PBMCs:
In liquid nitrogen, in vapour or liquid phase (D)
Long-term PBMC preservation in liquid nitrogen:
Preferably < 6 months, especially for assay of CD4+ T cell responses (D)
PBMC thawing:
Rapidly, with medium pre-warmed to 37°C (E)
Cryovials resuspended in small (15 ml) or large (50 ml) volumes (E)
Tubes centrifuged at different speeds and for different times (280 g for 5 min or 450 g for 10 min) (E)
DNase treatment an option to avoid cell clumping (C)
Rest period (2–16 h) preferred before functional T cell assays (C)
T cell testing:
In media supplemented with human serum (E) or in serum-free media (AIM-V®, X-VIVO®) (B)
Quality-controlled protein or peptide antigens (> 95% pure and endotoxin-free) (A)
Positive controls: recall protein or peptide antigens; and polyclonal stimuli (PHA, PMA/ionomycin, anti-CD3/CD28 antibody) (E)
What we do not know and need to investigate. The following points cannot be resolved by the currently available literature and should be investigated further:
Performance of different Ficoll preparations used for PBMC separation
Performance of assays utilizing whole blood versus purified PBMCs
Performance of different freezing media
Performance of pre-cooled (4°C) or warm (room temperature) freezing media
Use of apoptosis inhibitors during the freezing and/or thawing steps
Efficacy of cytokine-supplemented media for functional T cell assays
Effects of blood processing parameters on antigen-specific Treg responses. In the absence of antigen-specific Treg assays directly exploring the Treg suppressive activity, there are no publications describing the effect of different processing variables on the function of these cells. IL-10 ELISPOT assays detecting islet-specific responses that could be ascribed to Treg populations have been described [69,70], but processing parameters affecting these responses have not been evaluated. This area remains largely unexplored, and recommendations formulated here for IFN-γ CD4+ and CD8+ responses or CD8+ T cells detected by peptide-loaded HLA multimers may not apply to Tregs.
Multi-centre studies launched by the T-Cell Workshop Committee of the Immunology of Diabetes Society should help to reach a consensus on optimized and standardized laboratory procedures for T cell assays. Furthermore, conclusions from these studies will have implications outside the field of autoimmunity.
Acknowledgments
The T-Cell Workshop Committee of the Immunology of Diabetes Society is supported generously by the Juvenile Diabetes Research Foundation (JDRF grant no. 5-2009-413). We wish to thank L. C. Harrison, T. Delovitch, G. T. Nepom and B. O. Roep for critical review of the manuscript.
Appendix
The T-Cell Workshop Committee of the Immunology of Diabetes Society: Barbara M. Brooks-Worrell, Veterans Affairs Puget Sound Health Care System, University of Washington, Seattle, WA, USA; Corrado M. Cilio, Lund University, Department of Clinical Sciences, Cellular Autoimmunity Unit, Malmö, Sweden; Ivana Durinovic-Bellò, Benaroya Research Institute, Seattle, WA, USA; Peter A. Gottlieb, Barbara Davis Center for Childhood Diabetes, University of Colorado Denver, School of Medicine, Aurora, CO, USA; Roberto Mallone, INSERM, U986, DeAR Lab Avenir, Saint Vincent de Paul Hospital, Paris, France; Stuart I. Mannering, St Vincent's Institute of Medical Research and University of Melbourne, Department of Medicine, St. Vincent's Hospital, Fitzroy, Victoria, Australia; Nanette C. Schloot, Institute for Clinical Diabetology, German Diabetes Center, Leibniz Institute for Diabetes Research at Heinrich-Heine-University and Department for Metabolic Diseases at University Hospital, Düsseldorf, Germany; Tim I. Tree, King's College London, Department of Immunobiology, London, UK; F. Susan Wong, Cardiff University, Centre for Endocrine and Diabetes Science, Cardiff, UK.
Disclosure
Authors have no disclosures to report.
References
- 1.Lord GM, Matarese G, Howard JK, Baker RJ, Bloom SR, Lechler RI. Leptin modulates the T-cell immune response and reverses starvation-induced immunosuppression. Nature. 1998;394:897–901. doi: 10.1038/29795. [DOI] [PubMed] [Google Scholar]
- 2.De Rosa V, Procaccini C, Cali G, et al. A key role of leptin in the control of regulatory T cell proliferation. Immunity. 2007;26:241–55. doi: 10.1016/j.immuni.2007.01.011. [DOI] [PubMed] [Google Scholar]
- 3.Matarese G, Di GA, Sanna V, et al. Requirement for leptin in the induction and progression of autoimmune encephalomyelitis. J Immunol. 2001;166:5909–16. doi: 10.4049/jimmunol.166.10.5909. [DOI] [PubMed] [Google Scholar]
- 4.Sanna V, Di GA, La CA, et al. Leptin surge precedes onset of autoimmune encephalomyelitis and correlates with development of pathogenic T cell responses. J Clin Invest. 2003;111:241–50. doi: 10.1172/JCI16721. [DOI] [PMC free article] [PubMed] [Google Scholar]
- 5.De Rosa V, Procaccini C, La CA, et al. Leptin neutralization interferes with pathogenic T cell autoreactivity in autoimmune encephalomyelitis. J Clin Invest. 2006;116:447–55. doi: 10.1172/JCI26523. [DOI] [PMC free article] [PubMed] [Google Scholar]
- 6.Matarese G, Sanna V, Lechler RI, et al. Leptin accelerates autoimmune diabetes in female NOD mice. Diabetes. 2002;51:1356–61. doi: 10.2337/diabetes.51.5.1356. [DOI] [PubMed] [Google Scholar]
- 7.Lee CH, Reifsnyder PC, Naggert JK, et al. Novel leptin receptor mutation in NOD/LtJ mice suppresses type 1 diabetes progression: I. Pathophysiological analysis. Diabetes. 2005;54:2525–32. doi: 10.2337/diabetes.54.9.2525. [DOI] [PubMed] [Google Scholar]
- 8.Lee CH, Chen YG, Chen J, et al. Novel leptin receptor mutation in NOD/LtJ mice suppresses type 1 diabetes progression: II. Immunologic analysis. Diabetes. 2006;55:171–8. [PubMed] [Google Scholar]
- 9.Savendahl L, Underwood LE. Decreased interleukin-2 production from cultured peripheral blood mononuclear cells in human acute starvation. J Clin Endocrinol Metab. 1997;82:1177–80. doi: 10.1210/jcem.82.4.3865. [DOI] [PubMed] [Google Scholar]
- 10.Hansen K, Sickelmann F, Pietrowsky R, Fehm HL, Born J. Systemic immune changes following meal intake in humans. Am J Physiol. 1997;273:R548–R553. doi: 10.1152/ajpregu.1997.273.2.R548. [DOI] [PubMed] [Google Scholar]
- 11.Esposito K, Nappo F, Marfella R, et al. Inflammatory cytokine concentrations are acutely increased by hyperglycemia in humans: role of oxidative stress. Circulation. 2002;106:2067–72. doi: 10.1161/01.cir.0000034509.14906.ae. [DOI] [PubMed] [Google Scholar]
- 12.Assaloni R, Da RR, Quagliaro L, et al. Effects of S21403 (mitiglinide) on postprandial generation of oxidative stress and inflammation in type 2 diabetic patients. Diabetologia. 2005;48:1919–24. doi: 10.1007/s00125-005-1849-5. [DOI] [PubMed] [Google Scholar]
- 13.Kempf K, Rose B, Herder C, et al. The metabolic syndrome sensitizes leukocytes for glucose-induced immune gene expression. J Mol Med. 2007;85:389–96. doi: 10.1007/s00109-006-0132-7. [DOI] [PubMed] [Google Scholar]
- 14.Pfleger C, Meierhoff G, Kolb H, Schloot NC. Association of T-cell reactivity with beta-cell function in recent onset type 1 diabetes patients. J Autoimmun. 2010;34:127–35. doi: 10.1016/j.jaut.2009.08.004. [DOI] [PubMed] [Google Scholar]
- 15.Pfleger C, Mortensen HB, Hansen L, et al. Association of IL-1ra and adiponectin with C-peptide and remission in patients with type 1 diabetes. Diabetes. 2008;57:929–37. doi: 10.2337/db07-1697. [DOI] [PubMed] [Google Scholar]
- 16.Pfleger C, Kaas A, Hansen L, et al. Relation of circulating concentrations of chemokine receptor CCR5 ligands to C-peptide, proinsulin and HbA1c and disease progression in type 1 diabetes. Clin Immunol. 2008;128:57–65. doi: 10.1016/j.clim.2008.03.458. [DOI] [PubMed] [Google Scholar]
- 17.Strom TB, Bear RA, Carpenter CB. Insulin-induced augmentation of lymphocyte-mediated cytotoxicity. Science. 1975;187:1206–8. doi: 10.1126/science.163492. [DOI] [PubMed] [Google Scholar]
- 18.Snow EC, Feldbush TL, Oaks JA. The role of insulin in the response of murine T lymphocytes to mitogenic stimulation in vitro. J Immunol. 1980;124:739–44. [PubMed] [Google Scholar]
- 19.Berman JS, Center DM. Chemotactic activity of porcine insulin for human T lymphocytes in vitro. J Immunol. 1987;138:2100–3. [PubMed] [Google Scholar]
- 20.Viardot A, Grey ST, Mackay F, Chisholm D. Potential antiinflammatory role of insulin via the preferential polarization of effector T cells toward a T helper 2 phenotype. Endocrinology. 2007;148:346–53. doi: 10.1210/en.2006-0686. [DOI] [PubMed] [Google Scholar]
- 21.Petrovsky N, Harrison LC. The chronobiology of human cytokine production. Int Rev Immunol. 1998;16:635–49. doi: 10.3109/08830189809043012. [DOI] [PubMed] [Google Scholar]
- 22.Petrovsky N, Harrison LC. Diurnal rhythmicity of human cytokine production: a dynamic disequilibrium in T helper cell type 1/T helper cell type 2 balance? J Immunol. 1997;158:5163–8. [PubMed] [Google Scholar]
- 23.Afonso G, Scotto M, Renand A, et al. Critical parameters in blood processing for T-cell assays: validation on ELISpot and tetramer platforms. J Immunol Methods. 2010;359:28–36. doi: 10.1016/j.jim.2010.05.005. [DOI] [PubMed] [Google Scholar]
- 24.Bull M, Lee D, Stucky J, et al. Defining blood processing parameters for optimal detection of cryopreserved antigen-specific responses for HIV vaccine trials. J Immunol Methods. 2007;322:57–69. doi: 10.1016/j.jim.2007.02.003. [DOI] [PMC free article] [PubMed] [Google Scholar]
- 25.Thornthwaite JT, Rosenthal PK, Vazquez DA, Seckinger D. The effects of anticoagulant and temperature on the measurements of helper and suppressor cells. Diagn Immunol. 1984;2:167–74. [PubMed] [Google Scholar]
- 26.Hoffmeister B, Bunde T, Rudawsky IM, Volk HD, Kern F. Detection of antigen-specific T cells by cytokine flow cytometry: the use of whole blood may underestimate frequencies. Eur J Immunol. 2003;33:3484–92. doi: 10.1002/eji.200324223. [DOI] [PubMed] [Google Scholar]
- 27.Kierstead LS, Dubey S, Meyer B, et al. Enhanced rates and magnitude of immune responses detected against an HIV vaccine: effect of using an optimized process for isolating PBMC. AIDS Res Hum Retroviruses. 2007;23:86–92. doi: 10.1089/aid.2006.0129. [DOI] [PubMed] [Google Scholar]
- 28.Schmielau J, Finn OJ. Activated granulocytes and granulocyte-derived hydrogen peroxide are the underlying mechanism of suppression of T-cell function in advanced cancer patients. Cancer Res. 2001;61:4756–60. [PubMed] [Google Scholar]
- 29.McKenna KC, Beatty KM, Vicetti MR, Bilonick RA. Delayed processing of blood increases the frequency of activated CD11b+ CD15+ granulocytes which inhibit T cell function. J Immunol Methods. 2009;341:68–75. doi: 10.1016/j.jim.2008.10.019. [DOI] [PubMed] [Google Scholar]
- 30.De Rose R, Taylor EL, Law MG, van der Meide PH, Kent SJ. Granulocyte contamination dramatically inhibits spot formation in AIDS virus-specific ELISpot assays: analysis and strategies to ameliorate. J Immunol Methods. 2005;297:177–86. doi: 10.1016/j.jim.2004.12.009. [DOI] [PubMed] [Google Scholar]
- 31.Lissina A, Ladell K, Skowera A, et al. Protein kinase inhibitors substantially improve the physical detection of T-cells with peptide-MHC tetramers. J Immunol Methods. 2009;340:11–24. doi: 10.1016/j.jim.2008.09.014. [DOI] [PMC free article] [PubMed] [Google Scholar]
- 32.Hensleigh PA, Waters VB, Herzenberg LA. Human T lymphocyte differentiation antigens: effects of blood sample storage on Leu antibody binding. Cytometry. 1983;3:453–5. doi: 10.1002/cyto.990030612. [DOI] [PubMed] [Google Scholar]
- 33.Mallone R, Martinuzzi E, Blancou P, et al. CD8+ T-cell responses identify beta-cell autoimmunity in human type 1 diabetes. Diabetes. 2007;56:613–21. doi: 10.2337/db06-1419. [DOI] [PubMed] [Google Scholar]
- 34.Martinuzzi E, Novelli G, Scotto M, et al. The frequency and immunodominance of islet-specific CD8+ T-cell responses change after type 1 diabetes diagnosis and treatment. Diabetes. 2008;57:1312–20. doi: 10.2337/db07-1594. [DOI] [PubMed] [Google Scholar]
- 35.Tree TI, Roep BO, Peakman M. Enhancing the sensitivity of assays to detect T cell reactivity: the effect of cell separation and cryopreservation media. Ann NY Acad Sci. 2004;1037:26–32. doi: 10.1196/annals.1337.005. [DOI] [PubMed] [Google Scholar]
- 36.Nilsson C, Aboud S, Karlen K, Hejdeman B, Urassa W, Biberfeld G. Optimal blood mononuclear cell isolation procedures for gamma interferon enzyme-linked immunospot testing of healthy Swedish and Tanzanian subjects. Clin Vaccine Immunol. 2008;15:585–9. doi: 10.1128/CVI.00161-07. [DOI] [PMC free article] [PubMed] [Google Scholar]
- 37.Schlenke P, Kluter H, Muller-Steinhardt M, Hammers HJ, Borchert K, Bein G. Evaluation of a novel mononuclear cell isolation procedure for serological HLA typing. Clin Diagn Lab Immunol. 1998;5:808–13. doi: 10.1128/cdli.5.6.808-813.1998. [DOI] [PMC free article] [PubMed] [Google Scholar]
- 38.Ruitenberg JJ, Mulder CB, Maino VC, Landay AL, Ghanekar SA. VACUTAINER CPT and Ficoll density gradient separation perform equivalently in maintaining the quality and function of PBMC from HIV seropositive blood samples. BMC Immunol. 2006;7:11. doi: 10.1186/1471-2172-7-11. [DOI] [PMC free article] [PubMed] [Google Scholar]
- 39.Mannering SI, Morris JS, Jensen KP, et al. A sensitive method for detecting proliferation of rare autoantigen-specific human T cells. J Immunol Methods. 2003;283:173–83. doi: 10.1016/j.jim.2003.09.004. [DOI] [PubMed] [Google Scholar]
- 40.Hanekom WA, Hughes J, Mavinkurve M, et al. Novel application of a whole blood intracellular cytokine detection assay to quantitate specific T-cell frequency in field studies. J Immunol Methods. 2004;291:185–95. doi: 10.1016/j.jim.2004.06.010. [DOI] [PubMed] [Google Scholar]
- 41.Petrovsky N, Harrison LC. Cytokine-based human whole blood assay for the detection of antigen-reactive T cells. J Immunol Methods. 1995;186:37–46. doi: 10.1016/0022-1759(95)00127-v. [DOI] [PubMed] [Google Scholar]
- 42.Suni MA, Picker LJ, Maino VC. Detection of antigen-specific T cell cytokine expression in whole blood by flow cytometry. J Immunol Methods. 1998;212:89–98. doi: 10.1016/s0022-1759(98)00004-0. [DOI] [PubMed] [Google Scholar]
- 43.Mazur P. Freezing of living cells: mechanisms and implications. Am J Physiol. 1984;247:C125–C142. doi: 10.1152/ajpcell.1984.247.3.C125. [DOI] [PubMed] [Google Scholar]
- 44.Axelsson S, Faresjo M, Hedman M, Ludvigsson J, Casas R. Cryopreserved peripheral blood mononuclear cells are suitable for the assessment of immunological markers in type 1 diabetic children. Cryobiology. 2008;57:201–8. doi: 10.1016/j.cryobiol.2008.08.001. [DOI] [PubMed] [Google Scholar]
- 45.Jeurink PV, Vissers YM, Rappard B, Savelkoul HF. T cell responses in fresh and cryopreserved peripheral blood mononuclear cells: kinetics of cell viability, cellular subsets, proliferation, and cytokine production. Cryobiology. 2008;57:91–103. doi: 10.1016/j.cryobiol.2008.06.002. [DOI] [PubMed] [Google Scholar]
- 46.Boaz MJ, Hayes P, Tarragona T, et al. Concordant proficiency in measurement of T-cell immunity in human immunodeficiency virus vaccine clinical trials by peripheral blood mononuclear cell and enzyme-linked immunospot assays in laboratories from three continents. Clin Vaccine Immunol. 2009;16:147–55. doi: 10.1128/CVI.00326-08. [DOI] [PMC free article] [PubMed] [Google Scholar]
- 47.Kreher CR, Dittrich MT, Guerkov R, Boehm BO, Tary-Lehmann M. CD4+ and CD8+ cells in cryopreserved human PBMC maintain full functionality in cytokine ELISPOT assays. J Immunol Methods. 2003;278:79–93. doi: 10.1016/s0022-1759(03)00226-6. [DOI] [PubMed] [Google Scholar]
- 48.Kvarnstrom M, Jenmalm MC, Ekerfelt C. Effect of cryopreservation on expression of Th1 and Th2 cytokines in blood mononuclear cells from patients with different cytokine profiles, analysed with three common assays: an overall decrease of interleukin-4. Cryobiology. 2004;49:157–68. doi: 10.1016/j.cryobiol.2004.06.003. [DOI] [PubMed] [Google Scholar]
- 49.Gerrits JH, Athanassopoulos P, Vaessen LM, Klepper M, Weimar W, van Besouw NM. Peripheral blood manipulation significantly affects the result of dendritic cell monitoring. Transpl Immunol. 2007;17:169–77. doi: 10.1016/j.trim.2006.11.006. [DOI] [PubMed] [Google Scholar]
- 50.Reimann KA, Chernoff M, Wilkening CL, Nickerson CE, Landay AL. Preservation of lymphocyte immunophenotype and proliferative responses in cryopreserved peripheral blood mononuclear cells from human immunodeficiency virus type 1-infected donors: implications for multicenter clinical trials. The ACTG Immunology Advanced Technology Laboratories. Clin Diagn Lab Immunol. 2000;7:352–9. doi: 10.1128/cdli.7.3.352-359.2000. [DOI] [PMC free article] [PubMed] [Google Scholar]
- 51.Costantini A, Mancini S, Giuliodoro S, et al. Effects of cryopreservation on lymphocyte immunophenotype and function. J Immunol Methods. 2003;278:145–55. doi: 10.1016/s0022-1759(03)00202-3. [DOI] [PubMed] [Google Scholar]
- 52.Elkord E. Frequency of human T regulatory cells in peripheral blood is significantly reduced by cryopreservation. J Immunol Methods. 2009;347:87–90. doi: 10.1016/j.jim.2009.06.001. [DOI] [PubMed] [Google Scholar]
- 53.Disis ML, dela Rosa C, Goodell V, et al. Maximizing the retention of antigen specific lymphocyte function after cryopreservation. J Immunol Methods. 2006;308:13–18. doi: 10.1016/j.jim.2005.09.011. [DOI] [PubMed] [Google Scholar]
- 54.Martinuzzi E, Scotto M, Enee E, et al. Serum-free culture medium and IL-7 costimulation increase the sensitivity of ELISpot detection. J Immunol Methods. 2008;333:61–70. doi: 10.1016/j.jim.2008.01.003. [DOI] [PubMed] [Google Scholar]
- 55.Stroh C, Cassens U, Samraj AK, Sibrowski W, Schulze-Osthoff K, Los M. The role of caspases in cryoinjury: caspase inhibition strongly improves the recovery of cryopreserved hematopoietic and other cells. FASEB J. 2002;16:1651–3. doi: 10.1096/fj.02-0034fje. [DOI] [PubMed] [Google Scholar]
- 56.Wolfe J, Bryant G. Freezing, drying, and/or vitrification of membrane- solute-water systems. Cryobiology. 1999;39:103–29. doi: 10.1006/cryo.1999.2195. [DOI] [PubMed] [Google Scholar]
- 57.Owen RE, Sinclair E, Emu B, et al. Loss of T cell responses following long-term cryopreservation. J Immunol Methods. 2007;326:93–115. doi: 10.1016/j.jim.2007.07.012. [DOI] [PMC free article] [PubMed] [Google Scholar]
- 58.Garcia-Pineres AJ, Hildesheim A, Williams M, Trivett M, Strobl S, Pinto LA. DNAse treatment following thawing of cryopreserved PBMC is a procedure suitable for lymphocyte functional studies. J Immunol Methods. 2006;313:209–13. doi: 10.1016/j.jim.2006.04.004. [DOI] [PubMed] [Google Scholar]
- 59.Britten CM, Gouttefangeas C, Welters MJ, et al. The CIMT-monitoring panel: a two-step approach to harmonize the enumeration of antigen-specific CD8+ T lymphocytes by structural and functional assays. Cancer Immunol Immunother. 2008;57:289–302. doi: 10.1007/s00262-007-0378-0. [DOI] [PMC free article] [PubMed] [Google Scholar]
- 60.Janetzki S, Panageas KS, Ben-Porat L, et al. Results and harmonization guidelines from two large-scale international Elispot proficiency panels conducted by the Cancer Vaccine Consortium (CVC/SVI) Cancer Immunol Immunother. 2008;57:303–15. doi: 10.1007/s00262-007-0380-6. [DOI] [PMC free article] [PubMed] [Google Scholar]
- 61.Jennes W, Kestens L, Nixon DF, Shacklett BL. Enhanced ELISPOT detection of antigen-specific T cell responses from cryopreserved specimens with addition of both IL-7 and IL-15 – the Amplispot assay. J Immunol Methods. 2002;270:99–108. doi: 10.1016/s0022-1759(02)00275-2. [DOI] [PubMed] [Google Scholar]
- 62.Roep BO, Atkinson MA, van Endert PM, Gottlieb PA, Wilson SB, Sachs JA. Autoreactive T cell responses in insulin-dependent (Type 1) diabetes mellitus. Report of the first international workshop for standardization of T cell assays. J Autoimmun. 1999;13:267–82. doi: 10.1006/jaut.1999.0312. [DOI] [PubMed] [Google Scholar]
- 63.Peakman M, Tree TI, Endl J, van Endert P, Atkinson MA, Roep BO. Characterization of preparations of GAD65, proinsulin, and the islet tyrosine phosphatase IA-2 for use in detection of autoreactive T-cells in type 1 diabetes: report of phase II of the Second International Immunology of Diabetes Society Workshop for Standardization of T-cell assays in type 1 diabetes. Diabetes. 2001;50:1749–54. doi: 10.2337/diabetes.50.8.1749. [DOI] [PubMed] [Google Scholar]
- 64.Mannering SI, Purcell AW, Honeyman MC, McCluskey J, Harrison LC. Human T-cells recognise N-terminally Fmoc-modified peptide. Vaccine. 2003;21:3638–46. doi: 10.1016/s0264-410x(03)00402-x. [DOI] [PubMed] [Google Scholar]
- 65.Purcell AW, Chen W, Ede NJ, et al. Avoidance of self-reactivity results in skewed CTL responses to rare components of synthetic immunogens. J Immunol. 1998;160:1085–90. [PubMed] [Google Scholar]
- 66.Matsuo H, Batocchi AP, Hawke S, et al. Peptide-selected T cell lines from myasthenia gravis patients and controls recognize epitopes that are not processed from whole acetylcholine receptor. J Immunol. 1995;155:3683–92. [PubMed] [Google Scholar]
- 67.Nagvekar N, Corlett L, Jacobson LW, et al. Scanning a DRB3*0101 (DR52a)-restricted epitope cross-presented by DR3: overlapping natural and artificial determinants in the human acetylcholine receptor. J Immunol. 1999;162:4079–87. [PubMed] [Google Scholar]
- 68.Janetzki S, Britten CM, Kalos M, et al. ‘MIATA’-minimal information about T cell assays. Immunity. 2009;31:527–8. doi: 10.1016/j.immuni.2009.09.007. [DOI] [PMC free article] [PubMed] [Google Scholar]
- 69.Arif S, Tree TI, Astill TP, et al. Autoreactive T cell responses show proinflammatory polarization in diabetes but a regulatory phenotype in health. J Clin Invest. 2004;113:451–63. doi: 10.1172/JCI19585. [DOI] [PMC free article] [PubMed] [Google Scholar]
- 70.Tree TI, Lawson J, Edwards H, et al. Naturally arising human CD4 T cells that recognize islet autoantigens and secrete IL-10 regulate pro-inflammatory T cell responses via linked suppression. Diabetes. 2010;59:1451–60. doi: 10.2337/db09-0503. [DOI] [PMC free article] [PubMed] [Google Scholar]
- 71.Bao M, Yang Y, Jun HS, Yoon JW. Molecular mechanisms for gender differences in susceptibility to T cell-mediated autoimmune diabetes in nonobese diabetic mice. J Immunol. 2002;168:5369–75. doi: 10.4049/jimmunol.168.10.5369. [DOI] [PubMed] [Google Scholar]
- 72.Meier A, Chang JJ, Chan ES, et al. Sex differences in the Toll-like receptor-mediated response of plasmacytoid dendritic cells to HIV-1. Nat Med. 2009;15:955–9. doi: 10.1038/nm.2004. [DOI] [PMC free article] [PubMed] [Google Scholar]