Abstract
Our previous studies show that inhibition of phosphodiesterase 4 (PDE4) augments agonist-induced renovascular 3’,5’-cAMP secretion more in isolated, perfused kidneys from spontaneously hypertensive rats (SHR) versus Wistar-Kyoto normotensive rats (WKY); however, whether this is due to PDE4 inhibition in renovascular smooth muscle cells or endothelial cells is unknown. Therefore, we examined the effects of 3-isobutyl-1-methylxanthine (broad-spectrum PDE inhibitor) and RO 20–1724 (selective PDE4 inhibitor) on isoproterenol-induced 3’,5’-cAMP levels in cultured WKY and SHR preglomerular vascular smooth muscle and endothelial cells. 3-Isobutyl-1-methylxanthine and RO 20–1724 augmented isoproterenol-induced 3’,5’-cAMP levels similarly in WKY versus SHR endothelial cells. In contrast, 3-isobutyl-1-methylxanthine and RO 20–1724 augmented isoproterenol-induced 3’,5’-cAMP levels significantly more in SHR, compared with WKY, smooth muscle cells (p<0.0001). In both cell types from both rat strains, mRNA levels for the PDE4B subtype exceeded levels for the PDE4A, PDE4C and PDE4D subtypes, and siRNA knockdown of PDE4B mRNA in SHR smooth muscle cells increased isoproterenol-induced 3’,5’-cAMP. mRNA levels for the PDE4B2 variant exceeded levels for the PDE4B1, PDE4B3, PDE4B4 and PDE4B5 variants. In vivo, infusions of RO 20–1724 increased the urinary excretion of 3’,5’-cAMP more in SHR than WKY (p=0.0211). We conclude that: 1) the greater effect of PDE4 inhibition on renovascular 3’,5’-cAMP is mediated by inhibition of PDE4 in renovascular smooth muscle cells, not endothelial cells; 2) the major PDE4 subtype in both renovascular smooth muscle and endothelial cells is PDE4B with variant PDE4B2 likely being dominant; and 3) inhibition of PDE4 in vivo increases renal 3’,5’-cAMP levels more in genetically-hypertensive rats.
Keywords: 3’,5’-Cyclic AMP; Phosphodiesterase 4; Phosphodiesterase 4B; Phosphodiesterase 4B2; Isoproterenol; Spontaneously Hypertensive Rats; Wistar-Kyoto Rats
INTRODUCTION
Because 3’,5’-cAMP regulates renovascular tone1–4 and dysregulation of 3’,5’-cAMP levels in the renal microcirculation may participate in the pathophysiology of genetic hypertension5, 6, we recently examined in isolated, perfused kidneys from genetically hypertensive rats (i.e., spontaneously hypertensive rats; SHR) and normotensive rats (Wistar-Kyoto rats; WKY) the renal venous secretion of 3’,5’-cAMP (a measure of renal vascular 3’,5’-cAMP levels) in response to isoproterenol (β-adrenoceptor agonist)7. The goal of those experiments was to assess the regulation of 3’,5’-cAMP levels in the renal vasculature of SHR versus WKY. Because both the production (via adenylyl cyclase) and metabolism [via phosphodiesterease (PDE)] of 3’,5’-cAMP influence levels of 3’,5’-cAMP in the kidney vasculature, we examined renal venous 3’,5’-cAMP secretion in response to isoproterenol in both the absence and presence of PDE inhibitors. Importantly, renal venous 3’,5’-cAMP secretion in response to isoproterenol was similar in SHR versus WKY kidneys in the absence of PDE inhibitors, yet was much higher in SHR kidneys in the presence of either 3-isobutyl-1-methylxanthine (IBMX; broad spectrum PDE inhibitor8) or RO 20–1724 (highly selective PDE4 inhibitor 8, 9). We interpreted these findings to imply that in the SHR renal vasculature there is an increased coupling of vascular β-adrenoceptors to adenylyl cyclase, but the effect of this increased coupling on 3’,5’-cAMP levels is masked by concomitant increases in the activity of renal vascular PDE activity and more specifically, PDE4 activity.
In the aforementioned experiments, we used renal venous secretion of 3’,5’-cAMP as an index of renal vascular levels of 3’,5’-cAMP because 3’,5’-cAMP in vascular smooth muscle cells10, 11 and vascular endothelial cells12 is transported to the extracellular space and has ready access to the vascular lumen, whereas 3’,5’-cAMP produced by tubules and renal interstitial cells would have to negotiate diffusion and metabolic barriers between the interstitial space and the vascular lumen. A limitation of this model system is that it cannot resolve whether the source of renal venous 3’,5’-cAMP is the renovascular smooth muscle cell or the renovascular endothelial cell or both. Therefore, the main objective of the present study was to examine the regulation of 3’,5’-cAMP levels by PDE, and more specifically PDE4, in cultured preglomerular microvascular smooth muscle cells (PGVSMCs) and preglomerular microvascular endothelial cells (PGVECs) from SHR versus WKY. A second goal was to assess which specific PDE4 gene (PDE4A, PDE4B, PDE4C or PDE4D) is dominantly expressed in preglomerular microvascular smooth muscle cells and preglomerular microvascular endothelial cells from SHR versus WKY and to determine which specific variant (due to alternative mRNA splicing and promoters) is dominantly expressed. Finally, a third aim was to investigate whether PDE4 inhibition would differentially affect in vivo renal 3’,5’-cAMP levels in SHR versus WKY.
METHODS
Animals
Studies utilized adult male SHR and WKY (Taconic Farms; Germantown, NY). The Institutional Animal Care and Use Committee approved all procedures. The investigation conforms to the Guide for the Care and Use of Laboratory Animals published by the US National Institutes of Health (NIH Publication No. 85-23, revised 1996).
Experiments in PGVSMCs and PGVECs
PGVSMCs and PGVECs were cultured as previously described13, 14. Cells were grown to confluence, placed in phosphate-buffered saline with the indicated treatments for 30 minutes and extracted with 1 ml of 1-propanol for intracellular 3’,5’-cAMP. Protein levels were measured using the BCA assay (Pierce Biotechnology, Rockford, IL). 3’,5’-cAMP in cellular extracts was measured by mass spectrometry as previously described15 and normalized to cellular protein.
Knockdown of PDE4B mRNA
Forty pmoles of PDE4B siRNA pool or non-targeting siRNA pool (Dharmacon; Lafayette, CO) and 1.5 µl of DharmaFECT 1 (Dharmacon) were diluted to 50 µl in Opti-MEM I medium and incubated for 5 minutes at room temperature. Diluted siRNA and DharmaFECT 1 were combined and incubated for 20 minutes at room temperature. DMEM/F12 containing 10% fetal calf serum was added to the transfection mixture. Growth medium was removed from cells and replaced with tranfection mixture, and cells were incubated with transfection mixture for 72 hours.
Measurement of mRNA
Cellular RNA was isolated (TRIZOL Reagent; Life Technologies), and cDNA was synthesized using iScriptTM cDNA synthesis kit (Bio-Rad). mRNA levels were estimated using real-time polymerase chain reaction (PCR) using the SYBR Green PCR Master Mix (Applied Biosystems; Foster City, CA) in the AB 7300 Real-Time PCR System (Applied Biosystems). Threshold cycle (Ct) for target was subtracted from Ct for β-actin to calculate 2ΔCt. PCR primers for subtypes of PDE4 (PDE4A, PDE4B, PDE4C and PDE4D) were designed to detect all variants of these four gene products (Table 1). Primers to detect specific PDE4B variants (PDE4B1, PDE4B2, PDE4B3, PDE4B4 and PDE4B5) were also designed (Table 1).
Table 1.
Real Time PCR Primers
| TARGET | Real Time PCR Forward Primer Sequence (5’-3’) |
Real Time PCR Reverse Primer Sequence (5’-3’) |
Base Pair Size of Amplicon (bp) |
|---|---|---|---|
| rPDE4A | gcctgatcctttttcccttc | tttggggacttcagttcctg | 221 |
| rPDE4B | cccgcagctgtagtagaagc | caggcatttcaaagacacga | 215 |
| rPDE4C | gcagcatggttcaatggtta | atatcagctgggagcctggt | 159 |
| rPDE4D | agaggaagatggcgagtcag | tcaggacaacaatcgtctgc | 201 |
| rPDE4B1 | gcaaacagcagacatctcca | ccttgccctttcactttgtc | 236 |
| rPDE4B2 | gtcttgtccgggtcagtgtt | gctttcccctctctttgctt | 165 |
| rPDE4B3 | gccaggctttgcttactgtc | gccaaagtgcttcctctgtc | 209 |
| rPDE4B4 | cctcgtgtgtcgattgctaa | tctccatgcgtttctctgtg | 150 |
| rPDE4B5 | tctgtatcttggggttacatca | gttacgaaggtgtcggagga | ~445 |
| β-actin | actcttccagccttccttc | atctccttctgcatcctgtc | 171 |
In Vivo Experiments
Rats were anesthetized with Inactin (100 mg/kg, i.p.), placed on an isothermal pad and the trachea was cannulated with PE-240. A PE-50 cannula was inserted into a carotid artery and connected to a blood pressure analyzer (Micro-Med, Inc., Louisville, KY) for measurement of blood pressure and heart rate. A PE-50 cannula was placed in a jugular vein, and an infusion of 0.9% saline was begun (100 µl/min). A PE-10 cannula was placed in the left ureter for urine collection. After a 1-hour rest period, a 30-minute baseline urine sample was collected, and RO 20–1724 was infused intravenously at increasing doses (0, 3, 10 and 30 µg/kg/min; 100 µl/min) for 1 hour at each dose, with urine being collected during the last 30-minutes of each infusion period. 3’,5’-cAMP was measured in urine using mass spectrometry.
Statistical Analysis
Data were analyzed with a 2-factor analysis of variance (2FANOVA) followed by a Fisher’s Least Significant Difference test for specific post hoc contrasts only if the interaction term in the 2F-ANOVA was significant. All values refer to means ± SEM.
RESULTS
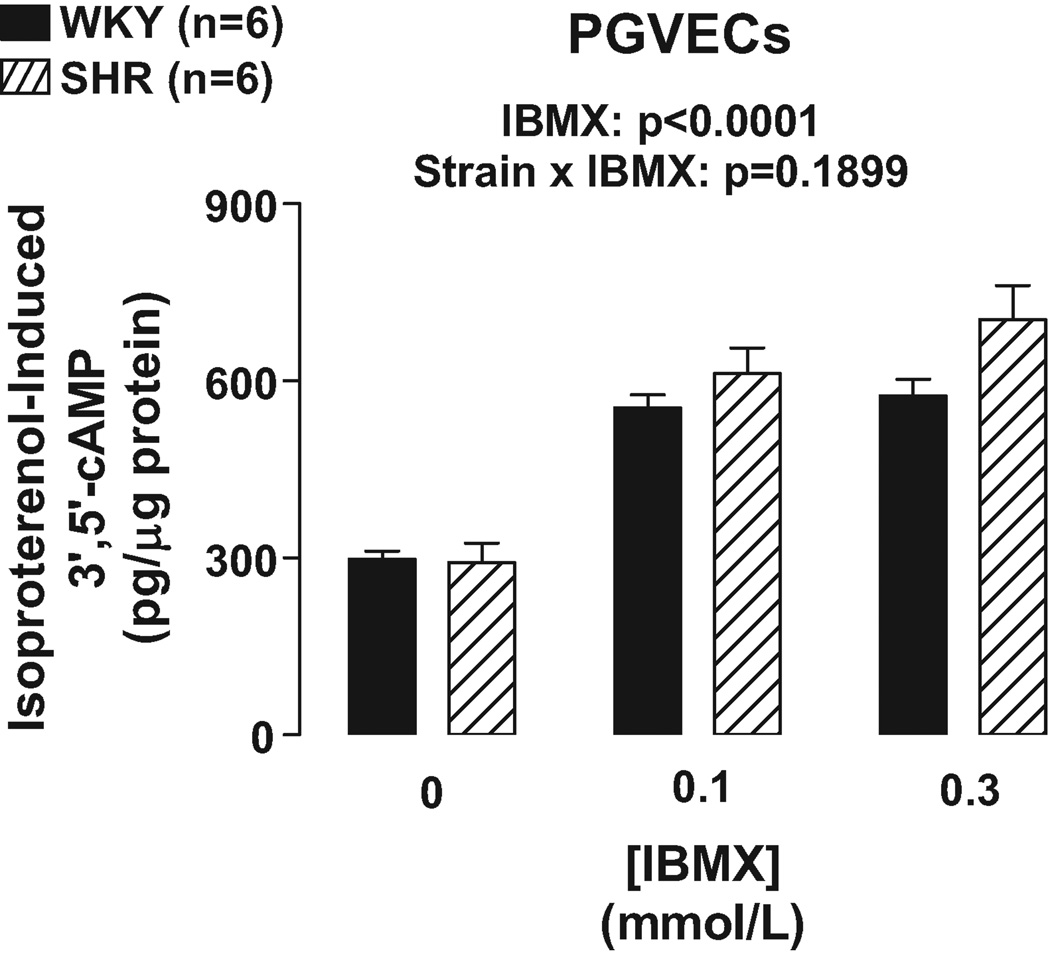
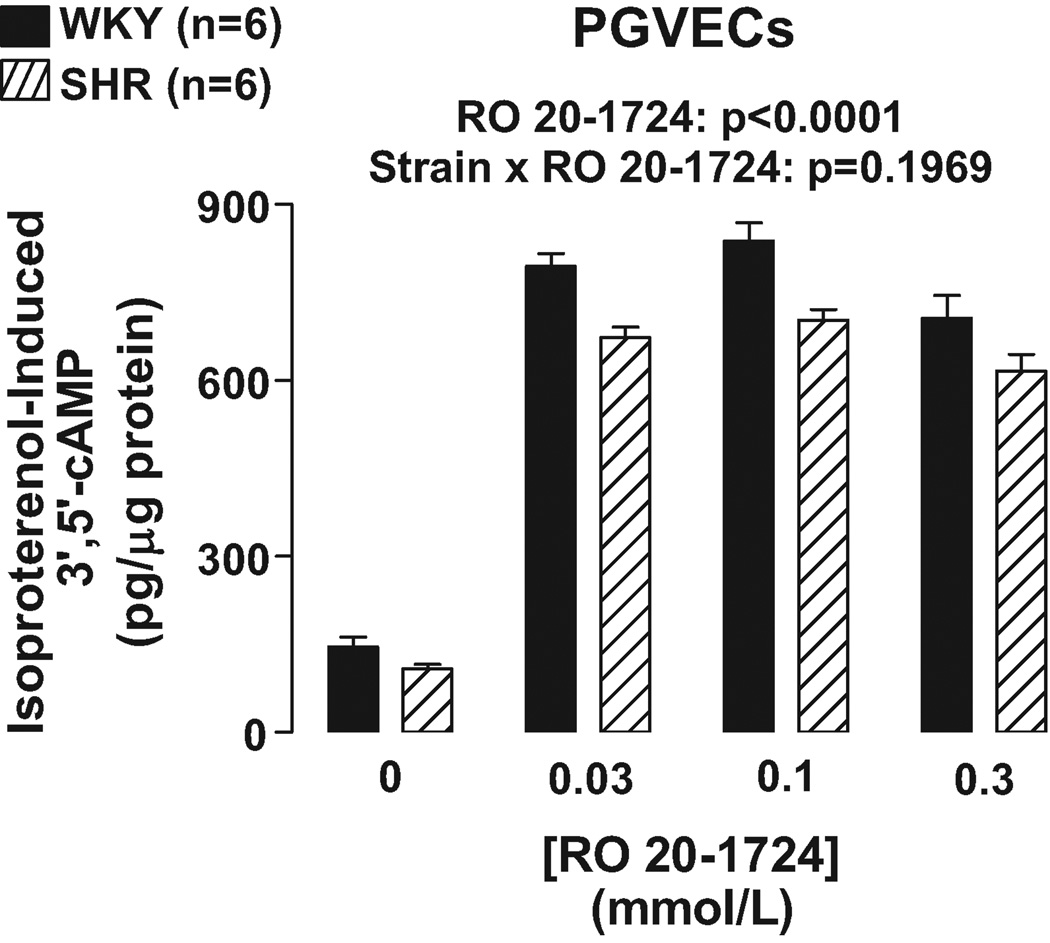
As illustrated in Figures 1 and 2, IBMX (0.1 and 0.3 mmol/L) and RO 20–1724 (0.03, 0.1 and 0.3 mmol/L) augmented isoproterenol (3 µmol/L)-induced 3’,5’-cAMP in PGVECs from both SHR and WKY (p<0.0001, effects of IBMX and RO 20–1724 in 2F-ANOVA). In PGVECs the effects of both IBMX and RO 20–1724 on isoproterenol-induced 3’,5’-cAMP were statistically independent of the strain from which the PGVECs were derived (p=0.1899 and p=0.1969, strain×IBMX and strain×RO 20–1724 interaction in 2F-ANOVA, respectively). The aforementioned effects of IBMX and RO 2 0–1724 were the same regardless of the concentrations of IBMX and RO 20–1724 indicating that maximally effective concentrations of inhibitors were employed.
Figure 1.
Bar graph illustrates effects of IBMX, a broad-spectrum PDE inhibitor, on isoproterenol-induced 3’,5’-cAMP in WKY versus SHR preglomerular vascular endothelial cells (PGVECs).
Figure 2.
Bar graph illustrates effects of RO 20–1724, a specific PDE4 inhibitor, on isoproterenol-induced 3’,5’-cAMP in WKY versus SHR preglomerular vascular endothelial cells (PGVECs).
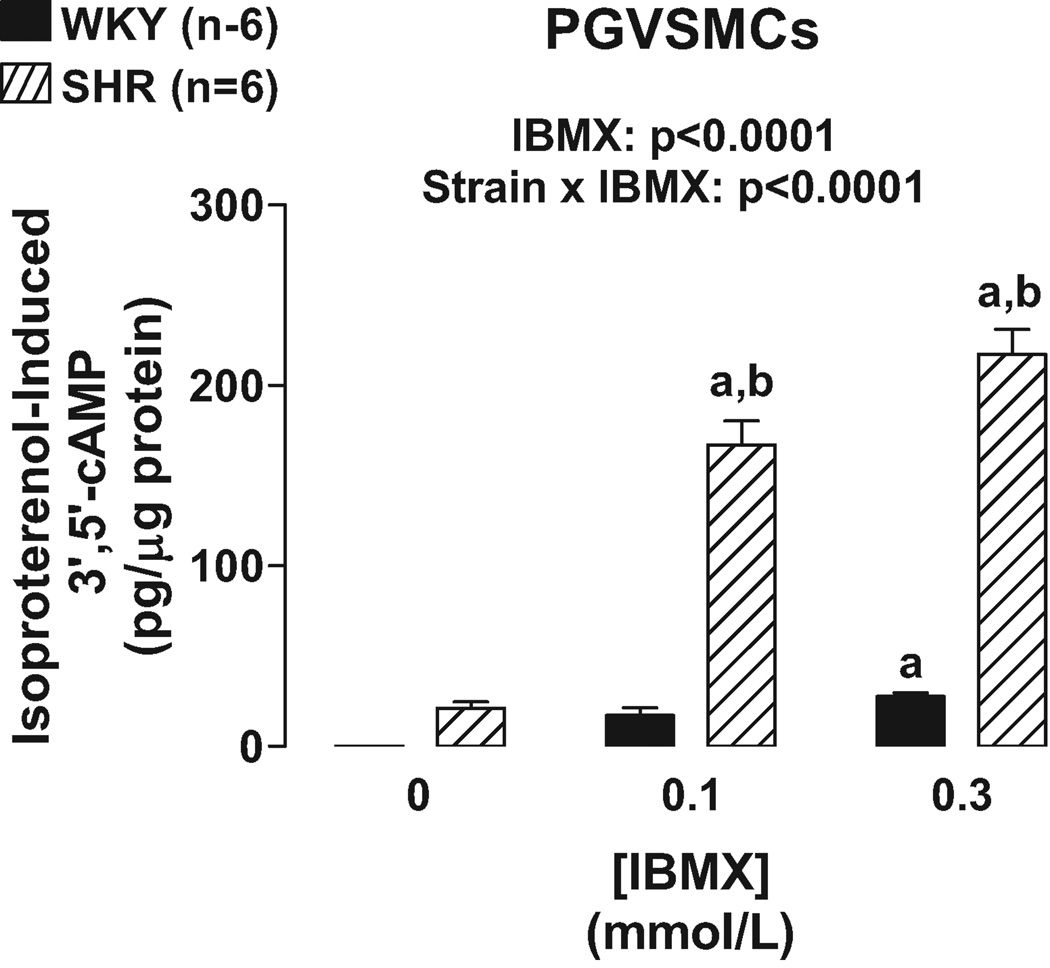
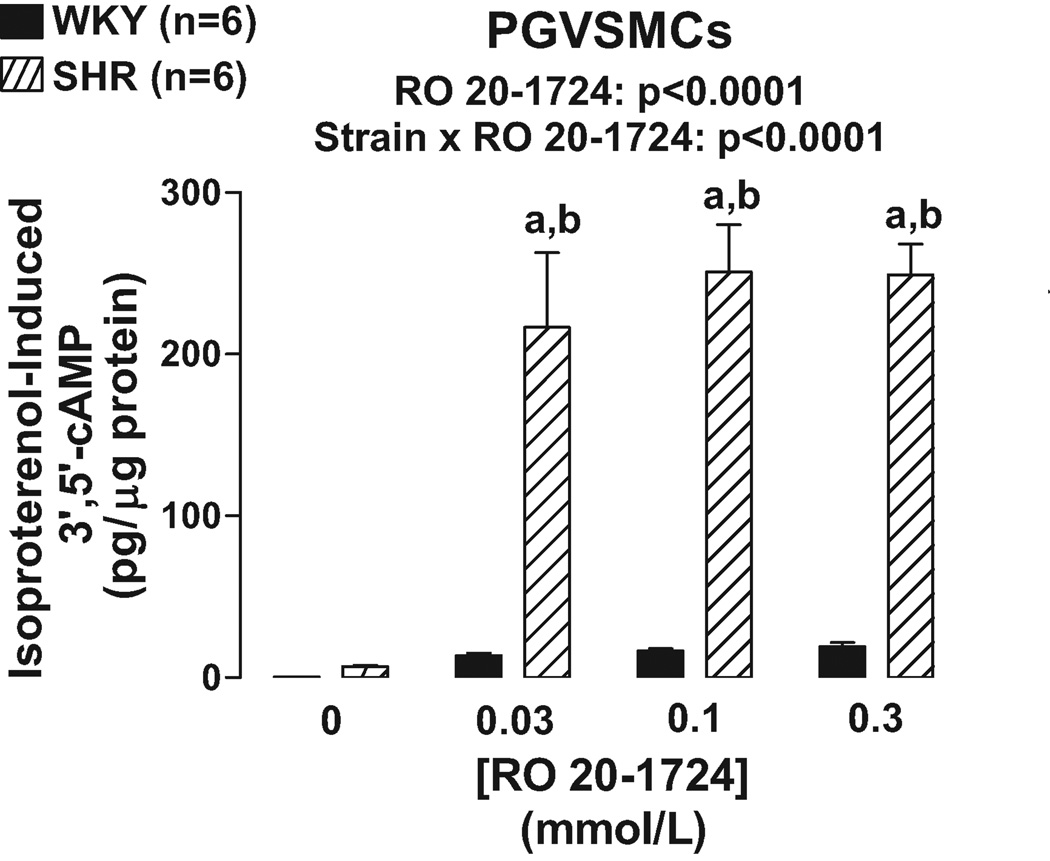
Unlike PGVECs, in PGVSMCs the effects of IBMX (Figure 3) and RO 20–1724 (Figure 4) on isoproterenol-induced 3’,5’-cAMP were statistically dependent on the strain from which the PGVSMCs were derived (p<0.0001, strain×PDE inhibitor interaction in 2F-ANOVA). Specific post hoc contrasts showed that IBMX and RO 20–1724 significantly (p<0.05) augmented isoproterenol-induced 3’,5’-cAMP in SHR PGVSMCs and that isoproterenol-induced 3’,5’-cAMP was greater in SHR versus WKY PGVSMCs in the presence, but not absence, of IBMX or RO 20–1724. As in PGVECS, in PGVSMCs the effects of IBMX and RO 20–1724 were the same regardless of the concentrations of IBMX and RO 20–1724 again indicating that maximally effective concentrations of the PDE4 inhibitors were employed.
Figure 3.
Bar graph illustrates effects of IBMX, a broad-spectrum PDE inhibitor, on isoproterenol-induced 3’,5’-cAMP in WKY versus SHR preglomerular vascular smooth muscle cells (PGVSMCs). a, Indicates p<0.05 compared with respective basal (0) levels. b, Indicates p<0.05 compared with corresponding value in WKY cells.
Figure 4.
Bar graph illustrates effects of RO 20–1724, a specific PDE4 inhibitor, on isoproterenol-induced 3’,5’-cAMP in WKY versus SHR preglomerular vascular smooth muscle cells (PGVSMCs). a, Indicates p<0.05 compared with respective basal (0) levels. b, Indicates p<0.05 compared with corresponding value in WKY cells.
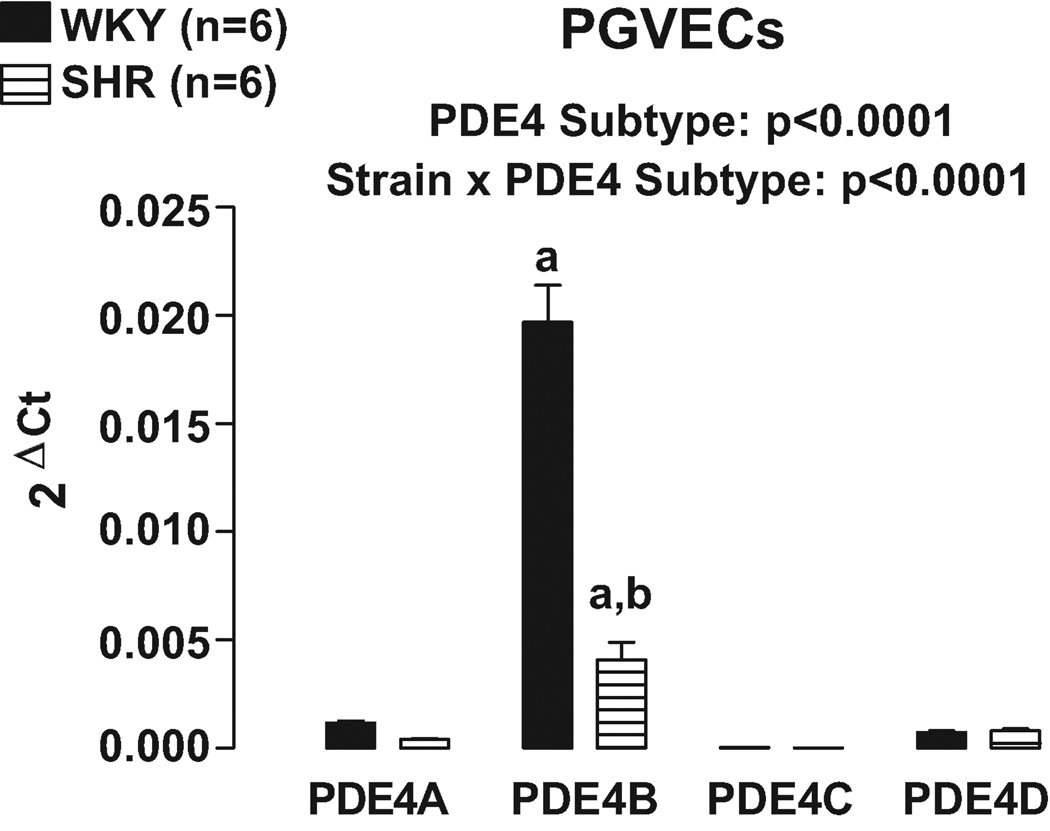
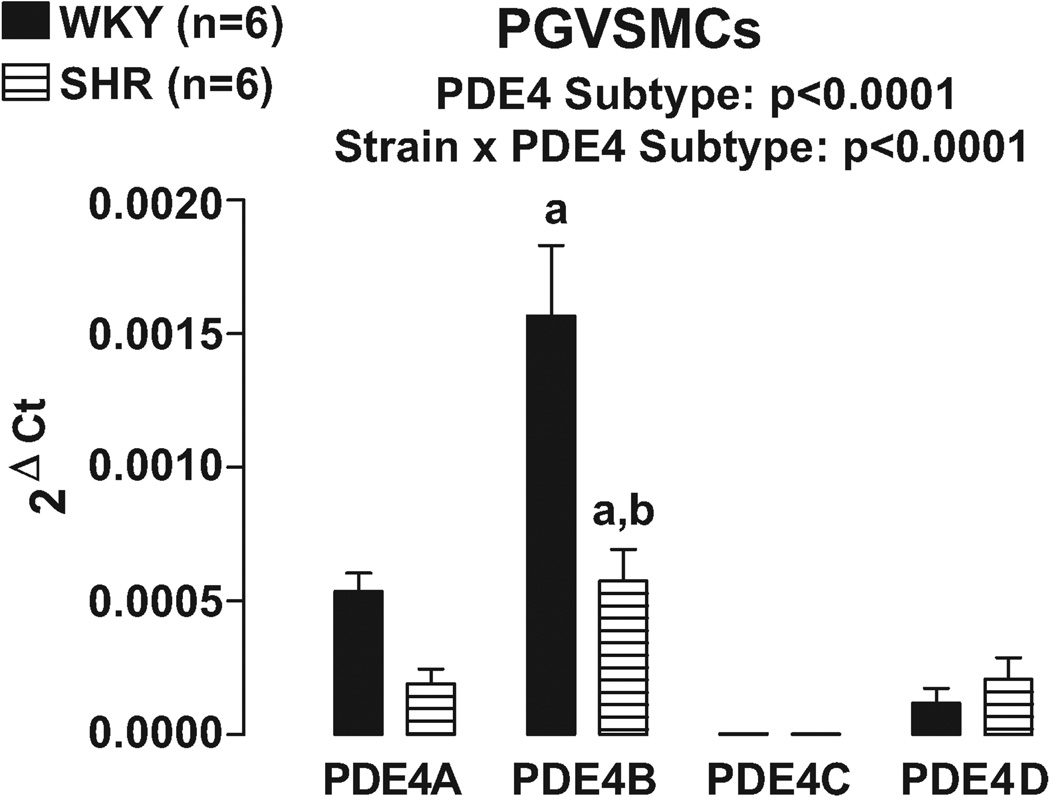
Real time PCR using primers designed to differentially recognize PDE4A, PDE4B, PDE4C and PDE4D revealed that PDE4B was clearly the most highly expressed PDE4 subtype in both PGVECs (Figure 5) and PGVSMCs (Figure 6). Moreover, in both PGVECs and PGVSMCs the expression of PDE4 subtypes was strain dependent (p<0.0001; strain×PDE4 subtype interaction in 2F-ANOVA). Specific post hoc comparisons indicated that in both PGVECs and PGVSMCs derived from both WKY and SHR, the expression of PDE4B was significantly greater (p<0.05) compared with the expression of PDE4A, PDE4C and PDE4D. Also, in both PGVECs and PGVSMCs, the expression of the dominant PDE4B subtype was less in SHR compared with WKY (p<0.05).
Figure 5.
Bar graph illustrates real time PCR results for the expression of PDE4 gene subtypes in preglomerular vascular endothelial cells (PGVECs). a, Indicates p<0.05 compared with all other subtypes within a corresponding strain. b, Indicates p<0.05 compared with corresponding WKY subtype.
Figure 6.
Bar graph illustrates real time PCR results for the expression of PDE4 gene subtypes in preglomerular vascular smooth muscle cells (PGVSMCs). a, Indicates p<0.05 compared with all other subtypes within a corresponding strain. b, Indicates p<0.05 compared with corresponding WKY subtype.
To confirm that the PDE4B subtype was indeed active in PGVSMCs, cells were treated for 72 hours with PDE4B siRNA or non-targeting siRNA. PDE4B mRNA levels were decreased by 50% (p<0.05) in PDE4B siRNA-treated versus non-targeting siRNA-treated cells. In SHR PGVSMCs treated with non-targeting siRNA, isoproterenol increased 3’,5’-cAMP by 242 ± 26 pg/µg protein (n=5); however, in SHR PGVSMCs treated with PDE4B siRNA, isoproterenol increased 3’,5’-cAMP by 416 ± 41 pg/µg protein (n=5).
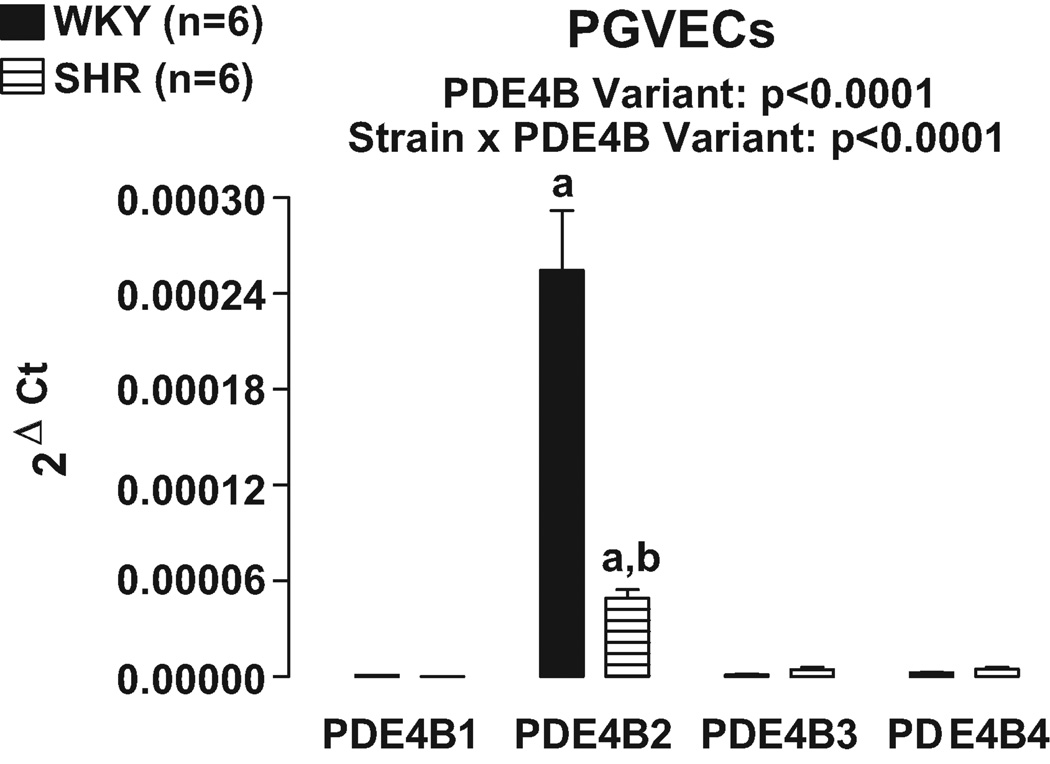
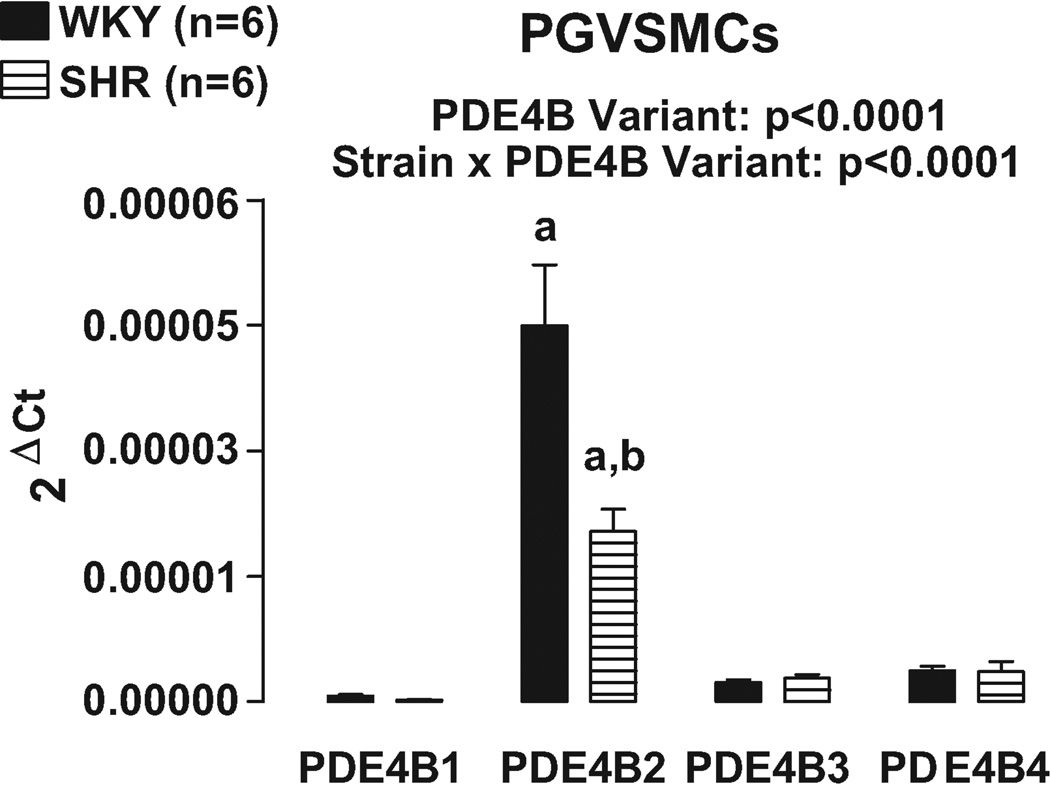
At present, studies have identified 5 different variants of PDE4B16. Real time PCR was conducted using primers designed to recognize the 5 specific variants of PDE4B. Variant PDE4B5 could not be detected. Real time PCR revealed that PDE4B2 was the most highly expressed PDE4B variant in both PGVECs (Figure 7) and PGVSMCs (Figure 8). Consistent with the results of our PDE4 subtype studies, in both PGVECs and PGVSMCs the expression of PDE4B variants was strain dependent (p<0.0001; strain×PDE4B variant interaction in 2FANOVA). Post hoc comparisons indicated that in both PGVECs and PGVSMCs derived from both WKY and SHR, the expression of PDE4B2 was significantly greater (p<0.05) compared with the expression of PDE4B1, PDE4B3 and PDEB4. Also, in both PGVECs and PGVSMCs, the expression of the dominant PDE4B2 variant was less in SHR compared with WKY (p<0.05).
Figure 7.
Bar graph illustrates real time PCR results for the expression of PDE4B variants in preglomerular vascular endothelial cells (PGVECs). The PDE4B5 variant could not be detected. a, Indicates p<0.05 compared with all other variants within a corresponding strain. b, Indicates p<0.05 compared with corresponding WKY variant.
Figure 8.
Bar graph illustrates real time PCR results for the expression of PDE4B variants in preglomerular vascular smooth muscle cells (PGVSMCs). The PDE4B5 variant could not be detected. a, Indicates p<0.05 compared with all other variants within a corresponding strain. b, Indicates p<0.05 compared with corresponding WKY variant.
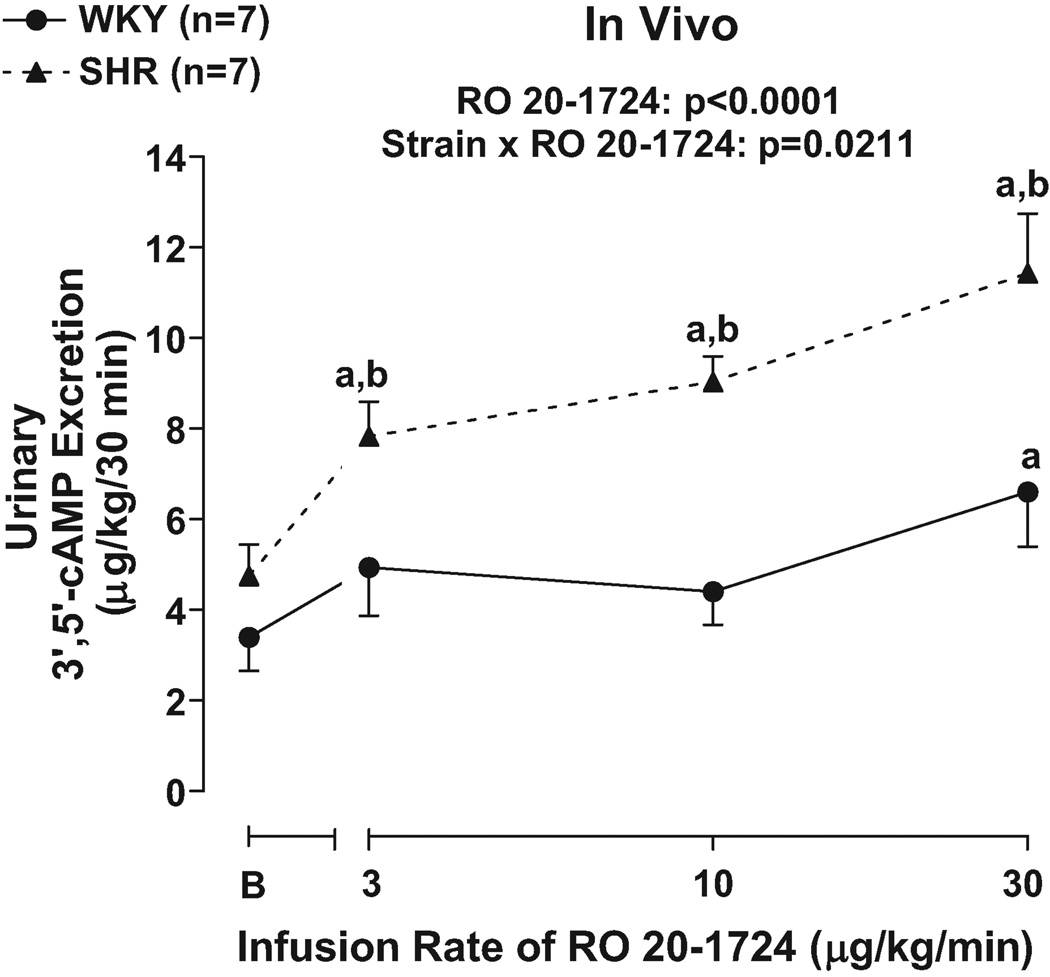
To determine whether our in vitro studies could be extrapolated to the in vivo situation, we examined the effects of infusions of RO 20–1724 on the urinary excretion of 3’,5’-cAMP. Although basal levels of urinary 3’,5’-cAMP excretion were similar in SHR versus WKY, RO 20–1724 increased urinary 3’,5’-cAMP excretion to a greater extent in SHR compared with WKY (p=0.0211; strain×RO 20–1724 interaction in 2F-ANOVA; Figure 9). Post hoc contrasts indicated that RO 20–1724 significantly (p<0.05) increased urinary 3’,5’-cAMP at 3, 10 and 30 µg/kg/min in SHR, but only at 30 µg/kg/min in WKY. The urinary 3’,5’-cAMP excretion was greater in SHR compared with WKY at every dose of RO 20–1724.
Figure 9.
Line graph illustrates dose-dependent effects of RO 20–1724, a selective PDE4 inhibitor, on urinary excretion of 3’,5’-cAMP in 16 weeks-of-age SHR versus WKY. B, Indicates basal values before infusion of RO 20–1724. a, Indicates p<0.05 compared with respective basal levels. b, Indicates p<0.05 compared with corresponding value in WKY.
DISCUSSION
The main conclusion from the present experiments is that there is an increased coupling of β-adrenoceptors to adenylyl cyclase in SHR PGVSMCs, but the effect of this increased coupling on 3’,5’-cAMP levels is masked by concomitant increases in PDE activity in general and more specifically in PDE4 activity. Thus, broad-spectrum inhibition of PDE with IBMX or specific inhibition of PDE4 with RO 20–1724, a selective PDE4 inhibitor8, 9, increases 3’,5’-cAMP levels in SHR PGVSMCs and to a much greater extent than in WKY PGVSMCs. This result is not an artifact of insufficient concentrations of IBMX or RO 20–1724 because the result is the same over a concentration range of IBMX and RO 20–1724 and with maximally effective concentrations of these inhibitors. Importantly, the results with IBMX qualitatively and quantitatively mimic those of RO 20–1724. This implies that in PGVSMCs mainly PDE4 controls 3’,5’-cAMP levels; if other isoforms were involved, the maximum effects of IBMX would be larger than the maximum effects of RO 20–1724.
In contrast to SHR PGVSMCs, in SHR PGVECs there is neither increased coupling of β-adrenoceptors to adenylyl cyclase nor is there increased total PDE or PDE4 activity. Accordingly, broad-spectrum PDE inhibition with IBMX or selective inhibition of PDE4 with RO 20–1724 similarly increases 3’,5’-cAMP levels in SHR PGVECs compared with WKY PGVECs. Again, this result is not an artifact of insufficient concentrations of IBMX or RO 20–1724 because the results are the same over a concentration range of IBMX and RO 20–1724 and with maximally effective concentrations of these inhibitors.
Importantly, the results of the present study are entirely consistent with our previous findings that in isolated, perfused kidneys7 the ability of IBMX and RO 20–1724 to enhance isoproterenol-induced renal venous secretion of 3’,5’-cAMP is greater in kidneys from SHR compared with kidneys from WKY. In addition to providing important confirmation, the present results also extend our previous findings by identifying the vascular smooth muscle cell in the preglomerular microcirculation as the major cell type that contributes to the phenotype of the intact SHR kidney with regard to enhanced responsiveness to broad-spectrum PDE inhibition and PDE4 inhibition specifically. While identifying renovascular smooth muscle cells as contributing to enhanced responsiveness of the intact kidney to broad-spectrum PDE inhibition and specific PDE4 inhibition, our findings also rule out the vascular endothelial cell in the preglomerular microcirculation in this regard.
The results of the present study are also consistent with our previous observation that RO 20–1724 decreases renal vascular resistance in vivo and to a greater extent in SHR than in WKY7. In this regard, an important aspect of the present study is the urinary measurement of 3’,5’-cAMP before and during intravenous infusions of RO 20–1724. This experiment shows that administration of RO 20–1724 increases urinary 3’,5’-cAMP excretion to a greater extent in SHR than in WKY, a finding consistent with RO 20–1724 increasing renovascular levels of 3’,5’-cAMP more in SHR kidneys. Therefore, this would explain the greater renal hemodynamic response to RO 20–1724 in SHR7. As in the cell culture experiments and as with our previous studies in isolated, pefused kidneys, in the present study the effects of RO 20–1724 are greater in SHR over a dose range. A limitation of the in vivo experiments is that the source of urinary 3’,5’-cAMP cannot be unambiguously identified as arising from the renal microcirculation. Nonetheless, it is reassuring that the same results are obtainable in three different model systems: 1) intact isolated, perfused kidneys7; 2) isolated, cultured PGVSMCs; and 3) intact kidneys in vivo.
RO 20–1724 appears to be a specific PDE4 inhibitor and is not known to inhibit other PDE isoforms8, 9. In support of this conclusion, rolipram (a compound structurally nearly identical to RO 20–1724) does not inhibit PDE1, 2, 3, 5, 6, 7, 8, 9 and 11 even at concentrations of 0.1 mmol/L17. However, RO 20–1724 does not distinguish among the multiple PDE4 isoforms; indeed, presently no PDE4 inhibitors are available that block exclusively a specific PDE4 isoform. In this regard, there are 4 different PDE4 subtypes (PDE4A, PDE4B, PDE4C and PDE4D) with each subtype being encoded by a specific gene18 and being populated by a set of variants due to alternative mRNA splicing and alternative promoters16, 18. Our real time PCR results demonstrate that the dominant PDE4 mRNA subtype in both PGVSMCs and PGVECs is PDE4B. In support of this conclusion, we observe that siRNA knockdown of PDE4B greatly increases agonist-induced 3’,5’-cAMP levels in SHR PGVSMCs.
In rats, the PDE4B subtype is populated by 5 variants (PDE4B1, PDE4B2, PDE4B3, PDE4B4 and PDE4B5), and our results show that the dominant PDE4B mRNA variant in both PGVSMCs and PGVECs is PDE4B2. Tawar et al.16 report that Western blotting of total renal tissue with a polyclonal PDE4B antibody against the common carboxyl terminus of the PDE4B family detects only PDE4B4, and not the other PDE4B variants, and that rolipram-inhibitable 3’,5’-cAMP hydrolyzing activity in the renal cytosol increases in proportion to the total renal expression of phosphorylated PDE4B4. Because rolipram inhibits all forms of PDE4, these data suggest that PDE4B is the major PDE4 subtype in the kidney with the PDE4B4 variant being dominant. Thus our results are consistent with Tawar et al. with regard to PDE4B being the major PDE4 subtype in the kidney; however, at least in PGVSMCs and PGVECs, our results support the conclusion that PDE4B2 is the dominant PDE4B variant. The difference between our findings and the findings by Tawar et al. may be due to the fact that we measure PDE4B variant mRNA in specific renovascular cell types whereas they measure PDE4B variant protein in total renal tissue.
Our real time PCR measurements use mRNA as an index for gene expression, but do not directly measure protein levels of the PDE4B variants. We attempted to measure PDE4B variants in PGVSMCs and PGVECs by Western blotting using four different commercially available PDE4B antibodies (two for all variants of PDE4B, one for PDE4B2 and one for PDE4B4). None of the antibodies afforded bands with the predicted molecular weights of the variants. This too is consistent with the finding of Tawar et al. who report that PDE4B4 migrates as a 62 to 66 kDa band, which is substantially smaller that the calculated molecular weight of 75 kDa. In our opinion, the currently available PDE4B antibodies are not of sufficient quality to reliably investigate the protein expression of PDE4B variants using Western blotting. Nonetheless, the expression of mRNA is so strikingly greater for PDE4B2 compared with the other PDE4B variants in both PGVSMCs and PGVECs that it would be surprising if PDE4B2 were not the dominant variant in these cell types.
A notable observation is that the expression of PDE4B and PDE4B2 mRNA is less, not more, in PGVSMCs from SHR. Although the reason for this is unclear, one possibility is that increased activity of PDE4B and more specifically PDE4B2 in SHR PGVSMCs results in feedback inhibition of PDE4B gene expression; however, this hypothesis cannot explain the results in SHR PGVECs. The results do suggest, however, that the increased activity of PDE4 in SHR PGVSMCs identified by pharmacological inhibition with RO 20–1724 is due to dysregulation of PDE4B (and perhaps more specifically PDE4B2) activity, rather than to dysregulation of PDE4B gene expression.
Our results show that inhibiting PDE4 increases 3’,5’-cAMP levels in PGVECs approximately twice as much as in PGVSMCs on a protein-normalized basis. However, in our cell culture studies, the average protein content in the PGVEC culture wells was 38 micrograms; whereas the average protein content in the PGVSMC culture wells was 71 micrograms. Therefore, the monolayers of PGVSMCs were normalized by approximately 71 whereas the monolayers of PGVECs were normalized by approximately 38. Without normalization to protein, PGVSMCs would have responded to PDE inhibitors to approximately the same magnitude as PGVECs. Importantly, the endothelial lining of blood vessels is very thin, i.e., a single flat cell layer, and contributes vanishingly to the total weight of blood vessels. In contrast, smooth muscle cells are large, thick and long and form multi-layered structures in the vascular wall and therefore contribute orders of magnitude more to the total weight of blood vessels compared to the endothelium. Therefore, on an absolute basis, smooth muscle cells would contribute much more to the total 3’,5’-cAMP levels in blood vessels. Finally, in terms of vasodilation, 3’,5’-cAMP vasodilates by activating signaling processes within smooth muscle cells. Therefore, increases in 3’,5’-cAMP within vascular smooth muscle cells would have a much greater effect on vascular tone than increases in 3’,5’-cAMP within endothelial cells.
Perspective
Our results continue to support the hypothesis that in the renal vasculature of kidneys from genetically-hypertensive animals there is increased activity of PDE4 that limits vascular levels of 3’,5’-cAMP in response to agonist-induced activation of adenylyl cyclase. The current study shows that this defect resides in the vascular smooth muscle cells of the renal microcirculation and is likely mediated by PDE4B (and perhaps more specifically PDE4B2). This implies that selective inhibition of PDE4B (and perhaps more specifically PDE4B2) in the kidney could be a useful strategy to increase 3’,5’-cAMP levels in renal vascular smooth muscle cells and thereby increase renal blood flow and enhance renal function in genetic hypertension. Moreover, because 3’,5’-cAMP inhibits vascular smooth muscle cell proliferation and migration19, selectively inhibiting PDE4B (or perhaps more specifically PDE4B2) could prevent hypertension-induced pathological remodeling in the renal vasculature and enhance renal function in genetic hypertension. Importantly, very recent studies by Shahid and co-workers20 published in Hypertension underscore the concept that manipulating 3’,5’-cAMP levels in vascular smooth muscle profoundly affects long-term levels of arterial blood pressure. In this regard, Shahid et al. demonstrate that in IEX-1 knockout mice hypertension arises primarily from impaired production of and signaling by 3’,5’-cAMP in vascular smooth muscle cells. Thus it is likely that selective inhibitors of PDE4B (or perhaps more specifically PDE4B2) that increase vascular 3’,5’-cAMP would be a new class of antihypertensive drugs.
Acknowledgments
Sources of Funding: NIH grants HL69846, DK068575 and DK079307.
Footnotes
Publisher's Disclaimer: This is a PDF file of an unedited manuscript that has been accepted for publication. As a service to our customers we are providing this early version of the manuscript. The manuscript will undergo copyediting, typesetting, and review of the resulting proof before it is published in its final citable form. Please note that during the production process errors may be discovered which could affect the content, and all legal disclaimers that apply to the journal pertain.
Disclosures: None
REFERENCES
- 1.Heuze-Joubert I, Mennecier P, Simonet S, Laubie M, Verbeuren TJ. Effect of vasodilators, including nitric oxide, on the release of cGMP and cAMP in the isolated perfused rat kidney. Eur J Pharmacol. 1992;220:161–171. doi: 10.1016/0014-2999(92)90744-o. [DOI] [PubMed] [Google Scholar]
- 2.Purdy KE, Arendshorst WJ. EP(1) and EP(4) receptors mediate prostaglandin E(2) actions in the microcirculation of rat kidney. Am J Physiol Renal. 2000;279:F755–F764. doi: 10.1152/ajprenal.2000.279.4.F755. [DOI] [PubMed] [Google Scholar]
- 3.Sandner P, Kornfeld M, Ruan X, Arendshorst WJ, Kurtz A. Nitric oxide/cAMP interactions in the control of rat renal vascular resistance. Circ Res. 1999;84:186–192. doi: 10.1161/01.res.84.2.186. [DOI] [PubMed] [Google Scholar]
- 4.Journal of Pharmacology & Experimental Therapeutics. Chatziantoniou C, Ruan X, Arendshorst WJ. Interactions of cAMP-mediated vasodilators with angiotensin II in rat kidney during hypertension. Am J Physiol. 1993;265:F845–F852. doi: 10.1152/ajprenal.1993.265.6.F845. [DOI] [PubMed] [Google Scholar]
- 5.Ruan X, Chatziantoniou C, Arendshorst WJ. Impaired prostaglandin E(2)/prostaglandin I(2) receptor-G(s) protein interactions in isolated renal resistance arterioles of spontaneously hypertensive rats. Hypertension. 1999;34:1134–1140. doi: 10.1161/01.hyp.34.5.1134. [DOI] [PubMed] [Google Scholar]
- 6.Chatziantoniou C, Ruan X, Arendshorst WJ. Defective G protein activation of the cAMP pathway in rat kidney during genetic hypertension. Proc Natl Acad Sci USA. 1995;92:2924–2928. doi: 10.1073/pnas.92.7.2924. [DOI] [PMC free article] [PubMed] [Google Scholar]
- 7.Jackson EK, Mi Z. Regulation of renovascular adenosine 3',5'-cyclic monophosphate in spontaneously hypertensive rats. Hypertension. 2009;54:270–277. doi: 10.1161/HYPERTENSIONAHA.109.130542. [DOI] [PMC free article] [PubMed] [Google Scholar]
- 8.Beavo JA, Reifsnyder DH. Primary sequence of cyclic nucleotide phosphodiesterase isozymes and the design of selective inhibitors. Trends Pharmacol Sci. 1990;11:150–155. doi: 10.1016/0165-6147(90)90066-H. [DOI] [PubMed] [Google Scholar]
- 9.Dousa TP. Cyclic-3'5'-nucleotide phosphodiesterase isozymes in cell biology and pathophysiology of the kidney. Kidney Int. 1999;55:29–62. doi: 10.1046/j.1523-1755.1999.00233.x. [DOI] [PubMed] [Google Scholar]
- 10.Jackson EK, Mi Z. Preglomerular microcirculation expresses the cAMP-adenosine pathway. Pharmacol Exp Ther. 2000;295:23–28. [PubMed] [Google Scholar]
- 11.Dubey RK, Gillespie DG, Jackson EK. Cyclic AMP-adenosine pathway induces nitric oxide synthesis in aortic smooth muscle cells. Hypertension. 1998;31:296–302. doi: 10.1161/01.hyp.31.1.296. [DOI] [PubMed] [Google Scholar]
- 12.Goldman SJ, Dickinson ES, Slakey LL. Effect of adenosine on synthesis and release of cyclic AMP by cultured vascular cells from swine. J Cyclic Nucleotide Protein Phosphor Res. 1983;9:69–78. [PubMed] [Google Scholar]
- 13.Mokkapatti R, Vyas SJ, Romero GG, Mi Z, Inoue T, Dubey RK, Gillespie DG, Stout AK, Jackson EK. Modulation by angiotensin II of isoproterenol-induced cAMP production in preglomerular microvascular smooth muscle cells from normotensive and genetically hypertensive rats. J Pharmacol Exp Ther. 1998;287:223–231. [PubMed] [Google Scholar]
- 14.Frye CA, Patrick CW., Jr Isolation and culture of rat microvascular endothelial cells. In Vitro Cell Dev Biol Anim. 2002;38:208–212. doi: 10.1290/1071-2690(2002)038<0208:IACORM>2.0.CO;2. [DOI] [PubMed] [Google Scholar]
- 15.Jackson EK, Ren J, Mi Z. Extracellular 2',3'-cAMP is a source of adenosine. J Biol Chem. 2009;284:33097–33106. doi: 10.1074/jbc.M109.053876. [DOI] [PMC free article] [PubMed] [Google Scholar]
- 16.Tawar U, Kotlo K, Jain S, Shukla S, Setty S, Danziger RS. Renal phosphodiesterase 4B is activated in the Dahl salt-sensitive rat. Hypertension. 2008;51:762–766. doi: 10.1161/HYPERTENSIONAHA.107.105387. [DOI] [PubMed] [Google Scholar]
- 17.Marte A, Pepicelli O, Cavallero A, Raiteri M, Fedele E. In vivo effects of phosphodiesterase inhibition on basal cyclic guanosine monophosphate levels in the prefrontal cortex, hippocampus and cerebellum of freely moving rats. J Neurosci Res. 2008;86:3338–3347. doi: 10.1002/jnr.21788. [DOI] [PubMed] [Google Scholar]
- 18.Omori K, Kotera J. Overview of PDEs and their regulation. Circ Res. 2007;100:309–327. doi: 10.1161/01.RES.0000256354.95791.f1. [DOI] [PubMed] [Google Scholar]
- 19.Houslay MD, Baillie GS, Maurice DH. cAMP-Specific phosphodiesterase-4 enzymes in the cardiovascular system: a molecular toolbox for generating compartmentalized cAMP signaling. Circ Res. 2007;100:950–966. doi: 10.1161/01.RES.0000261934.56938.38. [DOI] [PubMed] [Google Scholar]
- 20.Shahid M, Shen L, Seldin DC, Lu B, Ustyugova IV, Chen X, Zapol WM, Wu MX. Impaired 3',5'-cyclic adenosine monophosphate-mediated signaling in immediate early responsive gene X-1–deficient vascular smooth muscle cells. Hypertension. 2010 doi: 10.1161/HYPERTENSIONAHA.110.154880. [DOI] [PMC free article] [PubMed] [Google Scholar]


