

Abstract
Structural biology now plays a prominent role in addressing questions central to understanding how excitable cells function. Although interest in the insights gained from the definition and dissection of macromolecular anatomy is high, many neurobiologists remain unfamiliar with the methods employed. This primer aims to help neurobiologists understand approaches for probing macromolecular structure and where the limits and challenges remain. Using examples of macromolecules with neurobiological importance, the review covers X-ray crystallography, electron microscopy (EM), small-angle X-ray scattering (SAXS), and nuclear magnetic resonance (NMR) and biophysical methods with which these approaches are often paired: isothermal titration calorimetry (ITC), equilibrium analytical ultracentifugation, and molecular dynamics (MD).
Introduction
Since the time of Ramon y Cajal, neurobiologists have appreciated the value in understanding the intimate connection between the structure and function of biological systems. The power to visualize the architecture of different types of neurons in the brain has been indispensable for deciphering the inner workings of what may be the most complex biological system in the universe. More recently, the importance of architecture at a different scale has emerged in addressing questions that are central to how neurons function, the anatomy of macromolecules. In particular, it is the anatomy of proteins such as ion channels, cell surface receptors, transporters, pumps, and synaptic proteins that has grabbed neurobiologists' attention.
While there is great interest in the information revealed by structural biology, many neurobiologists are likely to be unfamiliar with the details of the approaches, the interpretation of the data, and most importantly, the limitations of the biophysical methods used to define and dissect macromolecular structure. The determination of a macromolecular structure empowers one to understand and affect biological processes in a way that is unparalleled and brings clarity to diverse lines of investigation that range from mechanistic studies to drug development. In light of the revelatory nature of macromolecular structures, this primer aims to help the structural biology novice understand the basics of protein structure determination so that he or she can critically assess the published data and, more importantly, understand how to employ the results in his or her own research.
The discipline of structural biology has origins in the same half of the 20th century that brought the initial understanding of action potentials (Dickerson, 2005; Perutz, 1997). The transforming notion was that biology is molecular at its root and must be understood in the language of molecules and physical chemistry (Dickerson, 2005). Despite the permeation of this notion into all domains of biological science, the real power of structural approaches for addressing questions of central importance to neuroscience only emerged in the late 1990s. This delay was not due to a lack of desire or appreciation of the power of the approach, but rather to practical matters. Many of the macromolecules that interest neurobiologists reside in or work at the cell membrane and may exist in very limited numbers in a cell. Such molecules carry special challenges. From cloning to structural studies, many steps in understanding them at the molecular level have come late relative to progress in other areas of biology such as DNA replication and transcription. The recent accelerated progress and increasing number of high-resolution structural models for molecules with direct importance for neuroscience (Table 1) offers an opportune moment to outline how the beautiful molecular structures are uncovered, what they tell us about function, and why understanding macromolecular structure brings deep insight that has implications for questions asked in areas that range from protein biophysics to neurological disease.
Table 1. Key High-Resolution Structures with Relevance for Neurobiologists: Channels, Transporters, and Receptors.
| Resolutiona | Reference | ||
|---|---|---|---|
| Ligand-gated ion channels: whole channels | Torpedo marmorata nicotinic acetylcholine receptor | 4.0 Å | Miyazawa et al., 2003 |
| Ligand-gated ion channels: extracellular domains | Mollusc AChBPs | ||
| Limnea stagnalis AChBP | 2.7 Å | Brejc et al., 2001 | |
| Limnea stagnalis AChBP: conotoxin complex | 2.4 Å | Celie et al., 2005a | |
| Limnea stagnalis AChBP: carbamoylcholine and nicotine complexes | 2.2 Å | Celie et al., 2004 | |
| Glutamate receptors: extracellular domains | |||
| AMPA (GluR2) | 1.9 Å | Armstrong et al., 1998 | |
| AMPA (GluR2): agonist, antagonist, and modulator complexes | 2.1 Å | Sun et al., 2002 | |
| Kainate R (GluR5): antagonist complexes | 1.74 Å | Mayer et al., 2006 | |
| Kainate R (GluR6): agonist complexes | 1.65 Å | Mayer, 2005a | |
| NMDAR (NR1/NR2A heteromer) | 1.88 Å | Furukawa et al., 2005 | |
| Potassium channels: whole channels | Rat Kv1.2/Kvβ complex | 2.9 Å | Long et al., 2005 |
| Archaeal voltage-gated channel KvAP | 3.2 Å | Jiang et al., 2003 | |
| Bacterial potassium channel: KcsA | 2.0 Å | Zhou et al., 2001 | |
| Bacterial potassium channel MthK | 3.3 Å | Jiang et al., 2002 | |
| Bacterial inward rectifier KirBac1.1 | 3.65 Å | Kuo et al., 2003 | |
| Bacterial nonselective cation channel NaK | 2.4 Å | Shi et al., 2006 | |
| Potassium channel intracellular domains and regulatory complexes | Kv4.3/KChIP1 complex | 3.2 Å |
Pioletti et al., 2006; Wang et al., 2007 |
| Kir3.1 intracellular domain | 1.8 Å | Nishida and MacKinnon, 2002 | |
| HERG PAS domain | 2.6 Å | Morais Cabral et al., 1998 | |
| SK channel intracellular domain: Ca2+/CaM complex | 1.6 Å | Schumacher et al., 2001 | |
| Voltage-gated calcium channels: intracellular domains | CaVβ and CaVβ-AID complex | 2.0 Å |
Chen et al., 2004; Opatowsky et al., 2004; Van Petegem et al., 2004 |
| Ca2+/CaM-CaV1.2 IQ domain complex | 2.0 Å |
Fallon et al., 2005; Van Petegem et al., 2005 |
|
| Cyclic nucleotide gated channels | HCN2 Cyclic nucleotide binding domain/cAMP | 2.0 Å | Zagotta et al., 2003 |
| HCN2 Cyclic nucleotide binding domain/cGMP | 1.9 Å | Zagotta et al., 2003 | |
| TRP Channels | N-terminal Ankyrin repeat domain TRPV2 | 1.6 Å |
Jin et al., 2006; McCleverty et al., 2006 |
| TRPM7 kinase domain | 2.4 Å | Yamaguchi et al., 2001 | |
| Chloride channels: whole channel | Bacterial chloride channel | 3.0 Å | Dutzler et al., 2002 |
| Chloride channel intracellular domains | Human ClC-5 CBS domain (ATP and ADP) | 2.3 Å | Meyer et al., 2007 |
| Ca2+ ATPase | No nucleotide, with calcium | 2.6 Å | Toyoshima et al., 2000 |
| Magnesium fluoride | 2.3 Å | Toyoshima et al., 2004 | |
| G protein-coupled receptors | Rhodopsin | 2.8 Å | Palczewski et al., 2000 |
| G protein-coupled receptors: extracellular domains | mGluR1 ligand binding domain: apo and gluatmate complex | 2.2 Å | Kunishima et al., 2000 |
| mGluR1 ligand binding domain: antagonist complex | 3.3 Å | Tsuchiya et al., 2002 | |
| Amino acid transporters | Archaeal glutamate transporter | 3.5 Å | Yernool et al., 2004 |
| Archaeal asparate transporter | 1.65 Å | Yamashita et al., 2005 |
Where multiple similar structures are solved, the highest resolution obtained is indicated.
Why Structures?
Proteins are linear amino acid heteropolymers that have an exact amino acid sequence defined by the gene sequence. The amino acid sequence determines the 3D protein structure, the integrity of which is absolutely essential to its function (Petsko and Ringe, 2003). The transformation of information from the one-dimensional (1D) amino acid sequence into a 3D structure with properties that are defined in space and time animates genomic information into the cellular components that give living systems their unique properties. Because of this central link, structure determination reveals an unparalleled view into the design principles of living systems at levels that span from basic mechanistic questions regarding protein function to the evolutionary relationships between cellular components.
How is it then that one transforms the idea of determining a protein structure into the achievement of determining an actual structure? Here, I outline the basic methods used to derive structural information. These include X-ray crystallography, electron microscopy (EM), small-angle X-ray scattering (SAXS), and nuclear magnetic resonance (NMR) spectroscopy (Table 2), as well as the protein biophysical tools with which they are frequently paired (titration calorimetry, analytical ultracentrifugation, and molecular dynamics [MD]). For each case I consider the advantages, disadvantages, and points of technical challenge. I treat the X-ray crystallographic approach in greater depth because it routinely yields the highest-resolution data and is likely to remain the most prominent approach. Throughout the primer I have picked illustrative examples from different areas of neuroscience, but given the wide range of relevant structures now available, it is impossible to be comprehensive. There is a bias toward ion channel examples that only reflects the author's area of greatest familiarity and the fact that this area has seen a great deal of recent, notable advances.
Table 2. Comparison of the Basic Structure Determination Methods.
| Atomic resolution possible? | Typical resolution ranges | Size ranges | Resolvable features | Limitations | Minimal amount of sample required | Dynamic information | |
|---|---|---|---|---|---|---|---|
| X-ray diffraction | yes | 1.5–4 Å | from short peptides to MDa complexes and icosahedral viruses | atoms, secondary, tertiary, and quaternary structure | requires crystals, stringent purity | 100–500 μl of 5–30 mg ml−1 | ordered versus disordered regions |
| Single-particle EM | no | negative stain limited to ∼20 Å; particles in ice, ∼10 Å | proteins >250 kD (negative stain); >400 kD (particles in ice) | domain organization | limited resolution | ∼100 μl of 0.1 mg ml−1 | can image multiple conformations from one sample |
| Electron diffraction | yes | 1.5–7 Å | 15–250 kD | atoms, secondary, tertiary, and quaternary structure | requires 2D crystals or helical tubes | ∼100 μl of 1 mg ml−1 | ordered versus disordered regions |
| SAXS | no | 10–20 Å | 10 kD to 0.6 MDa | domain organization | limited resolution | 100 μl of 5–30 mg ml−1 | no |
| NMR | Yes | 1.5–3 Å for backbone atoms | limited to <∼40 kDa | atoms, secondary, tertiary, and quaternary structure | sample molecular weight | 100–500 μl of 5–30 mg ml−1 | atom-specific dynamics can be measured |
X-Ray Crystallography: From Idea to Structure
X-ray crystallography has unsurpassed power to resolve the 3D configuration of amino acids within proteins and protein complexes and is the only method that can routinely reach atomic resolution. Figure 1 shows a flow chart of the basic steps. Technological advances have brought many improvements to instrumentation, sample preparation, data collection, and data processing strategies; however, the central methods and mathematical approaches that were developed to solve the first protein structures, myoglobin and hemoglobin (Dickerson, 2005; Perutz, 1997), still form the core of the methodology that is in use today. The prerequisite for determining a protein structure by X-ray crystallography is a good supply of crystals of the protein or protein complex of interest. Thus, the first thing to consider is how to crystallize a protein.
Figure 1. Idea to Structure Flowchart.
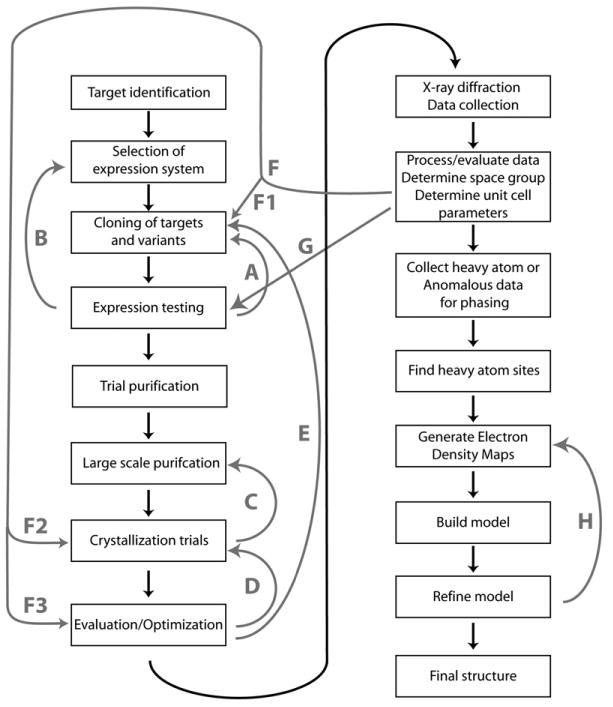
Basic steps of the process in solving a protein X-ray crystal structure are shown. Gray arrows show processes that are often iterated. (Step A) Optimization of constructs following outcome of expression tests. (Step B) Test of different expression hosts. (Step C) Crystal growth screening. (Step D) Crystal growth optimization. (Step E) Construct optimization to improve crystals. (Steps F and F1) Construct optimization to improve diffraction; (step F2), search for new crystallization or cryoprotectant conditions; (step F3) heavy atom soaks. (Step G) Production of selenomethionine-labeled protein for MAD and SAD experiments. (Step H) Building and refinement cycle for refining structure.
The Importance of Being a Good Biochemist
To make a serious attempt at crystallization, or, for that matter, any of the structural methods outlined in this primer, one needs to have a reasonable amount of pure protein. What do “reasonable” and “pure” mean to a structural biologist? A good-sized protein crystal for structure determination (0.2 mm × 0.2 mm × 0.2 mm) has ∼1013 molecules (∼1 μg of protein if the crystallized protein is 50 kDa). Like many things in life, more is better. The more material one has, the easier it is to purify and the more diverse the conditions are that can be searched for crystallization. In order to define crystallization conditions and grow crystals for structure determination, one would ideally like to have at least 2 mg or more of pure protein or protein complex concentrated to 5–30 mg ml−1. The requirement for obtaining such quantities of material remains one of the major hurdles in structure determination. This restriction is a dominant reason why structural studies of proteins of particular interest to neuroscientists, such as ion channels, receptors, and transporters, remain great challenges. Presently, there are ∼40,000 unique structures of soluble proteins in the protein database (Berman et al., 2000). Contrast that number with the ∼100 membrane protein structures, of which only 12 are of eukaryotic origin (White, 2007; Striebeck, 2006), and one gets a sense of how much we still need to learn about membrane proteins.
In the early days of protein crystallographic studies, protein crystallographers worked on proteins that could be obtained in large quantities from natural sources, usually from cow and pig organs and blood procured from local slaughterhouses. The advances in molecular cloning in the 1980s and 1990s precipitated an important change: newly developed bacterial expression systems, principally those using E. coli, allowed the structural biologist to produce proteins that had once been extremely rare in native sources in the quantities required for structural work. It is now routine for structural biology projects to start with the definition of a good heterologous expression system that can produce large amounts of properly folded target protein. The power of genetic engineering that accompanies the use of heterologous expression systems provides the researcher with exquisite control over the precise boundaries of the construct under investigation and permits the inclusion of a wide range of special, cleavable, high-affinity tags, such as polyhistidine tags, that facilitate purification (Waugh, 2005). Presently, E. coli remains the expression system of choice because of its relative ease in handling, rapid growth, and low cost (Georgiou and Segatori, 2005; Terpe, 2006). Many types of bacterial expression plasmids have been developed and are readily obtained from major molecular biology suppliers such as Novagen and Invitrogen.
Many eukaryotic proteins cannot be made in bacterial systems in a functional form, particularly if the protein of interest requires some type of posttranslational modification, such as glycosylation, for proper folding and function. In some cases, it is possible to denature the misfolded protein and define conditions that permit the protein of interest to refold to into its native form; however, it is preferable to start with a protein that has folded into its native state in the host cell. As structural biologists get more interested in protein complexes, membrane proteins, and other difficult proteins, they are turning to eukaryotic systems as an alternative means of protein production (Aricescu et al., 2006a). Yeasts (S. cerevisae [Jidenko et al., 2005] and P. pastoris [Daly and Hearn, 2005; Macauley-Patrick et al., 2005]), insect cells (Aricescu et al., 2006a; Berger et al., 2004; Kost et al., 2005), and mammalian cells (Aricescu et al., 2006b) have all been used to make proteins for crystallization. Even though the expense is much greater than bacterial systems, there is a growing appreciation of the benefit of expressing a protein in a more native host (i.e., expressing eukaryotic proteins in eukaryotic cells) often being worth the extra cost and effort. The main disadvantage with all of the eukaryotic systems is that the turn-around time for testing constructs and redesigning the expression experiment (Figure 1, step A) is much longer than with bacterial systems due to the increased length of time required for cell growth and selection of transformants. Generally, a few weeks to a month are required to go from gene to protein in eukaryotic expression systems.
Besides giving careful consideration to the expression system, it is considered a wise strategy to begin a structure project by testing many isoforms, homologs, and variants of the protein or protein complex of interest in parallel in the early stages. This approach is beneficial because there is no way to predict which proteins will express well and purify cleanly. Small differences in amino acid composition can make the difference between a well-behaved crystallizable protein and one that will never crystallize. It involves more effort, but fortunately, the basic molecular biology and expression tests are easily done in parallel. It is not unreasonable to expect one person to make 10–100 constructs over the course of a week or so. The parallel approach can be even more powerful if one is able to test a few different expression systems simultaneously for the same constructs as there is no good way to predict the likelihood of success for any particular one (Figure 1, step B).
Many proteins function only as parts of larger complexes that are comprised of multiple types of subunits. Protein complexes provide an added challenge for expression. In many cases, one or all of the components may not fold properly if expressed in the absence of the others. If it is not possible to isolate the complex in structural biology quantities from native sources, the only option is to make all the components at the same time in the same expression host cell. As the interest in determining the structures of protein assemblies grows, there are serious efforts to develop robust coexpression approaches for bacterial and eukaryotic expression hosts (Fitzgerald et al., 2006; Romier et al., 2006). Such coexpression approaches have already proven essential for making the material for crystallographic study of a number of ion channel complexes (Long et al., 2005; Pioletti et al., 2006; Van Petegem et al., 2005; Wang et al., 2007). One serious challenge posed by complexes is that the number of variables to be tested increases with each protein component. One has many choices about which subunit combinations to coexpress and whether each needs to be optimized to find a biochemically well-behaved construct. The combinatorial nature of this problem leaves a pressing need to develop better cloning schemes that allow the facile mixing and matching of potential interaction partners and rapid testing for proper expression.
It is not just quantity, but also quality of material that is important for crystallization. Ideally, the crystallization subject must be chemically pure (McPherson, 1999). There should be one and only one type of macromolecule or complex in the tube. It should be folded into its native conformation and not contain covalent heterogeneity such as heterogeneous glycosylation or phosphorylation and mixtures of truncation products. Chemical purity can be assessed by gel electrophoresis, protein chromatography, and mass spectrometry (Geerlof et al., 2006; McPherson, 1999). Chemical purity, however, is not good enough. The sample must also be conformationally pure. Structural biologists typically will ask first whether the crystallization subject is a single species in solution. This is often done with size exclusion chromatography (see below) or with light scattering measurements (Ferre-D'Amare and Burley, 1994; Folta-Stogniew and Williams, 1999; Wen et al., 1996; Wilson, 2003) that can test whether there are large aggregates or multiple aggregation states in the sample. Such heterogeneity generally prohibits crystallization and indeed can pose a serious problem for all of the methods covered in this primer. Many proteins have regions that are well ordered and regions that are not well ordered, such as loops or disordered regions at the N and C termini. This type of structural heterogeneity is particularly common in eukaryotic proteins (Fink, 2005). Disordered loops and termini can interfere with crystallization. Bioinformatic analysis can be an important tool for identifying such problematic regions (Prilusky et al., 2005), as, generally, parts that are likely to be disordered are also poorly conserved (Dale et al., 2003). The final source of conformational heterogeneity may come from the intrinsic properties of the protein itself. Proteins need to move in order to function. Structural transitions can range from small movements, on the order of a few angstroms, to large conformational rearrangements that may be driven by a wide range of factors, such as ligand binding, voltage changes, or binding to a partner protein. In this regard, the more one knows about the protein of interest, the better. The inclusion of known substrates, binding partners, or inhibitors may be important for trapping the protein in one particular conformational state for crystallization. Conformational state trapping can also be done by the introduction of mutations that lock the protein in one state. This strategy was used successfully in the crystallization of the sugar transporter lacY (Abramson et al., 2003). Finally, the well-behaved ultrapure sample has to be concentrated. A good rule of thumb is to get the protein into the 5–30 mg ml−1 range. In general, the more concentrated the sample is, the better. Every protein is different, and not all subjects cooperate in the concentration step. If one has a difficult protein to concentrate, the best one can do is to make the sample as concentrated as possible and try to crystallize it.
What Happens Once the Biochemist Has the Tube Full of Purified, Concentrated Protein? How Do You Make Crystals?
Protein crystallization is a phase transition that has discrete steps of nucleation and growth (McPherson, 1999, 2004). The basic idea is to transfer the concentrated sample of the protein of interest into a solution of precipitants that will encourage crystal formation. Precipitants act by promoting the formation of intermolecular interactions, and each particular precipitant has unique effects on macromolecule hydration, molecular crowding, solubility, hydrophobic interactions, and electrostatics. Unfortunately, solution components that encourage proteins to crystallize are also prone to encourage the more common phenomenon of simple, amorphous precipitation. It is impossible to determine a priori which conditions, if any, will cause a protein or protein complex to crystallize. Many factors matter: precipitant type, pH, salt concentration, detergents, temperature, the inclusion of cofactors and ligands, etc., and as a result, they define a vast amount of chemical space that must be searched to find the right crystallization conditions for each protein or complex. In the face of a seemingly infinite number of variables paired with a limited supply of purified protein or protein complex, the only rational approach one can take is to screen the effects of sets of parameters in a way that coarsely samples the known sets of good protein crystallization agents (McPherson, 1999). Typically, crystallization screens focus on a limited set of concentrations of various sizes of polyethylene glycols (PEGs), alcohols, and salts that have been successful for protein crystallization in the past (McPherson, 1999, 2004; Radaev et al., 2006). The crystallization process is one of screening, optimization, and reiteration (Figure 1, steps C and D). The implementation of commercial protein crystallization screens such as those from Hampton Research, Wizard, and Nextal, together with microcrystallization robotics, has made it possible to test ∼1000 initial conditions routinely (Berry et al., 2006; Stock et al., 2005). There is even the possibility of having the screening done for free or for a nominal fee at a devoted protein crystallization center (HWI, 2007; Mueller-Dieckmann, 2006).
There are a variety of ways to set up the crystallization experiment (McPherson, 1999, 2004). Vapor diffusion is the most common approach. In this experiment the protein and precipitant are usually mixed in 1:1 proportion in volumes from 50 nl to 1 μl, depending on the type of instrumentation used, and then placed in a sealed chamber that contains a large volume relative to the drop of precipitant, which is called the mother liquor solution. The ensuing imbalance in vapor pressure slowly draws water from the protein/precipitant drop into the mother liquor and concentrates the protein solution. For crystallization to occur this process must lead to supersaturated protein solution, a nonequilibrium condition in which the protein is temporarily in solution in excess of its solubility limit. Formation of crystalline or amorphous precipitate reestablishes equilibrium. Crystals may form within a few hours or may require months, depending on the protein and particular conditions.
In the best case, one finds conditions that yield large, single crystals in the first crystallization screen. The more probable outcome is that one finds small crystals, crystalline material, just precipitate, or clear drops. The first two cases provide some indication that it should be possible to grow single crystals of the protein of interest. If there are promising hits, crystallization conditions can be refined by setting up secondary screens based on a finer search of chemical space around the initial conditions and by trying to improve the quality of the protein preparation (Figure 1, steps C and D). For example, if the screen shows crystalline material in 20% PEG 1000 over a pH range of 5–8, one might systematically vary the PEG concentration from 10%–30% versus pH in a follow-up screen or try other low molecular weight PEGs. When no crystals or crystalline material is found, it is best to follow the “don't fall in love with a single protein” dictum and to go back to the biochemical stage to test other constructs, homologs, and species variants (Figure 1, step E). The recognition that the protein is as important a variable as anything else originates in the genesis of the discipline when Perutz and Kendrew were trying to crystallize hemoglobin and myoglobin from various organisms (Perutz, 1997). The advantage of working with recombinant protein is that one has the power to make many types of modifications. For instance, one might undertake a systematic deletion of poorly conserved regions that are likely candidates for disorder (Dale et al., 2003).
Membrane Proteins: Not Impossible, but No Pain, No Gain
Membrane proteins are of particular importance to neuroscientists and the most challenging subject for structural determination by crystallographic methods (Wiener, 2004). In large part, the crystallization challenges stem from the following major issues: (1) Because the transmembrane part of the protein normally exists in a non-aqueous environment, there are special requirements for solubilizing the protein for purification and crystallization. To address this issue, biochemists use a wide range of detergents, only one or a few of which may work for a given crystallization target. This extra requirement adds a new complication and variation to the chemical space that must be searched. (2) Obtaining the material in sufficient quantities is a problem. Whether the protein is prokaryotic or eukaryotic, routine overexpression of membrane proteins remains a challenge (Wagner et al., 2006), and is particularly challenging for eukaryotic membrane proteins, of which only three structures to date have been determined from recombinantly produced material (Jidenko et al., 2005; Long et al., 2005; Tornroth-Horsefield et al., 2006). (3) There may be extra problems with context-dependent conformational sensitivities that arise from the protein being extracted from the constraints imposed by the membrane. The most striking example of the influence of the bilayer on conformation is at the heart of the recent debate surrounding the relevance of the crystallographically observed conformation of the voltage sensor in the bacterial voltage-gated potassium channel KvAP (Jiang et al., 2003; Lee et al., 2005; Tombola et al., 2006). In spite of all of these hurdles, membrane protein crystallization and structure determination is certainly possible. It has been more than 20 years since the first membrane protein structure was reported (Deisenhofer et al., 1985). Three websites keep up-to-date tallies of the latest membrane protein structural information (White, 2007; Striebeck, 2006; Raman et al., 2006). In terms of crystallization strategies for membrane proteins, there are some special methods that use lipid phases for membrane protein crystallization (Faham and Bowie, 2002; Nollert et al., 2002), but most of the successes to date have come from the application of the traditional crystallization methods. There is nothing impossible about crystallizing membrane proteins. It is just extremely hard.
If one is interested in membrane proteins, is that scientist confined to remain ignorant about the protein's structure while toiling on the all-or-nothing path structure determination? Thankfully, the answer is “No.” One fruitful shortcut is to exploit the property that many proteins are modular. This underlying biological fact permits one to dissect the problem by solving structures of extramembranous domains, which may be more readily dealt with than the membrane resident parts, and use the structures to inform functional experiments. This dissection approach is very powerful and has yielded great insights into both metabotropic (Kubo and Tateyama, 2005) and ionotropic (Mayer, 2005b) glutamate receptors, potassium channels (Roosild et al., 2004), calcium channels (Van Petegem and Minor, 2006), cyclic nucleotide gated channels (Craven and Zagotta, 2006), acetylcholine receptors (Sixma and Smit, 2003), and a large collection of cell surface receptors, such as neurotrophin receptors (Wiesmann and de Vos, 2001), LDL receptors (Jeon and Blacklow, 2005), and Nogo receptors (Vourc'h and Andres, 2004).
With the notable exceptions of the Kv1.2 potassium channel (Long et al., 2005) and the G protein-coupled receptor rhodopsin (Palczewski et al., 2000), the challenge of seeing the transmembrane segments has been met to date by turning to prokaryotic channels and transporters (Gouaux and Mackinnon, 2005). These proteins are often similar enough to their eukaryotic counterparts to reveal the central architecture of the protein family of interest, and are advantageous in that they are much more likely to express in large quantities in a heterologous system.
Once You Have Crystals of Your Protein, Does that Mean that Everything Is Straightforward?
The answer to this question is, unfortunately, “No!” A crystal can only diffract X-rays to atomic, or near atomic, resolution if it is ordered. Unlike mineral or small molecule crystals, protein crystals are mostly water (30%–80%). The lattice is held together by relatively weak interactions. This property can lead to crystals that are fragile, have internal disorder, or both, and consequently diffract X-rays poorly. There is no way to be certain from the outward appearance of the crystal. The only way to know is to put the crystal in an X-ray beam and measure the diffraction pattern. There are many textbooks that provide detailed descriptions of protein crystallography; here, I will just try to convey the basics of the method. For the reader interested in a more in-depth treatment, two good starting points are the books by Gale Rhodes (Rhodes, 2006) and David Blow (Blow, 2002).
In order to understand the basics of the X-ray diffraction experiment, it is important to define a few terms about how molecules are organized within the crystal lattice (Figure 2). Crystals are built from multiple copies of the same unit that are related to each other by simple translations in space. This repetitive unit is known as the unit cell. There are fourteen different types of unit cells (for example: cubes, prisms, and hexagons) in 3D crystals. Each particular unit cell type imposes constraints on the lengths and angles of the unit cell axes (Crystallography, 2002). The unit cell may contain a single copy of the protein or complex that has been crystallized, but more often than not, it contains many copies of the protein or complex that are related to each other by a set of rotations and translations, defined as the crystallographic symmetry. For protein crystals, there are 65 possible types of crystallographic symmetry, although an individual crystal will have only one type. For example, P222 denotes a space group in which there are three mutually perpendicular 2-fold axes of symmetry. Application of the crystallographic symmetry operations to the asymmetric unit, the fundamental repetitive unit of the unit cell (Figure 2A), builds the unit cell (Figure 2B). It is the asymmetric unit that the crystallographer determines in solving the structure. The asymmetric unit can be the biological unit, but is often not when the biological unit is built from symmetrically positioned protein chains such as in a homodimer or homotetramer. Upon publication, crystallographers deposit the coordinates that describe the asymmetric unit in the protein data bank, where they are freely available (Berman et al., 2000; http://www.pdb.org/, or PDB). Many users of the structures now include biochemists or cell biologists who may not be familiar enough with the crystallographic programs to make the biological unit from the deposited coordinates. Consequently, the PDB has also taken to including files that contain the biological unit. By the very nature of the crystal lattice, there have to be protein-protein interactions to form the crystal. Such contacts may reveal previously unappreciated interactions; for example, symmetry operations within the crystal may generate multimeric molecular assemblies. In all cases it is important for the crystallographer to figure out whether the apparent assembly and observed protein-protein interactions reflect an authentic assembly with biological significance or are simply interactions that are only critical for building the crystal lattice.
Figure 2. Anatomy of a Protein Crystal.
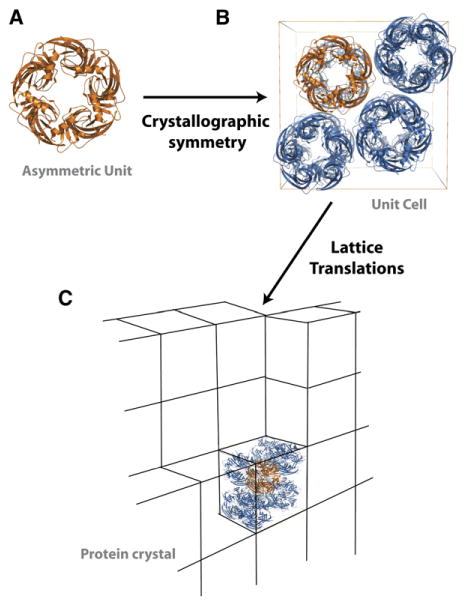
(A) Example of an asymmetric unit (AChBP). In this case the asymmetric unit is the same as the biological unit.
(B) Crystallographic symmetry operators applied to the asymmetric unit create the unit cell. Note that the AChBP pentamers in the upper right and lower left corners of the cell are in the opposite orientation of the orange pentamer.
(C) Translations of the unit cell build the protein crystal lattice.
X-rays are electromagnetic waves that have short wavelengths (angstroms, Å). The use of X-rays is essential because the features that need to be discerned are on the order of angstroms (0.1 nm or 10−10 m). For instance, the covalent distance between atoms is 1–2 Å and the distance between hydrogen bonds donors and acceptors is 2.5–3.5 Å. The best wavelength range for X-ray crystallography involves X-rays having wavelengths between 0.5–1.6 Å. These X-ray wavelengths are sufficient to penetrate samples of up to 1 mm thick, but are still strongly scattered by matter.
In contrast to the longer wavelengths of electromagnetic radiation with which a neurobiologist might be familiar, such as visible or near-ultraviolet light, it is not possible to focus the X-rays that are used for seeing atoms with a lens. This issue offers both a challenge and an advantage for how macromolecular structures are determined. In addition to wavelength, waves have two key properties, amplitude and phase. What is measured in an X-ray diffraction experiment is the intensity of the coherently scattered X-rays. The diffraction pattern is an array of “reflections” in which the pattern and spacing is set by the unit cell parameters (Figure 3). Each reflection carries information about the entire content of the asymmetric unit. There is an inverse relationship between the position of a reflection in a diffraction pattern and the resolution of the information. Low-resolution information is found near the center of the diffraction image, close to the position of the incident beam, while high-resolution data are found at larger scattering angles (Figure 3B). It is the presence and quality of the high-resolution reflections that determines the resolution limits of a given experiment. These limits are set by the quality of the internal order of the crystal. Once the crystal parameters (space group and unit cell size) are determined from the diffraction pattern, the crystallographer knows exactly where all the reflections at any resolution should be. Thus, it is straightforward to figure out to which resolution the crystal diffracts. As the scattered X-ray waves cannot be focused to reconstruct the image, other methods must be used to generate the phase information. Unlike the capture of an image on a 2D surface, such as our retinas or film in a camera, the fact that scattering from a crystal can be observed in all directions means that the ensuing data really represents a 3D image. It is not possible for one part of the protein to obscure the view of another.
Figure 3. Diffraction Experiment Schematic.
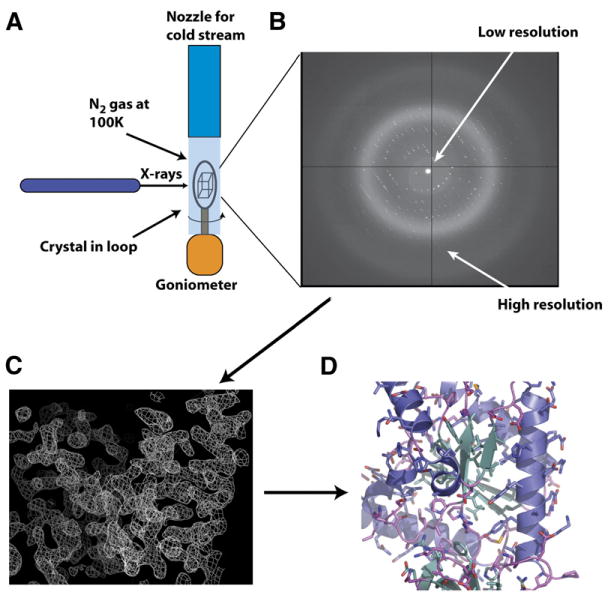
(A) Standard setup for data collection. The protein crystal is mounted on a goniometer (orange) and is frozen in a nylon loop. Incoming nitrogen gas at 100K maintains the frozen state of the crystal. X-rays emerge from a collimator on the X-ray source.
(B) Diffracted X-rays are collected on a detector. An example of an X-ray diffraction pattern is shown with low- and high-resolution data regions indicated. In the actual setup, the detector face is normal to the X-rays.
(C) Example of an initial electron density map at 2.0 Å with phases determined by selenomethionine MAD. A helix can be seen prominently on the right-hand side.
(D) Final refined model.
Cool Crystals
X-rays interact with the electrons in the sample, and when absorbed, set the electrons vibrating at the incident X-ray frequency. Two things can happen to this energy. A photon of the same energy and wavelength can be emitted in a random direction (coherent scattering). Alternatively, the absorbed energy may cause electronic transitions that result in the emission of one or more photons of lower energy (incoherent scattering). The first type of scattering is necessary to measure X-ray diffraction. The second causes radiation damage to the sample. Aside from the need for an ordered lattice to produce a diffraction pattern at high resolution, another reason for using crystals is that the interactions between X-rays and matter can destroy covalent bonds. The average crystal has ∼1013 copies of the molecule to be imaged, so damage to any individual copy is not so important. Successive damage and the generation of reactive species can destroy many copies in the lattice and lead to a degradation of the diffraction signal. Such signal deterioration is unfortunately not uncommon, and often crystals diffract well at the beginning of the experiment but lose diffraction power as the data collection proceeds. As with other issues where proteins are concerned, there is no way to know beforehand which crystals will be radiation sensitive and which will not. For these reasons, it is important to have more than one crystal for the diffraction experiment.
Presently, most data collection is done at synchrotron radiation sources. These X-ray sources provide a brilliant source that helps crystallographers squeeze the most data that they can out of their crystals. Most macromolecular crystals lose the ability to diffract X-rays within a few seconds of exposure to the high-intensity X-rays used at synchrotron radiation sources; in order to preserve the crystal from radiation damage, it must be flash frozen, usually at liquid nitrogen temperatures (Garman, 2003). The gains are great in both crystal lifetime and quality of data (Garman and Owen, 2006; Rodgers, 1994). It is estimated that ∼90% of all macromolecular crystallographic data collection is now done at 100K or lower (Garman and Owen, 2006). Data collection is done in a cryostream of nitrogen gas that keeps the crystal frozen throughout the experiment (Figure 3A). The freezing procedure is fast (milliseconds) (Kriminski et al., 2003) and is not likely to affect protein conformation in any major way. If it did, it would crack the crystal, and because the process is so fast it is extremely unlikely that there could be synchronous, identical structural rearrangements in all of the proteins in the lattice into some new conformation. Thus, even though the temperature of the experiment is far from biological, the protein conformation seen at the end of the structure solution process is one that was abundant under the conditions of the crystallization experiment. The fact that the crystal must be frozen adds another dimension to the screening process. Freezing must happen without the formation of ice crystals (which cause expansion and destroy the order in the lattice) and under conditions in which the water freezes as a glass. Thus, if the protein does not crystallize in conditions that includes good cryoprotectants, another search must be done in which the crystals are first soaked in various cryoprotectants (such as glycerol, alcohols, or low molecular weight PEGs) and then frozen (Figure 1, step F2) (McPherson, 1999; Rodgers, 1994). For some crystals, it is possible to transfer them into an oil, such as paratone oil, and freeze them directly so that the search for cryoprotectants is bypassed (McPherson, 1999).
Solutions to the Phase Problem
Electromagnetic waves are defined by a wavelength, phase, and amplitude. The fact that only the scattered intensities, which are related to the amplitude, of the X-rays can be measured means that something has to be done to get the information about the scattered X-rays' phases. This is known as the “phase problem” (Blow, 2002; Drenth, 1999; Rhodes, 2006; Taylor, 2003). The only relationship between the reflection amplitudes and the phases is through the molecular structure (formally, the electron density in the crystal). Thus, if we can learn something about the electron density of the asymmetric unit, we can obtain phase estimates and solve the structure.
There are three common ways employed to determine phases. The first way, which was used to solve the first protein structures in the 1960s, is to modify the protein in the crystal with a “heavy atom” such as a mercury or platinum complex. This is known as multiple isomorphic replacement (MIR). Because proteins are made of light atoms (C, H, O, N, S), the selective addition of a heavy atom or atoms with a large number of electrons (for example, Hg has 80 electrons) to precise binding sites on the protein causes perturbations to the intensities of the reflections in the diffraction pattern. As long as the modification does not alter the unit cell too much, a condition known as isomorphism, the intensity perturbations can be used to find the phases and locate the heavy atoms. This location provides the phase estimate for refinement and structure solution (see below). MIR requires a supply of many crystals that can be screened for derivatives. Just like the search for crystallization conditions, one does not know a priori which derivatives will be useful. Often derivatization alters the unit cell parameters in such a way that the isomorphism is not maintained. It is not uncommon for a lab to have a very nice native data set, but then spend a good deal of effort defining good, useable, isomorphous derivatives. Thus, even a diffracting crystal is not a guarantee of immediate success.
A second phase determination method basically incorporates the heavy atom directly into the protein. This requires the ability to overexpress the protein of interest and to substitute the sulfur atoms of the methionine residues with selenium atoms. It also requires a tunable X-ray source, generally provided by a synchrotron X-ray beamline. The incorporation of selenium allows a special type of experiment to be done in which data are collected at the wavelength at which the selenium atoms absorb X-rays as well as at wavelengths at which they do not. This sort of experiment is known as a multiwavelength anomalous dispersion or single wavelength anomalous dispersion (MAD or SAD, respectively) (Dauter et al., 2002; Dodson, 2003; Ealick, 2000). Differences in the intensities of the reflections allow one to locate the selenium atoms, just as similar differences allow the determination of heavy atom positions. The advantage over MIR is that the experiment can be done on a single crystal. MIR requires multiple crystals, and frequently the treatment of the crystals with the heavy atoms causes serious degradation in the diffraction quality. This issue is completely avoided with the MAD or SAD experiment.
Finally, the third common way to solve structures is by molecular replacement. This method takes advantage of the fact that the basic backbone architecture of many proteins of interest are similar to proteins or protein domains for which there are already high-resolution structures. For example, a scientist might be interested in examining a series of mutations to see how they perturb a structure or to see how drugs might bind and interact with a target. In general, for such approaches to work, the target and the model backbone atoms must be within ∼2.0 Å root mean squared deviation (RMSD). Model bias can be an issue, and generally, careful crystallographers use a number of means to make sure that such issues are minimized.
Solving and Refining a Structure
Once the phase problem has been solved, the crystallographer is faced with what many regard as the most enjoyable part, which is building the structure into electron density maps. In my opinion, this exercise is the best way to get a real sense for how proteins are put together. If the initial electron density maps are good, one can readily recognize protein structural features such as α helices, β sheets, side chains, and cofactors (Figure 3C). The procedure involves matching the covalent structure of the molecule (i.e., the protein sequence) with the density. How easy or how hard this step is depends on the resolution to which the crystals yield good data. Different protein structural features require different resolutions (Table 3). The definition of individual atoms requires data at 1.5 Å resolution or better. At ≤2.0 Å resolution, the electron density of individual side chains will be well enough resolved to define specific conformers. At 3.0 Å resolution or lower, major structural features such as α helices and β sheets are clearly distinguishable, but many side chains may not be resolved. Moreover, the electron density map may not be of uniform quality. Some parts of the protein may be poorly ordered and not visible at all. With high-resolution data (≤2.0 Å) interpretation is fairly straightforward. At lower resolutions, ambiguities may exist that require multiple rounds of model building and refinement. Either way, the basic procedure is a bootstrapping one wherein atoms for the interpretable density are placed in the map (i.e., given 3D coordinates within the asymmetric unit); the positions are then refined against the data, new maps are calculated using the new phase information from the model, and the procedure is repeated (Figure 1, step H). This iterative building and refinement process gradually improves the phases and the quality of the maps such that features that may not have been visible at the outset become visible. In cases where the data are ≤2.3 Å, automated building and refinement programs can do much of the work (Badger, 2003; Lamzin and Perrakis, 2000). At lower resolutions, the work still requires building and map interpretation to be done by a human. It should be noted that the precision of the placement of the atoms in a macromolecular structure is typically much greater than the resolution of the data. The positional errors in the core regions (i.e., those that are best defined) range from 0.1–0.2 Å at 1.5 Å resolution to ∼0.5 Å at 3.0 Å resolution. Why is this precision better than the diffraction limit? Chemistry. We know the average lengths and angles for all of the types of covalent bonds that hold together a protein. These values are included as restraints in the refinement procedure and ensure that the final structural model makes good chemical sense.
Table 3. Rough Guide to the Resolution Required for Identifying Features of Different Types in a Well-Phased Electron Density Map of a Protein.
| Type of feature | Approximate resolution |
|---|---|
| α helix | 9 Å |
| β sheet | 4 Å |
| “random” main chain (i.e. no regular secondary structure) | 3.7 Å |
| Aromatic side chains | 3.5 Å |
| Shaped bulbs of density for small side chains | 3.2 Å |
| Interpretable conformations for side chains | 2.9 Å |
| Density for main-chain carbonyl groups, identifying plane of peptide bond | 2.7 Å |
| Ordered water molecules | 2.7 Å |
| Resolving individual atoms | 1.5 Å |
Table is taken from Blow (2002).
Given the self-reinforcing procedure of model building and refinement, how can one be certain that the new maps and refined structures are not simply the result of ever-increasing model bias? Fortunately, the data from an X-ray diffraction experiment are redundant to some degree. Thus, one can actually exclude 5%–10% of the data from the entire refinement procedure and use this set (known as the Rfree set) as an unbiased metric of how correct the structure refinement is (Brunger, 1993). During the structure refinement, the crystallographer compares how well the structural model predicts the Rfree dataset. It is now routine to report the R and Rfree values for a crystal structure. These two numbers serve as one metric for how correctly things have been done. R and Rfree should be similar (Rfree is always higher by ∼2%–6% for well-refined structures). During the refinement process, the value of R may decrease, but Rfree will stay the same (or increase). If the R values are already low, this is one way for crystallographers to know when to stop refining. Large differences between R and Rfree indicate that some portion of the model is incorrect and that something needs to be corrected before the refinement can be completed. Examination of stereochemistry and Ramachandran analysis provide two other good measures of the quality of a structure. In good structures, one should see RMSD for bond lengths of <0.02 Å and bond angles of <2°; curiously, lower values than these do not necessary indicate higher quality structures but may reflect the use of too-tight constraints during refinement. Ramachandran analysis examines which parts of conformational space the protein is in (Kleywegt and Jones, 1996). Due to steric constraints, the conformational space that the protein backbone can sample is limited. Most of the model, if not all, should be in the favored and allowed regions of a Ramachandran plot. Significant numbers of amino acids in the “disallowed” region are causes for concern.
Interpreting Structures
Although the process of structure solution may take a long time from the inception of the project to a final refined structure (anywhere from 1 month to multiple decades), from many perspectives the final, refined structure is just the very beginning of the investigation. At this stage, the intersection of biochemistry, mutational studies, and functional data with the structure becomes critical. When there has been a good deal of prior mutagenesis and biochemical work done on the crystallized protein or on a close homolog, the structure provides a ready framework for understanding prior observations and can immediately reveal where binding sites, active sites, and distinct functional domains lie. A beautiful example of this intersection can be seen in the work on the snail acetylcholine binding proteins (AChBPs) (Celie et al., 2004, 2005a, 2005b; Ulens et al., 2006). These soluble proteins are homologs of the extracellular neurotransmitter binding domain of nicotinic acetylcholine receptors (nAChRs). The initial structure determination revealed the conserved fold that is likely to be found in the ligand binding domains of the entire receptor family (Brejc et al., 2001). Good sequence correspondence with nAChRs permitted the synthesis of decades of research on this protein class with the ready identification of the ligand binding site and the autoimmune binding site associated with myasthenia gravis. Importantly, there were key differences in the part of the protein that should face the membrane. In AChBP, this part was composed of hydrophilic amino acids, while the same region in the intact receptor is largely hydrophobic. Subsequent cocrystal structures with a number of ligands and peptide toxins have further revealed the details about ligand selectivity and binding (Celie et al., 2004, 2005a, 2005b; Hansen et al., 2005; Ulens et al., 2006).
Usually, there is only one major conformation of the protein in the crystal. This conformation provides a snapshot of only one of the possible conformations that the folded state of the protein may inhabit during its lifetime. While no single structure can answer all questions about protein function, structures have a great power to parse which functional mechanisms are tenable and which are not. For example, structure determination of the calcium channel β subunit alone and as a complex with its binding site on the pore-forming subunit eliminated a long-standing notion in the field regarding how these two subunits interacted, defined the real high-affinity binding site, and revealed the true nature of the interaction (Chen et al., 2004; Opatowsky et al., 2004; Van Petegem et al., 2004).
It is always important to ask which conformational state has been crystallized. Because of the nature of protein crystals, it is not likely that, by virtue of the crystallization, the protein has been “forced” into some conformation that was not present in the crystallization solution. Certainly, there can be parts of the protein that can be affected by crystal lattice contacts, but these effects tend to be limited to particular conformations of surface residues or flexible regions. Nevertheless, it is essential to get some context for the structure. In the best cases, trapping the protein in a particular state with a substrate, substrate analog, or inhibitor can do this. For proteins where such reagents are not available, some mixture of mutational analysis and biochemical or functional assay that tests a mechanistic prediction of the structure will be useful. Here is where the power of the structure becomes manifest. Structures are fantastic platforms for hypothesis generation as they enable the researcher to make precise, testable predictions about function from an analysis of which portions of the proteins are where, which interact with what, and which might be key for a given function. The recent debate over how exactly the voltage sensor in voltage-gated potassium channels works illustrates this issue nicely (Jiang et al., 2003; Lee et al., 2005; Tombola et al., 2006). The original structure solution of the archaeal voltage-gated potassium channel KvAP (Jiang et al., 2003) revealed an unexpected conformation of the voltage sensor (now thought to be a nonnative state caused by lack of the constraints imposed by the lipid bilayer; Lee et al., 2005; Long et al., 2005). The possibility that the voltage sensor conformation seen in the crystal, or a closely related conformation, might actually occur in a native membrane environment sparked a great deal of structure-based functional tests that still have yet to provide a unified resolution (Tombola et al., 2006).
There are some basic properties that are easy to sort out once a structure is known. Is the protein fold related to other known structures? If so, which ones? The Dali Server online is a useful tool for such questions and enables one to readily generate superposition files of PDBs so that one can compare the structures (http://www.ebi.ac.uk/dali/). Which residues are on the surface? Do any sit in interesting environments, such as an active site or binding interface? Visual inspection of the protein structure is usually a good way to get at these questions.
By crystallizing a protein in different conformational states, it may be possible to build up a molecular movie of the structures and potential structural transitions that occur as it performs its function. One of the most beautiful examples of the power of such an approach is evident in the recent structural work on the calcium ATPase from skeletal muscle. This membrane protein uses ATP hydrolysis to drive protein conformational changes that transport calcium ions from the cytoplasm into the sacroplasmic reticulum. Because there are a wide range of ATP analogs for various steps in the hydrolysis reaction as well as other pump inhibitors, it has been possible to determine the structure of this pump in six out of eight states from its reaction cycle, and to make a movie in which the models of the crystallized states are connected by interpolation of conformational changes that only involve reasonable rotations of bonds and domains (Toyoshima et al., 2004). The resulting movie gives a breathtaking view into the elegant inner workings of an ion pump.
Many ‘Easy’ Pieces?
It is a fortunate fact that proteins are highly modular. Biology uses this property to create proteins with new functions through mixing and matching individual domains. Structural biologists exploit the modularity to isolate functional domains that can be studied and characterized structurally. This approach has been used to great effect to study many ion channels and cell surface receptors. The bonuses are obvious. The ability to get some structural information regarding a protein for which there was previously none provides a major candle in the dark for everyone in the field, even if the candle does not illuminate the entire landscape. Thus, the study of domains, which is a well-established approach for both soluble and membrane proteins, provides a timely and pragmatic way to bring a problem from cartoon fantasy into 3D reality. If the domain happens to bind a key ligand, as in the AChBP example, it can serve as a ready template for examining the details of ligand binding and specificity. What are the limits? The structure of a fragment reveals nothing regarding the absent parts of the protein, except for where covalent connections to other domains might lie. For this reason, the study of fragments demands that there be some accompanying functional studies to test the limits of the structural data so that it can be clear what is new and what has yet to be discovered. However, one should not assume that just because a structure is of an extra-membranous portion of a channel or receptor that it was trivially easy to determine or that by virtue of being a fragment it is somehow uninteresting or uninformative.
Simulacra: Homology Models, Interkingdom Inferences
It is not uncommon for structures of bacterial and archaeal proteins to be used as stand-ins for interpreting data from a related eukaryotic protein for which the structure has yet to be determined in atomic detail. How much can we learn from the structure of a protein that is similar to, but not exactly, the one that we may study? The answer depends on the details of the question asked. There is no doubt that motifs of active sites and general protein architecture have conserved architectural features that are preserved throughout billions of years of evolution. Nevertheless, even though the bacterial or archaeal proteins may serve as good guides, it is unfortunately not yet possible to build homology models with the accuracy needed to make definitive statements about specific interactions (Petsko and Ringe, 2003). The problem (or advantage) with proteins is that they are able to absorb changes to the sequence by altering their structure. Changes in side-chain properties from one homolog to another can perturb the structure in unforeseen ways, and while it may be a good bet that the active site of a bacterial or archaeal channel or transporter indicates something about the nature of a highly conserved site in a mammalian counterpart, the level of “fuzziness” still remains high. Any homology model is inherently very biased toward the structure of the starting template (Petsko and Ringe, 2003). As it stands now, the best homology models get the backbone fold mostly correct. Precise positioning of side chains and loops remains beyond our present reach. As protein sequences diverge there may be judgment calls that need to be made to obtain the proper correspondence between residues. Thus, many of the things that a biologist might want to do with a homology model are beyond what can be done reliably, such as understanding the details of side-chain interactions, docking proteins, or ligands. Nevertheless, even a poor homology model can prove of some use for designing the typical biological experiment, picking which residue to mutate to test a hypothesis about function.
The ‘Static’ Nature of Crystal Structures
It is not really correct to claim that X-ray structures are “just static pictures” of macromolecules. Although the final refined model represents the average positions of the atoms, the structures do contain information about the mobility of different parts (Furnham et al., 2006). One indicator is something known as the B-factor. Each atom in the structure has a B-factor value that describes the average mean displacement from the position seen in the structure. As a general rule of thumb, low B-factors show areas of low mobility and high B-factors show regions of higher mobility. This simple interpretation can break down in low-resolution structures (>2.7 Å) as these structures generally have higher average B-factors that also reflect the general disorder in the lattice.
Regions that have multiple conformations may be poorly defined or absent from the final refined models. While absence of a region does not necessarily mean that it is unstructured, it does indicate that the region in question has multiple conformations that are not identical in every copy of the macromolecule in the crystal lattice. Even though large-scale motions of proteins are not allowed in a crystal (for example, oxygenation of hexagonal crystals of deoxyhemoglobin famously caused the crystals to crack, dissolve, and reform as needles containing oxyhemoglobin [Haurowitz, 1938]), it has been shown many times that enzymes are active in the crystalline state. Thus, some small-scale motions must be permitted. While structures represent one (or a limited set of) conformation(s), one should not mistake the ribbon diagram shown in a publication for an indication that proteins are inflexible. The structure itself does not immediately reveal the energetic importance of interactions or the inherent dynamics, but it can provide some very good clues for where to look using other methods.
X-ray studies may involve a long, difficult path to obtaining information about the structure of a macromolecule. Nevertheless, the immense amount of information that such studies reveal regarding molecular anatomy gives an unparalleled vantage point for understanding functional mechanisms and makes the endeavor most worthwhile.
Electron Microscopy
Not every protein or protein complex may be able to be coaxed into a 3D crystal. In such cases, EM studies can be a useful way to extract structural information (Henderson, 2004). Electron microscopy methods can image molecules as single particles (thus, bypassing the need for a crystal), filaments, 2D crystals, and tubular crystals possessing helical symmetry (Chiu et al., 2005). The wavelengths of the electrons used are on the order of a fraction of an angstrom, and as such, there is no inherent limit in resolving the atomic structure of a macromolecule. Because it is possible to focus the electrons to form an image in the electron microscope, EM studies also have an advantage in that there is no phase problem. By examining single particles, one can skirt the problem of multiple conformations, as long as one can recognize systematic conformational differences between individual particles. However, electrons have much more energy than the X-rays used in a crystallographic experiment, and for EM, radiation damage is an even more critical issue than in X-ray experiments. As a result, low-dose and low-temperature (liquid nitrogen or liquid helium) methods must be used. Trying to achieve the balance between imaging and destroying the sample is the biggest challenge and serves as a major limit to the resolution that can be achieved. It remains a major feat to obtain EM structural data at <9 Å resolution. Thus, the structural data that are usually obtained reveal more about the basic shape or domain structure of a protein or protein complex and very little about the details.
One straightforward way to avoid the radiation damage issue is to make a “negative stain” image of the protein under study. In this experiment, a hydrophilic agent (most commonly uranyl acetate) that does not bind proteins is applied to the protein samples on the EM grid (Kiselev et al., 1990). The resulting images show where the stain is excluded and thereby define the protein envelope. The limit to such studies is an ∼20 Å resolution. There can be issues if the protein has interior cavities that bind the stain. While one cannot see many structural details at this resolution, the approach can be very powerful when combined with high-resolution X-ray structures. One recent example of this is the delineation, by EM, of the conformational changes that happen to the ectodomains of cell surface receptor integrins, in which one conformation was known at high resolution from X-ray studies (Nishida et al., 2006). Because the conformational changes could be controlled by the addition of ligands and caused large domain rearrangements, it was possible to understand how extension of the protein is intimately linked with receptor activation. Similarly, recent studies of AMPA receptor complexes by EM have suggested how individual domains that have been solved by high-resolution X-ray studies are arranged in the intact receptor (Nakagawa et al., 2005). These studies together with other work in the EM field make it clear that integrated studies that merge X-ray structures with EM images are powerful tools for understanding the conformational states of large macromolecular machines and assemblies.
A second way that single-particle studies can be done, which is also a method that can achieve higher resolution, is to image the protein in ice using a method known as cryo-EM (Chiu et al., 2005; Jiang and Ludtke, 2005). The challenge with this approach is that there is poor contrast between the protein and the ice. This issue, together with the low-dose requirement to avoid sample destruction, makes for very noisy raw data images. It is a major challenge to image proteins <250 kDa with this method. Much of the research in cryo-EM remains focused on developing methods to extract the information from the very noisy images (Chiu et al., 2005). Also, particle picking is still not done by automation, although this is an area of intensive methods development (Orlova and Saibil, 2004). For large complexes, especially those with high internal symmetry such as viruses, averaging methods can facilitate structure resolution (Jiang and Ludtke, 2005), and a few thousand individual images of particles can be enough to generate a structure at ∼10 Å resolution. For objects with less symmetry, one to two orders of magnitude more images are required (Chiu et al., 2006).
In terms of single-particle reconstructions, it is actually not straightforward to determine precisely the resolution of the resultant density maps. A common way is to compare two independent maps and determine the Fourier shell correlation. There is no agreement for how to set the cutoff (Chiu et al., 2005; Jiang and Ludtke, 2005; Rosenthal and Henderson, 2003), so claims of resolution should be taken with caution. Moreover, different parts of the map may have better or worse resolution than others due to domain flexibility, misalignment, or preferred particle orientations. It is not the same as an X-ray experiment, wherein the scientist knows where the data stop. Also, it should be noted that there is no Rfree equivalent for a single-particle reconstruction. Cross-validation is done by splitting the data into two sets, doing two separate reconstructions, and comparing. While this can provide some degree of confidence, there is yet no truly objective way to vet the structures.
Electron crystallography has been used to study membrane proteins in their native environment, a lipid membrane (Renault et al., 2006). As with X-ray crystallography, electron crystallography requires an ordered array of proteins, but instead of a 3D crystal, the array is either a 2D sheet, or a hollow, helical tube (Mosser, 2001). Thus far, the largest impact of this approach on neurobiological questions has been made by Unwin and colleagues in their work on imaging the open and closed states of the nAChR (Miyazawa et al., 2003; Unwin, 1995). The advantage of electron crystallography is that there is no phase problem; one can take images of the crystals. The difficulties arise in the fact that the crystals are never really perfectly ordered. Because they are tubes or sheets that are only one protein molecule thick, they are prone to bending and buckling. Computational methods have been developed to help overcome these issues (Beroukhim and Unwin, 1997). The technical challenges of electron crystallography remain high, and there are still only a few labs in the world that are expert. The promise of imaging proteins in a membrane environment maintains the enthusiasm for this approach and is expected to fuel further developments in this field (Renault et al., 2006).
Finally, there is an emerging effort in combining X-ray and cryo-EM studies (Fabiola and Chapman, 2005). Here, the main challenges are developing robust methods for assessing the correct placement of atomic models in low-resolution EM maps. Such combined approaches, together with homology modeling, have recently led to the publication of a complete molecular model for a clathrin lattice (Fotin et al., 2004; Fotin et al., 2006). We can expect that further work using similar approaches will help scientists bridge the gap between large protein complexes that can be imaged but not crystallized and high-resolution models from X-ray work.
SAXS, an Old Dog with New Tricks
What if there were a method that could give you a 10–15 Å molecular envelope of density for a large structure in a short period of time with modest effort? While such an idea was once a structural biology dream, recent advances in both instrumentation and computation are bringing a simple solution method known as SAXS into the realm of possibility (Svergun and Koch, 2002, 2003). The experiment is simple. One measures the 1D X-ray scattering curve for a solution of purified protein sample (at the concentrations that are usually used for crystallization, or 5–30 mg ml−1). The shape of the scattering curve contains information about the size and shape of the molecules doing the scattering. While at first pass one might think that such a curve might contain limited information, with the advances in computational power it has become possible to construct de novo models of the likely structure that might have produced the data. This is done by using a collection of hard spheres that equal the number of amino acids in the subject and defining arrangements of the spheres that recapitulate the scattering profile (Svergun et al., 2001) (Figure 4). This is an inherently underdetermined problem, and many related configurations of spheres could give equally good fits (imagine the difference made by displacing just one ball to a new position). The typical procedure is to run the calculation multiple times, average the models, and examine the features that are convergent. With good data one can get a reliable estimate of the overall shape and dimensions of the molecule.
Figure 4. Example of SAXS Analysis.
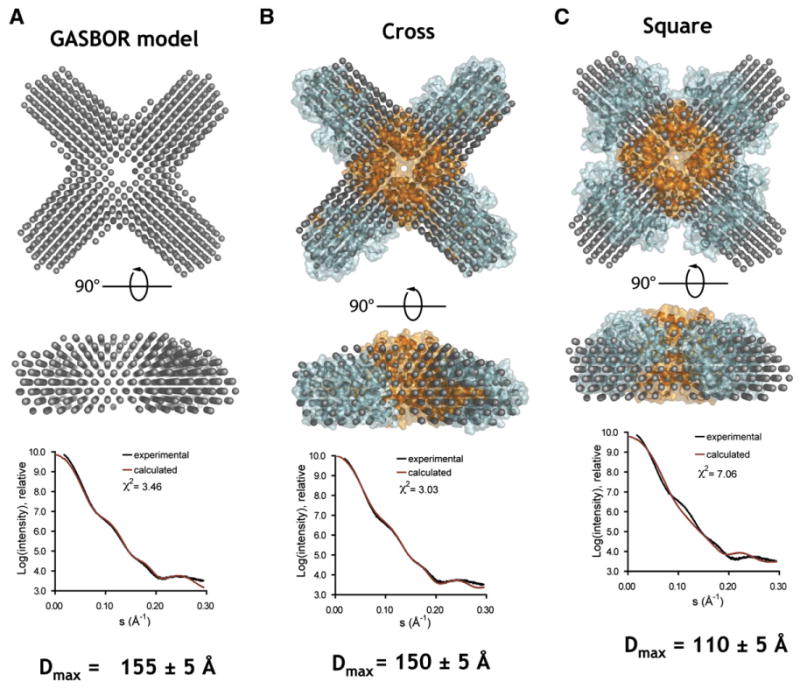
(A) Top shows the ab initio model for SAXS data from the Kv4.3 T1 domain/KChIP1 complex calculated from the scattering data. The bottom panel shows the scattering intensity profile for the data (black) and the model (red). (B) Comparison of the crystal structure of the Kv4.3 T1 domain/KChIP1 complex with the ab initio model shows excellent correlation with the data in contrast to an alternative square-shaped arrangement shown in (C). The Dmax values show the maximal dimension of the particles calculated from the data (A) and from the models (B and C). Data are from Pioletti et al. (2006).
The real power of SAXS is manifest when it is combined with high-resolution models. SAXS is a terrific approach for vetting competing models of multiprotein complexes based on arrangements of X-ray crystallographically determined domains. By calculating the SAXS profile of different models (Svergun et al., 1995), the method can readily eliminate certain arrangements. This sort of combined approach has been used elegantly by the Kuriyan lab to understand the conversion of inactive CaMKII to active CaMKII (Rosenberg et al., 2005). My own lab has used it to examine competing models for the assembly arrangements of voltage-gated potassium channel regulatory domains (Pioletti et al., 2006) (Figure 4). The requirements for SAXS samples are similar to those used in crystallization. As many synchrotrons now have SAXS beamlines, it seems likely that many crystallographers will turn to SAXS as an alternative means to get informative data regarding the shape of their protein or to examine conformational transitions. At the very least, if one's crystals do not diffract well, it should be possible to return from a beamline trip with some data about the gross organization of the molecule or complex under study.
NMR Structure Determination and Molecular Interaction Mapping
NMR spectroscopy can also be used to determine macromolecular structures in solution (Clore and Gronenborn, 1998; Ferentz and Wagner, 2000). The way that this is done is completely different from the imaging methods of X-ray crystallography and EM. Instead of imaging the sample with incident radiation, the sample solution is placed in a tube in a high-field magnet (500–800 MHz) and irradiated with radio waves. Each NMR active nucleus in the sample results in a peak at a characteristic frequency in the spectrum. Each peak in the spectrum has a position (relative to either the carrier frequency of the magnet or an internal standard) known as the chemical shift. The position of each peak corresponds to the particular energy that is required to flip the nucleus of the atom between states that are aligned parallel or antiparallel to the strong external magnetic field provided by the instrument and is exquisitely sensitive to the local magnetic environment of the atom. Proton nuclei are NMR active (natural abundance is 99.98%) (Wüthrich, 1986), and because of their ubiquity in proteins, they provide a great source of residue-by-residue information. In proteins >10 kDa, spectral overlap becomes a problem for proton-only NMR. To increase the spectral resolution so that resonances with similar chemical shifts can be resolved requires doing experiments that use 1H, 15N, and 13C nuclei. However, the natural abundance of the NMR active isotopes for the carbon and nitrogen are too low to be of general use in macromolecular samples (1.11% and 0.37%, respectively) (Wüthrich, 1986). Fortunately, by using expression systems one can label the carbon and nitrogen atoms (either uniformly or selectively, depending on the approach) with 13C and 15N by supplementing the growth media (Goto and Kay, 2000). Another necessary modification for proteins >25 kDa is to replace some of the covalently bonded hydrogens with deuterium (Ferentz and Wagner, 2000). This modification offsets the loss in signal that occurs due to the greater number of relaxation processes that accompany increased protein size. These modifications do not perturb the structure and greatly expand the power of the NMR experiments (Ferentz and Wagner, 2000).
Given an NMR spectrum, the spectroscopist must assign each peak in a spectrum to a particular atom in the protein. Information is gathered from a variety of different types of experiments that determine which atoms are close to each other by virtue of covalent interactions, what the bond torsional angles are, and which atoms are close (≤5 Å) because of the overall 3D structure of the macromolecule (Clore and Gronenborn, 1998; Ferentz and Wagner, 2000). Additional structural information can be derived by exploiting recently developed methods for weakly orienting the sample in solution to collect conformational restraints that define the orientation of certain interbond vectors such as that between an amide proton and nitrogen atom (Bax and Grishaev, 2005). In any NMR structure calculation, it is necessary to include other constraints such as covalent constraints for bond lengths and geometries along with explicit potentials for non-bonded interactions (Clore and Schwieters, 2002). Once the spectra have been assigned (i.e., the atom belonging to each peak is known), the spectroscopist uses all the constraints that can be measured plus the bond constraints to build atomic models that are consistent with the data. A 2D analogy of the process is building a map of a country from knowledge of the distances between all of the main centers of population. There are many more details regarding the types of structural information that can be gained from NMR. I encourage the interested reader to refer to the recent excellent review by Ferentz and Wagner (2000).
One of the major limits with solution NMR studies remains the fact that there are issues with collecting usable spectra for structure determination of proteins and protein complexes >40 kDa (Tugarinov et al., 2004). This limitation has confined the impact of macromolecular NMR in neuroscience to the determination of the structures of small peptide toxins. There are serious efforts underway to break through the size limitation so that large protein complexes can be studied, but such studies are really at the frontier of the method (Tzakos et al., 2006).
NMR can also be used to examine the structure of small membrane proteins in the solid state such as the environment provided by a membrane (Luca et al., 2003; McDermott, 2004). The sample requirements remain demanding, as 15N and 13C isotopic labeling is absolutely required. The field is growing rapidly and the methodology can be of particular use with samples that are recalcitrant to crystallization. Solid state NMR has been used to define the structure of a number of small transmembrane peptides, but has not yet been used to determine the structure of a membrane protein (Hong, 2006).
Because of the sensitivity to local environment, chemical shift is an excellent reporter of conformational changes and intermolecular interactions between proteins or proteins and small molecules (Carlomagno, 2005; Pellecchia, 2005; Takeuchi and Wagner, 2006). One very nice recent synthesis of such methods with solid state NMR has been employed in an examination of the conformational changes in a potassium channel selectivity filter caused by binding to a small, inhibitory peptide toxin (Lange et al., 2006). This work is a good example of the power of NMR methods to characterize protein-protein or protein-small molecule interactions in the context of a structural framework that has been provided by X-ray methods and provides a view of toxin-channel interactions that has thus far eluded crystallographic characterization. Questions about protein-protein and protein-small molecule interactions drive much of basic molecular neuroscience and the desire to develop new ways to control neuronal activity. As the catalog of X-ray structures of channels, transporters, and receptors grows, we can anticipate a burgeoning number of studies that merge NMR and X-ray structural data to characterize known interacting partners and discover new ones.
Other Solution Tools
Molecular Sizing
Some of the most basic questions about macromolecular structure are questions about assembly states. To answer such questions, one does not need to solve a high-resolution structure but rather can employ a number of different solution-based biophysical tools. The simplest is size-exclusion chromatography. In this method the sample is applied to a column that is packed with beads that have a defined pore size. One monitors the elution time it takes for the protein of interest to migrate through the column (usually by ultraviolet absorbance). Because of the nature of the pore sizes in the column, large proteins have limited access to the internal pores of the bead, and thus elute first. Smaller proteins have access to the internal pores and meander through them, thereby making their passage time through the column longer. Molecular biologists should note that this is the exact opposite migration profile from passage through continuous media such as an agarose or acrylamide gel. An analogy for size-exclusion would be a comparison of the time it takes for adults versus children to cross a playground. Adults will not fit on most of the equipment, and thus can cross from one side to the other without diversion. The same is not true for the children. Estimation of molecular weight by size-exclusion chromatography requires a comparison with a standard curve using protein standards of known molecular weight. It should be noted that interpretation of the molecular size of the test protein could be confounded by unusual protein shape, the presence of detergent micelles, and interactions with the column matrix. Thus, while size-exclusion chromatography is useful, because what it actually measures is an effective hydrodynamic radius, it is not a definitive measure of absolute molecular size.
One of the best unbiased ways to measure molecular size is equilibrium analytical ultracentrifugation. This experiment pits the centripetal force generated by a centrifuge against buoyancy. Special cells are used that allow the experimentalist to monitor protein concentration as a function of radial position (usually by UV absorbance). Spinning the rotor creates a gradient of protein across the cell. Once the system is at equilibrium (i.e., the distribution of the material across the cell no longer changes) one measures the radial distribution of macromolecules. By knowing the amino acid composition of the protein, the components of the solution, temperature, and rotor speed, one can explicitly solve a set of equations that yields the molecular mass. This experiment is independent of shape and size considerations. For self-associating systems, the experiment can also be used to measure affinities. The work by Gouaux and colleagues provides a nice example of the power of this experiment to sort out an ion channel gating mechanism when paired with structural and functional data (Sun et al., 2002). In this case, the authors used analytical ultracentrifugation to establish that two ways of blocking receptor desensitization, a well-studied channel mutation and a drug, acted by stabilizing the formation of dimers between receptor extracellular domains. These observations combined with electrophysiological and crystallographic studies provided evidence for the importance of conformational changes at the receptor extracellular domain interfaces in receptor activation and desensitization.
Binding Interactions
Binding events are of central importance in the function of macromolecular machines and signaling networks. Understanding the nature of interactions between members of macromolecular complexes is an important step in understanding function and critical for the development of selective inhibitors. There are many different ways to measure binding. In the discussion about NMR I mentioned one structural approach to characterizing interactions. Here, I would like to highlight a second biophysical method that is gaining prominence for understanding the details of binding energetics but is likely to be unfamiliar to a neurobiologist, isothermal titration calorimetry (ITC) paired with alanine scanning mutagenesis.
Calorimetry: Feeling the Heat
Elementary thermodynamic considerations state that all reactions must proceed with a change in energy that either removes or gives off heat to the surroundings. The ITC experiment directly measures the evolution or uptake of heat when two components are mixed (Leavitt and Freire, 2001; Velazquez Campoy and Freire, 2005). The setup of the experiment is conceptually simple. A thermostated chamber is filled with one of the components. A titration syringe adds defined volumes of the other component into the chamber under mixing conditions. If the two components interact, heat will be absorbed or evolved. By virtue of a feedback mechanism, which should be familiar to anyone who has ever done a voltage-clamp experiment, the instrument measures how much current is required to maintain the reaction chamber at a constant temperature. This provides a direct measure of the heat of the reaction. The advantage of ITC is that it is the only method that directly measures the thermodynamic parameters of binding. Also, it is a high-resolution method, meaning that binding events that may have been silent if probed by some other method that relies on an intermediary for detection can be seen. The effective range of the measurement encompasses binding reactions having association constants of 104 < Ka < 108 (Velazquez Campoy and Freire, 2005).
Binding interfaces in protein-protein interactions are usually large (600–2000 Å2) and may involve intermolecular contacts from 10 to 50 side chains from each protein (Lo Conte et al., 1999; Nooren and Thornton, 2003). One thing that cannot be discerned from any structural method is the relative importance of individual interactions. One of the increasingly common approaches is to combine structural data, ITC, and a mutagenesis method known as alanine scanning mutagenesis to probe protein-protein or protein-ligand interaction surfaces. Alanine scanning mutagenesis takes each residue that contributes to an interface and changes it to alanine (Wells, 1991). Because alanine has the common core that is shared by all amino acids besides glycine, a β-carbon, the effect is to ask whether an individual side chain contributes positively, negatively, or not at all to the energy of binding. The common result seen thus far is that even though protein-protein or protein-ligand interfaces are large, there is only a limited set of interactions that dominates the energetics (Arkin and Wells, 2004; Clackson and Wells, 1995; Desrosiers and Peng, 2005). Why is this a useful thing to know? Such clarification is essential for designing ways to disrupt the interaction, whether that is to maximize the impact of mutagenesis in a functional study or to achieve the ultimate design of small molecules that can be used as research tools or even drugs (Arkin and Wells, 2004).
Dynamics
The role of time in living systems is one of the most difficult, yet essential, things to understand. Macromolecules come to life because they undergo constrained vibrations that result from thermal energy. How can we understand motions based on the structures? Determining the structure of a protein in different conformational states provides an essential guide but still does not reveal how the protein might behave on the microsecond to millisecond timescales where many conformational reactions take place. The best structural biology tool for measuring macromolecular motions is NMR. Under the right experimental circumstances, it can give atom-by-atom information on the dynamic properties of a macromolecule (Kay, 2005; Mittermaier and Kay, 2006). Depending on the particulars of the experimental setup, it is possible to access information about a broad range of timescales for backbone and side-chain motions (picoseconds to milliseconds). NMR dynamic studies are particularly powerful when there is a high-resolution structure of the macromolecule under study, and they make X-ray studies and NMR highly complementary approaches to understanding macromolecules. As with other NMR approaches, there are still challenges in imaging large macromolecules (>40 kDa). Nevertheless, the frontiers of the method are constantly being pushed, enabling us to study larger and more complicated systems (Kay, 2005).
Examples of NMR dynamics studies of channels and receptors are still limited but are illustrative of the insights gained from the approach. Recent NMR studies of KcsA in detergent micelles have given the first direct measure of the dynamics of a channel selectivity filter (Chill et al., 2006a, 2006b) and have shown key differences in the dynamic behavior of the transmembrane versus intracellular domains (Chill et al., 2006a). Studies of the dynamic properties of different AMPA receptor agonists bound to the ligand binding domain suggest that although the X-ray structures of the complexes are all similar, there are significant differences in how the protein dynamics are affected by the ligands (Valentine and Palmer, 2005). Certainly, as the field grows and more high-resolution structures are solved, the combined power of NMR dynamics studies interpreted in the context of structural framework will be felt more and more.
Molecular Dynamics
It is unlikely that even the best experimental approach can give structural information for every intermediate state for every atom in the system as the protein moves from one conformation to another. The main hope for understanding how systems move through the transitions from one state to the next is computer simulation and an approach known as MD (Gumbart et al., 2005; Karplus and McCammon, 2002). This computational approach attempts to solve Newton's equations of motion for all of the atoms in a defined system given the constraints of the potentials that represent the main sources of interaction and repulsion, for example, electrostatic and van der Waals interactions. For a 100 residue protein (∼15 kDa), that amounts to ∼2000 atoms, excluding the water. In the case of a membrane protein where one needs to simulate the protein, lipid bilayer, and water, even the smallest system contains ∼50,000 atoms (Gumbart et al., 2005), a formidable number of things to keep track of during the simulation.
One of the major difficulties in obtaining great insights from MD is that there remains a serious timescale gap between the timescale of simulations that can be run using a reasonable amount of computational power (1–5 ns) and the timescales at which protein motions that are relevant for most functions occur (microsecond to second) (Tama and Brooks, 2006). Additionally, the potentials used to describe certain interactions remain an imperfect description of the intermolecular forces. Moreover, the study of a single molecule can have some strange consequences. The energy landscapes that define protein movements are rugged and may contain long-lived conformations that are kinetically trapped. To get a picture of a rugged energy landscape, imagine being at the peak of a large mountain at a big ski resort. There are many paths leading down the mountain. It is easy to follow a path to a place where one cannot descend further. However, the inability to descend does not guarantee that one has reached global minimum of the base lodge; rather, one may be stuck in a local minimum such as small, high-altitude valley. In such a case, the only way to get down to the base lodge is to return to the peak and follow a different path of descent. Likewise, one would like to be able to run the same simulation multiple times to see if the protein always moves in the same way or sometimes moves in different paths, and how many times and in what conformations it is prone to spend the most time.
In processes where the timescale of the computation matches the timescale of the physical event under study, computational studies have been extremely revealing. One such class of examples includes studies of ion permeation of channels (Roux, 2005). For ion permeation, the physical process occurs on the timescale of nanoseconds and is well matched to the lengths of simulation times that are presently feasible for systems that include modestly sized proteins, water, ions, and a lipid bilayer (tens of nanoseconds). Based on the successes here, we can anticipate that with increases in computational power the timescale gap will become smaller and smaller such that longer timescale processes can be accurately simulated.
One promising way, still being developed, to extend the effective timescale of simulation is to use coarser grained models in which only a limited set of the atoms are used to do normal mode analysis (Tama and Brooks, 2006). Coarse-grained studies make approximations by using a reduced model with fewer atoms. Small groups of atoms are treated as single particles. This allows one to run the simulations longer and to have the ability to repeat the calculation multiple times. In recent work studying the stability of the isolated KvAP S4 voltage sensor in membranes, the Sansom group found two distinct types of preferred orientations, inserted into the bilayer and parallel to the bilayer surface (Bond and Sansom, 2007). The observation of very different final outcomes from the same starting point in the simulation underscores the importance of being able to map the robustness of MD trajectories and suggests that coarse-grained studies may offer a good way to explore conformational dynamics of different systems.
Finale and Future: Integrated Studies, the Way Forward
All of the approaches presented here offer powerful ways to gain authentic molecular insight into the anatomy that underlies how macromolecules function. The impact of these approaches is just starting to touch questions key to understanding the nervous system. Where will these detailed studies lead? Besides the explanatory power of the various structural approaches for understanding macromolecule function, they also offer templates for protein design, the engineering of variants with novel function, and the potential for providing powerful guidance for drug discovery and development. As many of the approaches offer complimentary information, integrated studies that use multiple methods to get at different levels of structural questions offer a great advantage for querying the nature of large macromolecular complexes in different functional states. We can expect that such approaches should eventually be applied to many types of ion channels, transporters, receptors, and higher order signaling complexes that include these components. There is no question that such a bounty of molecular information will bring new ideas of how macromolecules in neurons function on their own and as components in signaling networks. The advent of molecular structural neuroscience has brought a thrilling start to understanding the workings of the brain at a level that would make Ramon y Cajal very proud of those following his legacy.
Acknowledgments
I would like to thank K. Brejc, Y. Cheng, D. Fass, J. Gross, A. Moroni, G. Thiel, and F. Tombola for valuable comments on the manuscript. D.L.M.'s research is supported by grants from NIH-NINDS, NIH-NIHLB, NIH-NIDCD, NIH-NIGMS, the McKnight Foundation for Neuroscience, and the American Heart Association.
References
- Abramson J, Smirnova I, Kasho V, Verner G, Kaback HR, Iwata S. Structure and mechanism of the lactose permease of Escherichia coli. Science. 2003;301:610–615. doi: 10.1126/science.1088196. [DOI] [PubMed] [Google Scholar]
- Aricescu AR, Assenberg R, Bill RM, Busso D, Chang VT, Davis SJ, Dubrovsky A, Gustafsson L, Hedfalk K, Heinemann U, et al. Eukaryotic expression: developments for structural proteomics. Acta Crystallogr D Biol Crystallogr. 2006a;62:1114–1124. doi: 10.1107/S0907444906029805. [DOI] [PMC free article] [PubMed] [Google Scholar]
- Aricescu AR, Lu W, Jones EY. A time- and cost-efficient system for high-level protein production in mammalian cells. Acta Crystallogr D Biol Crystallogr. 2006b;62:1243–1250. doi: 10.1107/S0907444906029799. [DOI] [PubMed] [Google Scholar]
- Arkin MR, Wells JA. Small-molecule inhibitors of protein-protein interactions: progressing towards the dream. Nat Rev Drug Discov. 2004;3:301–317. doi: 10.1038/nrd1343. [DOI] [PubMed] [Google Scholar]
- Armstrong N, Sun Y, Chen GQ, Gouaux E. Structure of a glutamate-receptor ligand-binding core in complex with kainate. Nature. 1998;395:913–917. doi: 10.1038/27692. [DOI] [PubMed] [Google Scholar]
- Badger J. An evaluation of automated model-building procedures for protein crystallography. Acta Crystallogr D Biol Crystallogr. 2003;59:823–827. doi: 10.1107/s0907444903003792. [DOI] [PubMed] [Google Scholar]
- Bax A, Grishaev A. Weak alignment NMR: a hawk-eyed view of biomolecular structure. Curr Opin Struct Biol. 2005;15:563–570. doi: 10.1016/j.sbi.2005.08.006. [DOI] [PubMed] [Google Scholar]
- Berger I, Fitzgerald DJ, Richmond TJ. Baculovirus expression system for heterologous multiprotein complexes. Nat Biotechnol. 2004;22:1583–1587. doi: 10.1038/nbt1036. [DOI] [PubMed] [Google Scholar]
- Berman HM, Westbrook J, Feng Z, Gilliland G, Bhat TN, Weissig H, Shindyalov IN, Bourne PE. The Protein Data Bank. Nucleic Acids Res. 2000;28:235–242. doi: 10.1093/nar/28.1.235. [DOI] [PMC free article] [PubMed] [Google Scholar]
- Beroukhim R, Unwin N. Distortion correction of tubular crystals: improvements in the acetylcholine receptor structure. Ultramicroscopy. 1997;70:57–81. doi: 10.1016/s0304-3991(97)00070-3. [DOI] [PubMed] [Google Scholar]
- Berry IM, Dym O, Esnouf RM, Harlos K, Meged R, Perrakis A, Sussman JL, Walter TS, Wilson J, Messerschmidt A. SPINE high-throughput crystallization, crystal imaging and recognition techniques: current state, performance analysis, new technologies and future aspects. Acta Crystallogr D Biol Crystallogr. 2006;62:1137–1149. doi: 10.1107/S090744490602943X. [DOI] [PubMed] [Google Scholar]
- Blow D. Outline of Crystallography for Biologists. New York: Oxford University Press; 2002. [Google Scholar]
- Bond PJ, Sansom MSP. Bilayer deformation by the Kv channel voltage sensor domain revealed by self-assembly simulations. Proc Natl Acad Sci USA. 2007;104:2631–2636. doi: 10.1073/pnas.0606822104. [DOI] [PMC free article] [PubMed] [Google Scholar]
- Brejc K, van Dijk WJ, Klaassen RV, Schuurmans M, van der Oost J, Smit A, Sixma TK. Crystal Structure of an ACh-binding protein reveals the ligand-binding domain of nicotinic receptors. Nature. 2001;411:269–276. doi: 10.1038/35077011. [DOI] [PubMed] [Google Scholar]
- Brunger AT. Assessment of phase accuracy by cross validation: the free R value. Methods and applications. Acta Crystallogr D Biol Crystallogr. 1993;49:24–36. doi: 10.1107/S0907444992007352. [DOI] [PubMed] [Google Scholar]
- Carlomagno T. Ligand-target interactions: what can we learn from NMR? Annu Rev Biophys Biomol Struct. 2005;34:245–266. doi: 10.1146/annurev.biophys.34.040204.144419. [DOI] [PubMed] [Google Scholar]
- Celie PH, van Rossum-Fikkert SE, van Dijk WJ, Brejc K, Smit AB, Sixma TK. Nicotine and carbamylcholine binding to nicotinic acetylcholine receptors as studied in AChBP crystal structures. Neuron. 2004;41:907–914. doi: 10.1016/s0896-6273(04)00115-1. [DOI] [PubMed] [Google Scholar]
- Celie PH, Kasheverov IE, Mordvintsev DY, Hogg RC, van Nierop P, van Elk R, van Rossum-Fikkert SE, Zhmak MN, Bertrand D, Tsetlin V, et al. Crystal structure of nicotinic acetylcholine receptor homolog AChBP in complex with an alpha-conotoxin PnIA variant. Nat Struct Mol Biol. 2005a;12:582–588. doi: 10.1038/nsmb951. [DOI] [PubMed] [Google Scholar]
- Celie PH, Klaassen RV, van Rossum-Fikkert SE, van Elk R, van Nierop P, Smit AB, Sixma TK. Crystal structure of acetylcholine-binding protein from Bulinus truncatus reveals the conserved structural scaffold and sites of variation in nicotinic acetylcholine receptors. J Biol Chem. 2005b;280:26457–26466. doi: 10.1074/jbc.M414476200. [DOI] [PubMed] [Google Scholar]
- Chen YH, Li MH, Zhang Y, He LL, Yamada Y, Fitzmaurice A, Shen Y, Zhang H, Tong L, Yang J. Structural basis of the alpha1-beta subunit interaction of voltage-gated Ca2+ channels. Nature. 2004;429:675–680. doi: 10.1038/nature02641. [DOI] [PubMed] [Google Scholar]
- Chill JH, Louis JM, Baber JL, Bax A. Measurement of 15N relaxation in the detergent-solubilized tetrameric KcsA potassium channel. J Biomol NMR. 2006a;36:123–136. doi: 10.1007/s10858-006-9071-4. [DOI] [PubMed] [Google Scholar]
- Chill JH, Louis JM, Miller C, Bax A. NMR study of the tetrameric KcsA potassium channel in detergent micelles. Protein Sci. 2006b;15:684–698. doi: 10.1110/ps.051954706. [DOI] [PMC free article] [PubMed] [Google Scholar]
- Chiu W, Baker ML, Jiang W, Dougherty M, Schmid MF. Electron cryomicroscopy of biological machines at subnanometer resolution. Structure. 2005;13:363–372. doi: 10.1016/j.str.2004.12.016. [DOI] [PubMed] [Google Scholar]
- Chiu W, Baker ML, Almo SC. Structural biology of cellular machines. Trends Cell Biol. 2006;16:144–150. doi: 10.1016/j.tcb.2006.01.002. [DOI] [PubMed] [Google Scholar]
- Clackson T, Wells JA. A hot spot of binding energy in a hormone-receptor interface. Science. 1995;267:383–386. doi: 10.1126/science.7529940. [DOI] [PubMed] [Google Scholar]
- Clore GM, Gronenborn AM. NMR structure determination of proteins and protein complexes larger than 20 kDa. Curr Opin Chem Biol. 1998;2:564–570. doi: 10.1016/s1367-5931(98)80084-7. [DOI] [PubMed] [Google Scholar]
- Clore GM, Schwieters CD. Theoretical and computational advances in biomolecular NMR spectroscopy. Curr Opin Struct Biol. 2002;12:146–153. doi: 10.1016/s0959-440x(02)00302-0. [DOI] [PubMed] [Google Scholar]
- Craven KB, Zagotta WN. CNG and HCN channels: two peas, one pod. Annu Rev Physiol. 2006;68:375–401. doi: 10.1146/annurev.physiol.68.040104.134728. [DOI] [PubMed] [Google Scholar]
- Crystallography IU. International Tables for Crystallography, Brief Teaching Edition of Volume A, Space Group Symmetry. Fifth. A. Boston: Kluwer Academic Publishers; 2002. [Google Scholar]
- Dale GE, Oefner C, D'Arcy A. The protein as a variable in protein crystallization. J Struct Biol. 2003;142:88–97. doi: 10.1016/s1047-8477(03)00041-8. [DOI] [PubMed] [Google Scholar]
- Daly R, Hearn MT. Expression of heterologous proteins in Pichia pastoris: a useful experimental tool in protein engineering and production. J Mol Recognit. 2005;18:119–138. doi: 10.1002/jmr.687. [DOI] [PubMed] [Google Scholar]
- Dauter Z, Dauter M, Dodson E. Jolly SAD. Acta Crystallogr D Biol Crystallogr. 2002;58:494–506. doi: 10.1107/s090744490200118x. [DOI] [PubMed] [Google Scholar]
- Deisenhofer J, Epp O, Miki K, Huber R, Michel H. Structure of the protein subunits in the photosynthetic reaction center of Rhodopseudomonas viridis at 3 Å resolution. Nature. 1985;318:618–624. doi: 10.1038/318618a0. [DOI] [PubMed] [Google Scholar]
- Desrosiers DC, Peng ZY. A binding free energy hot spot in the ankyrin repeat protein GABPbeta mediated protein-protein interaction. J Mol Biol. 2005;354:375–384. doi: 10.1016/j.jmb.2005.09.045. [DOI] [PubMed] [Google Scholar]
- Dickerson RE. Present at the Flood: How Structural Molecular Biology Came About. Sunderland, MA: Sinauer Associates; 2005. [Google Scholar]
- Dodson E. Is it jolly SAD? Acta Crystallogr D Biol Crystallogr. 2003;59:1958–1965. doi: 10.1107/s0907444903020936. [DOI] [PubMed] [Google Scholar]
- Drenth J. Principles of Protein X-ray Crystallography. Second. New York: Springer-Verlag; 1999. [Google Scholar]
- Dutzler R, Campbell EB, Cadene M, Chait BT, MacKinnon R. X-ray structure of a ClC chloride channel at 3.0 A reveals the molecular basis of anion selectivity. Nature. 2002;415:287–294. doi: 10.1038/415287a. [DOI] [PubMed] [Google Scholar]
- Ealick SE. Advances in multiple wavelength anomalous diffraction crystallography. Curr Opin Chem Biol. 2000;4:495–499. doi: 10.1016/s1367-5931(00)00122-8. [DOI] [PubMed] [Google Scholar]
- Fabiola F, Chapman MS. Fitting of high-resolution structures into electron microscopy reconstruction images. Structure. 2005;13:389–400. doi: 10.1016/j.str.2005.01.007. [DOI] [PubMed] [Google Scholar]
- Faham S, Bowie JU. Bicelle crystallization: a new method for crystallizing membrane proteins yields a monomeric bacteriorhodopsin structure. J Mol Biol. 2002;316:1–6. doi: 10.1006/jmbi.2001.5295. [DOI] [PubMed] [Google Scholar]
- Fallon JL, Halling DB, Hamilton SL, Quiocho FA. Structure of calmodulin bound to the hydrophobic IQ domain of the cardiac Ca(v)1.2 calcium channel. Structure. 2005;13:1881–1886. doi: 10.1016/j.str.2005.09.021. [DOI] [PubMed] [Google Scholar]
- Ferentz AE, Wagner G. NMR spectroscopy: a multifaceted approach to macromolecular structure. Q Rev Biophys. 2000;33:29–65. doi: 10.1017/s0033583500003589. [DOI] [PubMed] [Google Scholar]
- Ferre-D'Amare AR, Burley SK. Use of dynamic light scattering to assess crystallizability of macromolecules and macromolecular assemblies. Structure. 1994;2:357–359. doi: 10.1016/s0969-2126(00)00037-x. [DOI] [PubMed] [Google Scholar]
- Fink AL. Natively unfolded proteins. Curr Opin Struct Biol. 2005;15:35–41. doi: 10.1016/j.sbi.2005.01.002. [DOI] [PubMed] [Google Scholar]
- Fitzgerald DJ, Berger P, Schaffitzel C, Yamada K, Richmond TJ, Berger I. Protein complex expression by using multigene baculoviral vectors. Nat Methods. 2006;3:1021–1032. doi: 10.1038/nmeth983. [DOI] [PubMed] [Google Scholar]
- Folta-Stogniew E, Williams KR. Determination of molecular masses of proteins in solution: implementation of an HPLC size exclusion chromatography and laser light scattering service in a core laboratory. J Biomol Tech. 1999;10:51–63. [PMC free article] [PubMed] [Google Scholar]
- Fotin A, Cheng Y, Sliz P, Grigorieff N, Harrison SC, Kirchhausen T, Walz T. Molecular model for a complete clathrin lattice from electron cryomicroscopy. Nature. 2004;432:573–579. doi: 10.1038/nature03079. [DOI] [PubMed] [Google Scholar]
- Fotin A, Kirchhausen T, Grigorieff N, Harrison SC, Walz T, Cheng Y. Structure determination of clathrin coats to subnanometer resolution by single particle cryo-electron microscopy. J Struct Biol. 2006;156:453–460. doi: 10.1016/j.jsb.2006.07.001. [DOI] [PMC free article] [PubMed] [Google Scholar]
- Furnham N, Blundell TL, DePristo MA, Terwilliger TC. Is one solution good enough? Nat Struct Mol Biol. 2006;13:184–185. doi: 10.1038/nsmb0306-184. [DOI] [PubMed] [Google Scholar]
- Furukawa H, Singh SK, Mancusso R, Gouaux E. Subunit arrangement and function in NMDA receptors. Nature. 2005;438:185–192. doi: 10.1038/nature04089. [DOI] [PubMed] [Google Scholar]
- Garman E. ‘Cool’ crystals: macromolecular cryocrystallography and radiation damage. Curr Opin Struct Biol. 2003;13:545–551. doi: 10.1016/j.sbi.2003.09.013. [DOI] [PubMed] [Google Scholar]
- Garman EF, Owen RL. Cryocooling and radiation damage in macromolecular crystallography. Acta Crystallogr D Biol Crystallogr. 2006;62:32–47. doi: 10.1107/S0907444905034207. [DOI] [PubMed] [Google Scholar]
- Geerlof A, Brown J, Coutard B, Egloff MP, Enguita FJ, Fogg MJ, Gilbert RJ, Groves MR, Haouz A, Nettleship JE, et al. The impact of protein characterization in structural proteomics. Acta Crystallogr D Biol Crystallogr. 2006;62:1125–1136. doi: 10.1107/S0907444906030307. [DOI] [PMC free article] [PubMed] [Google Scholar]
- Georgiou G, Segatori L. Preparative expression of secreted proteins in bacteria: status report and future prospects. Curr Opin Biotechnol. 2005;16:538–545. doi: 10.1016/j.copbio.2005.07.008. [DOI] [PubMed] [Google Scholar]
- Goto NK, Kay LE. New developments in isotope labeling strategies for protein solution NMR spectroscopy. Curr Opin Struct Biol. 2000;10:585–592. doi: 10.1016/s0959-440x(00)00135-4. [DOI] [PubMed] [Google Scholar]
- Gouaux E, Mackinnon R. Principles of selective ion transport in channels and pumps. Science. 2005;310:1461–1465. doi: 10.1126/science.1113666. [DOI] [PubMed] [Google Scholar]
- Gumbart J, Wang Y, Aksimentiev A, Tajkhorshid E, Schulten K. Molecular dynamics simulations of proteins in lipid bilayers. Curr Opin Struct Biol. 2005;15:423–431. doi: 10.1016/j.sbi.2005.07.007. [DOI] [PMC free article] [PubMed] [Google Scholar]
- Hansen SB, Sulzenbacher G, Huxford T, Marchot P, Taylor P, Bourne Y. Structures of Aplysia AChBP complexes with nicotinic agonists and antagonists reveal distinctive binding interfaces and conformations. EMBO J. 2005;24:3635–3646. doi: 10.1038/sj.emboj.7600828. [DOI] [PMC free article] [PubMed] [Google Scholar]
- Haurowitz F. Das Gleichgewicht zwischen Hämoglobin und Sauerstoff. Hoppe-Seyl Z Physiol Chem. 1938;254:266–272. [Google Scholar]
- Henderson R. Realizing the potential of electron cryo-microscopy. Q Rev Biophys. 2004;37:3–13. doi: 10.1017/s0033583504003920. [DOI] [PubMed] [Google Scholar]
- Hong M. Oligomeric structure, dynamics, and orientation of membrane proteins from solid-state NMR. Structure. 2006;14:1731–1740. doi: 10.1016/j.str.2006.10.002. [DOI] [PubMed] [Google Scholar]
- HWI (Hauptman-Woodward Medical Research Institute, Inc.) High Throughput Crystalization. 2007 http://www.hwi.buffalo.edu/High_Through/High_Through.html.
- Jeon H, Blacklow SC. Structure and physiologic function of the low-density lipoprotein receptor. Annu Rev Biochem. 2005;74:535–562. doi: 10.1146/annurev.biochem.74.082803.133354. [DOI] [PubMed] [Google Scholar]
- Jiang W, Ludtke SJ. Electron cryomicroscopy of single particles at subnanometer resolution. Curr Opin Struct Biol. 2005;15:571–577. doi: 10.1016/j.sbi.2005.08.004. [DOI] [PubMed] [Google Scholar]
- Jiang Y, Lee A, Chen J, Cadene M, Chait BT, MacKinnon R. Crystal structure and mechanism of a calcium-gated potassium channel. Nature. 2002;417:515–522. doi: 10.1038/417515a. [DOI] [PubMed] [Google Scholar]
- Jiang Y, Lee A, Chen J, Ruta V, Cadene M, Chait BT, MacKinnon R. X-ray structure of a voltage-dependent K+ channel. Nature. 2003;423:33–41. doi: 10.1038/nature01580. [DOI] [PubMed] [Google Scholar]
- Jidenko M, Nielsen RC, Sorensen TL, Moller JV, le Maire M, Nissen P, Jaxel C. Crystallization of a mammalian membrane protein overexpressed in Saccharomyces cerevisiae. Proc Natl Acad Sci USA. 2005;102:11687–11691. doi: 10.1073/pnas.0503986102. [DOI] [PMC free article] [PubMed] [Google Scholar]
- Jin X, Touhey J, Gaudet R. Structure of the N-terminal ankyrin repeat domain of the TRPV2 ion channel. J Biol Chem. 2006;281:25006–25010. doi: 10.1074/jbc.C600153200. [DOI] [PubMed] [Google Scholar]
- Karplus M, McCammon JA. Molecular dynamics simulations of biomolecules. Nat Struct Biol. 2002;9:646–652. doi: 10.1038/nsb0902-646. [DOI] [PubMed] [Google Scholar]
- Kay LE. NMR studies of protein structure and dynamics. J Magn Resn. 2005;173:193–207. doi: 10.1016/j.jmr.2004.11.021. [DOI] [PubMed] [Google Scholar]
- Kiselev NA, Sherman MB, Tsuprun VL. Negative staining of proteins. Electron Microsc Rev. 1990;3:43–72. doi: 10.1016/0892-0354(90)90013-i. [DOI] [PubMed] [Google Scholar]
- Kleywegt GJ, Jones TA. Phi/psi-chology: Ramachandran revisited. Structure. 1996;4:1395–1400. doi: 10.1016/s0969-2126(96)00147-5. [DOI] [PubMed] [Google Scholar]
- Kost TA, Condreay JP, Jarvis DL. Baculovirus as versatile vectors for protein expression in insect and mammalian cells. Nat Biotechnol. 2005;23:567–575. doi: 10.1038/nbt1095. [DOI] [PMC free article] [PubMed] [Google Scholar]
- Kriminski S, Kazierczak M, Thorne RE. Heat transfer from protein crystals: implications for flash-cooling and X-ray beam heating. Acta Crystallogr D Biol Crystallogr. 2003;D59:697–708. doi: 10.1107/s0907444903002713. [DOI] [PubMed] [Google Scholar]
- Kubo Y, Tateyama M. Towards a view of functioning dimeric metabotropic receptors. Curr Opin Neurobiol. 2005;15:289–295. doi: 10.1016/j.conb.2005.05.011. [DOI] [PubMed] [Google Scholar]
- Kunishima N, Shimada Y, Tsuji Y, Sato T, Yamamoto M, Kumasaka T, Nakanishi S, Jingami H, Morikawa K. Structural basis of glutamate recognition by a dimeric metabotropic glutamate receptor. Nature. 2000;407:971–977. doi: 10.1038/35039564. [DOI] [PubMed] [Google Scholar]
- Kuo A, Gulbis JM, Antcliff JF, Rahman T, Lowe ED, Zimmer J, Cuthbertson J, Ashcroft FM, Ezaki T, Doyle DA. Crystal structure of the potassium channel KirBac1.1 in the closed state. Science. 2003;300:1922–1926. doi: 10.1126/science.1085028. [DOI] [PubMed] [Google Scholar]
- Lamzin VS, Perrakis A. Current state of automated crystallographic data analysis. Nat Struct Biol Suppl. 2000;7:978–981. doi: 10.1038/80763. [DOI] [PubMed] [Google Scholar]
- Lange A, Giller K, Hornig S, Martin-Eauclaire MF, Pongs O, Becker S, Baldus M. Toxin-induced conformational changes in a potassium channel revealed by solid-state NMR. Nature. 2006;440:959–962. doi: 10.1038/nature04649. [DOI] [PubMed] [Google Scholar]
- Leavitt S, Freire E. Direct measurement of protein binding energetics by isothermal titration calorimetry. Curr Opin Struct Biol. 2001;11:560–566. doi: 10.1016/s0959-440x(00)00248-7. [DOI] [PubMed] [Google Scholar]
- Lee SY, Lee A, Chen J, MacKinnon R. Structure of the KvAP voltage-dependent K+ channel and its dependence on the lipid membrane. Proc Natl Acad Sci USA. 2005;102:15441–15446. doi: 10.1073/pnas.0507651102. [DOI] [PMC free article] [PubMed] [Google Scholar]
- Lo Conte L, Chothia C, Janin J. The atomic structure of protein-protein recognition sites. J Mol Biol. 1999;285:2177–2198. doi: 10.1006/jmbi.1998.2439. [DOI] [PubMed] [Google Scholar]
- Long SB, Campbell EB, Mackinnon R. Crystal structure of a mammalian voltage-dependent Shaker family K+ channel. Science. 2005;309:897–903. doi: 10.1126/science.1116269. [DOI] [PubMed] [Google Scholar]
- Luca S, Heise H, Baldus M. High-resolution solid-state NMR applied to polypeptides and membrane proteins. Acc Chem Res. 2003;36:858–865. doi: 10.1021/ar020232y. [DOI] [PubMed] [Google Scholar]
- Macauley-Patrick S, Fazenda ML, McNeil B, Harvey LM. Heterologous protein production using the Pichia pastoris expression system. Yeast. 2005;22:249–270. doi: 10.1002/yea.1208. [DOI] [PubMed] [Google Scholar]
- Mayer ML. Crystal structures of the GluR5 and GluR6 ligand binding cores: molecular mechanisms underlying kainate receptor selectivity. Neuron. 2005a;45:539–552. doi: 10.1016/j.neuron.2005.01.031. [DOI] [PubMed] [Google Scholar]
- Mayer ML. Glutamate receptor ion channels. Curr Opin Neurobiol. 2005b;15:282–288. doi: 10.1016/j.conb.2005.05.004. [DOI] [PubMed] [Google Scholar]
- Mayer ML, Ghosal A, Dolman NP, Jane DE. Crystal structures of the kainate receptor GluR5 ligand binding core dimer with novel GluR5-selective antagonists. J Neurosci. 2006;26:2852–2861. doi: 10.1523/JNEUROSCI.0123-06.2005. [DOI] [PMC free article] [PubMed] [Google Scholar]
- McCleverty CJ, Koesema E, Patapoutian A, Lesley SA, Kreusch A. Crystal structure of the human TRPV2 channel ankyrin repeat domain. Protein Sci. 2006;15:2201–2206. doi: 10.1110/ps.062357206. [DOI] [PMC free article] [PubMed] [Google Scholar]
- McDermott AE. Structural and dynamic studies of proteins by solid-state NMR spectroscopy: rapid movement forward. Curr Opin Struct Biol. 2004;14:554–561. doi: 10.1016/j.sbi.2004.09.007. [DOI] [PubMed] [Google Scholar]
- McPherson A. Crystallization of Biological Macromolecules. Cold Spring Harbor, NY: Cold Spring Harbor Press; 1999. [Google Scholar]
- McPherson A. Introduction to protein crystallization. Methods. 2004;34:254–265. doi: 10.1016/j.ymeth.2004.03.019. [DOI] [PubMed] [Google Scholar]
- Meyer S, Savaresi S, Forster IC, Dutzler R. Nucleotide recognition by the cytoplasmic domain of the human chloride transporter ClC-5. Nat Struct Mol Biol. 2007;14:60–67. doi: 10.1038/nsmb1188. [DOI] [PubMed] [Google Scholar]
- Mittermaier A, Kay LE. New tools provide insight in NMR studies of protein dynamics. Science. 2006;312:224–228. doi: 10.1126/science.1124964. [DOI] [PubMed] [Google Scholar]
- Miyazawa A, Fujiyoshi Y, Unwin N. Structure and gating mechanism of the acetylcholine receptor pore. Nature. 2003;423:949–955. doi: 10.1038/nature01748. [DOI] [PubMed] [Google Scholar]
- Morais Cabral JH, Lee A, Cohen SL, Chait BT, Li M, Mackinnon R. Crystal structure and functional analysis of the HERG potassium channel N terminus: a eukaryotic PAS domain. Cell. 1998;95:649–655. doi: 10.1016/s0092-8674(00)81635-9. [DOI] [PubMed] [Google Scholar]
- Mosser G. Two-dimensional crystallogenesis of transmembrane proteins. Micron. 2001;32:517–540. doi: 10.1016/s0968-4328(00)00047-0. [DOI] [PubMed] [Google Scholar]
- Mueller-Dieckmann J. The open-access high-throughput crystallization facility at EMBL Hamburg. Acta Crystallogr D Biol Crystallogr. 2006;62:1446–1452. doi: 10.1107/S0907444906038121. [DOI] [PubMed] [Google Scholar]
- Nakagawa T, Cheng Y, Ramm E, Sheng M, Walz T. Structure and different conformational states of native AMPA receptor complexes. Nature. 2005;433:545–549. doi: 10.1038/nature03328. [DOI] [PubMed] [Google Scholar]
- Nishida M, MacKinnon R. Structural basis of inward rectification: cytoplasmic pore of the G protein-gated inward rectifier GIRK1 at 1.8 A resolution. Cell. 2002;111:957–965. doi: 10.1016/s0092-8674(02)01227-8. [DOI] [PubMed] [Google Scholar]
- Nishida N, Xie C, Shimaoka M, Cheng Y, Walz T, Springer TA. Activation of leukocyte beta2 integrins by conversion from bent to extended conformations. Immunity. 2006;25:583–594. doi: 10.1016/j.immuni.2006.07.016. [DOI] [PubMed] [Google Scholar]
- Nollert P, Navarro J, Landau EM. Crystallization of membrane proteins in cubo. Methods Enzymol. 2002;343:183–199. doi: 10.1016/s0076-6879(02)43135-7. [DOI] [PubMed] [Google Scholar]
- Nooren IM, Thornton JM. Diversity of protein-protein interactions. EMBO J. 2003;22:3486–3492. doi: 10.1093/emboj/cdg359. [DOI] [PMC free article] [PubMed] [Google Scholar]
- Opatowsky Y, Chen CC, Campbell KP, Hirsch JA. Structural analysis of the voltage-dependent calcium channel beta subunit functional core and its complex with the alpha1 interaction domain. Neuron. 2004;42:387–399. doi: 10.1016/s0896-6273(04)00250-8. [DOI] [PubMed] [Google Scholar]
- Orlova EV, Saibil HR. Structure determination of macromolecular assemblies by single-particle analysis of cryo-electron micrographs. Curr Opin Struct Biol. 2004;14:584–590. doi: 10.1016/j.sbi.2004.08.004. [DOI] [PubMed] [Google Scholar]
- Palczewski K, Kumasaka T, Hori T, Behnke CA, Motoshima H, Fox BA, Le Trong I, Teller DC, Okada T, Stenkamp RE, et al. Crystal structure of rhodopsin: A G protein-coupled receptor. Science. 2000;289:739–745. doi: 10.1126/science.289.5480.739. [DOI] [PubMed] [Google Scholar]
- Pellecchia M. Solution nuclear magnetic resonance spectroscopy techniques for probing intermolecular interactions. Chem Biol. 2005;12:961–971. doi: 10.1016/j.chembiol.2005.08.013. [DOI] [PubMed] [Google Scholar]
- Perutz M. Science Is Not a Quiet Life: Unravelling the Atomic Mechanism of Haemoglobin. Singapore: World Scientific Publishing Co. Pte. Ltd.; 1997. [Google Scholar]
- Petsko GA, Ringe D. Protein Structure and Function. London: New Science Press, Ltd.; 2003. [Google Scholar]
- Pioletti M, Findeisen F, Hura GL, Minor DL., Jr Three-dimensional structure of the KChIP1-Kv4.3 T1 complex reveals a cross-shaped octamer. Nat Struct Mol Biol. 2006;13:987–995. doi: 10.1038/nsmb1164. [DOI] [PMC free article] [PubMed] [Google Scholar]
- Prilusky J, Felder CE, Zeev-Ben-Mordehai T, Rydberg EH, Man O, Beckmann JS, Silman I, Sussman JL. FoldIndex: a simple tool to predict whether a given protein sequence is intrinsically unfolded. Bioinformatics. 2005;21:3435–3438. doi: 10.1093/bioinformatics/bti537. [DOI] [PubMed] [Google Scholar]
- Radaev S, Li S, Sun PD. A survey of protein-protein complex crystallizations. Acta Crystallogr D Biol Crystallogr. 2006;62:605–612. doi: 10.1107/S0907444906011735. [DOI] [PubMed] [Google Scholar]
- Raman P, Cherezov V, Caffrey M. The membrane protein data bank. Cell Mol Life Sci. 2006;63:36–51. doi: 10.1007/s00018-005-5350-6. [DOI] [PMC free article] [PubMed] [Google Scholar]
- Renault L, Chou HT, Chiu PL, Hill RM, Zeng X, Gipson B, Zhang ZY, Cheng A, Unger V, Stahlberg H. Milestones in electron crystallography. J Comput Aided Mol Des. 2006;20:519–527. doi: 10.1007/s10822-006-9075-x. [DOI] [PMC free article] [PubMed] [Google Scholar]
- Rhodes G. Crystallography Made Crystal Clear: A Guide for Users of Macromolecular Model. Third. Burlington, MA: Academic Press; 2006. [Google Scholar]
- Rodgers DW. Cryocrystallography. Structure. 1994;2:1135–1140. doi: 10.1016/s0969-2126(94)00116-2. [DOI] [PubMed] [Google Scholar]
- Romier C, Ben Jelloul M, Albeck S, Buchwald G, Busso D, Celie PH, Christodoulou E, De Marco V, van Gerwen S, Knipscheer P, et al. Co-expression of protein complexes in prokaryotic and eukaryotic hosts: experimental procedures, database tracking and case studies. Acta Crystallogr D Biol Crystallogr. 2006;62:1232–1242. doi: 10.1107/S0907444906031003. [DOI] [PubMed] [Google Scholar]
- Roosild TP, Le KT, Choe S. Cytoplasmic gatekeepers of K+-channel flux: a structural perspective. Trends Biochem Sci. 2004;29:39–45. doi: 10.1016/j.tibs.2003.11.008. [DOI] [PubMed] [Google Scholar]
- Rosenberg OS, Deindl S, Sung RJ, Nairn AC, Kuriyan J. Structure of the autoinhibited kinase domain of CaMKII and SAXS analysis of the holoenzyme. Cell. 2005;123:849–860. doi: 10.1016/j.cell.2005.10.029. [DOI] [PubMed] [Google Scholar]
- Rosenthal PB, Henderson R. Optimal determination of particle orientation, absolute hand, and contrast loss in single-particle electron cryomicroscopy. J Mol Biol. 2003;333:721–745. doi: 10.1016/j.jmb.2003.07.013. [DOI] [PubMed] [Google Scholar]
- Roux B. Ion conduction and selectivity in K+ channels. Annu Rev Biophys Biomol Struct. 2005;34:153–171. doi: 10.1146/annurev.biophys.34.040204.144655. [DOI] [PubMed] [Google Scholar]
- Schumacher MA, Rivard AF, Bachinger HP, Adelman JP. Structure of the gating domain of a Ca2+-activated K+ channel complexed with Ca2+/calmodulin. Nature. 2001;410:1120–1124. doi: 10.1038/35074145. [DOI] [PubMed] [Google Scholar]
- Shi N, Ye S, Alam A, Chen L, Jiang Y. Atomic structure of a Na+- and K+-conducting channel. Nature. 2006;440:570–574. doi: 10.1038/nature04508. [DOI] [PubMed] [Google Scholar]
- Sixma TK, Smit AB. Acetylcholine binding protein (AChBP): a secreted glial protein that provides a high-resolution model for the extracellular domain of pentameric ligand-gated ion channels. Annu Rev Biophys Biomol Struct. 2003;32:311–334. doi: 10.1146/annurev.biophys.32.110601.142536. [DOI] [PubMed] [Google Scholar]
- Stock D, Perisic O, Lowe J. Robotic nanolitre protein crystallisation at the MRC Laboratory of Molecular Biology. Prog Biophys Mol Biol. 2005;88:311–327. doi: 10.1016/j.pbiomolbio.2004.07.009. [DOI] [PubMed] [Google Scholar]
- Striebeck M. Membrane Proteins of Known Structure. 2006 http://www.mpibp-frankfurt.mpg.de/michel/public/memprotstruct.html.
- Sun Y, Olson R, Horning M, Armstrong N, Mayer M, Gouaux E. Mechanism of glutamate receptor desensitization. Nature. 2002;417:245–253. doi: 10.1038/417245a. [DOI] [PubMed] [Google Scholar]
- Svergun DI, Koch MH. Advances in structure analysis using small-angle scattering in solution. Curr Opin Struct Biol. 2002;12:654–660. doi: 10.1016/s0959-440x(02)00363-9. [DOI] [PubMed] [Google Scholar]
- Svergun DI, Koch MHJ. Small-angle scattering studies of biological macromolecules in solution. Rep Prog Phys. 2003;66:1735–1782. [Google Scholar]
- Svergun DI, Barberato C, Koch MHJ. CRYSOL - a program to evaluate X-ray solution scattering of biological macromolecules from atomic coordinates. J Appl Crystallogr. 1995;28:768–773. [Google Scholar]
- Svergun DI, Petoukhov MV, Koch MH. Determination of domain structure of proteins from X-ray solution scattering. Biophys J. 2001;80:2946–2953. doi: 10.1016/S0006-3495(01)76260-1. [DOI] [PMC free article] [PubMed] [Google Scholar]
- Takeuchi K, Wagner G. NMR studies of protein interactions. Curr Opin Struct Biol. 2006;16:109–117. doi: 10.1016/j.sbi.2006.01.006. [DOI] [PubMed] [Google Scholar]
- Tama F, Brooks CL. Symmetry, form, and shape: guiding principles for robustness in macromolecular machines. Annu Rev Biophys Biomol Struct. 2006;35:115–133. doi: 10.1146/annurev.biophys.35.040405.102010. [DOI] [PubMed] [Google Scholar]
- Taylor G. The phase problem. Acta Crystallogr D Biol Crystallogr. 2003;59:1881–1890. doi: 10.1107/s0907444903017815. [DOI] [PubMed] [Google Scholar]
- Terpe K. Overview of bacterial expression systems for heterologous protein production: from molecular and biochemical fundamentals to commercial systems. Appl Microbiol Biotechnol. 2006;72:211–222. doi: 10.1007/s00253-006-0465-8. [DOI] [PubMed] [Google Scholar]
- Tombola F, Pathak MM, Isacoff EY. How does voltage open an ion channel? Annu Rev Cell Dev Biol. 2006;22:23–52. doi: 10.1146/annurev.cellbio.21.020404.145837. [DOI] [PubMed] [Google Scholar]
- Tornroth-Horsefield S, Wang Y, Hedfalk K, Johanson U, Karlsson M, Tajkhorshid E, Neutze R, Kjellbom P. Structural mechanism of plant aquaporin gating. Nature. 2006;439:688–694. doi: 10.1038/nature04316. [DOI] [PubMed] [Google Scholar]
- Toyoshima C, Nakasako M, Nomura H, Ogawa H. Crystal structure of the calcium pump of sarcoplasmic reticulum at 2.6 A resolution. Nature. 2000;405:647–655. doi: 10.1038/35015017. [DOI] [PubMed] [Google Scholar]
- Toyoshima C, Nomura H, Tsuda T. Lumenal gating mechanism revealed in calcium pump crystal structures with phosphate analogues. Nature. 2004;432:361–368. doi: 10.1038/nature02981. [DOI] [PubMed] [Google Scholar]
- Tsuchiya D, Kunishima N, Kamiya N, Jingami H, Morikawa K. Structural views of the ligand-binding cores of a metabotropic glutamate receptor complexed with an antagonist and both glutamate and Gd3+ Proc Natl Acad Sci USA. 2002;99:2660–2665. doi: 10.1073/pnas.052708599. [DOI] [PMC free article] [PubMed] [Google Scholar]
- Tugarinov V, Hwang PM, Kay LE. Nuclear magnetic resonance spectroscopy of high-molecular-weight proteins. Annu Rev Biochem. 2004;73:107–146. doi: 10.1146/annurev.biochem.73.011303.074004. [DOI] [PubMed] [Google Scholar]
- Tzakos AG, Grace CR, Lukavsky PJ, Riek R. NMR techniques for very large proteins and RNAs in solution. Annu Rev Biophys Biomol Struct. 2006;35:319–342. doi: 10.1146/annurev.biophys.35.040405.102034. [DOI] [PubMed] [Google Scholar]
- Ulens C, Hogg RC, Celie PH, Bertrand D, Tsetlin V, Smit AB, Sixma TK. Structural determinants of selective alpha-conotoxin binding to a nicotinic acetylcholine receptor homolog AChBP. Proc Natl Acad Sci USA. 2006;103:3615–3620. doi: 10.1073/pnas.0507889103. [DOI] [PMC free article] [PubMed] [Google Scholar]
- Unwin N. Acetylcholine receptor channel imaged in the open state. Nature. 1995;373:37–43. doi: 10.1038/373037a0. [DOI] [PubMed] [Google Scholar]
- Valentine ER, Palmer AGI. Microsecond-to-millisecond conformational dynamics demarcate the GluR2 glutamate receptor bound to agonists glutamate, quisqualate, and AMPA. Biochemistry. 2005;44:3410–3417. doi: 10.1021/bi047984f. [DOI] [PubMed] [Google Scholar]
- Van Petegem F, Minor DL. The structural biology of voltage-gated calcium channel function and regulation. Biochem Soc Trans. 2006;34:887–893. doi: 10.1042/BST0340887. [DOI] [PMC free article] [PubMed] [Google Scholar]
- Van Petegem F, Clark KA, Chatelain FC, Minor DL., Jr Structure of a complex between a voltage-gated calcium channel beta-subunit and an alpha-subunit domain. Nature. 2004;429:671–675. doi: 10.1038/nature02588. [DOI] [PMC free article] [PubMed] [Google Scholar]
- Van Petegem F, Chatelain FC, Minor DL., Jr Insights into voltage-gated calcium channel regulation from the structure of the CaV1.2 IQ domain-Ca2+/calmodulin complex. Nat Struct Mol Biol. 2005;12:1108–1115. doi: 10.1038/nsmb1027. [DOI] [PMC free article] [PubMed] [Google Scholar]
- Velazquez Campoy A, Freire E. ITC in the post-genomic era.? Priceless. Biophys Chem. 2005;115:115–124. doi: 10.1016/j.bpc.2004.12.015. [DOI] [PubMed] [Google Scholar]
- Vourc'h P, Andres C. Oligodendrocyte myelin glycoprotein (OMgp): evolution, structure and function. Brain Res Brain Res Rev. 2004;45:115–124. doi: 10.1016/j.brainresrev.2004.01.003. [DOI] [PubMed] [Google Scholar]
- Wagner S, Bader ML, Drew D, de Gier JW. Rationalizing membrane protein overexpression. Trends Biotechnol. 2006;24:364–371. doi: 10.1016/j.tibtech.2006.06.008. [DOI] [PubMed] [Google Scholar]
- Wang H, Yan Y, Liu Q, Huang Y, Shen Y, Chen L, Chen Y, Yang Q, Hao Q, Wang K, Chai J. Structural basis for modulation of Kv4 K(+) channels by auxiliary KChIP subunits. Nat Neurosci. 2007;10:32–39. doi: 10.1038/nn1822. [DOI] [PubMed] [Google Scholar]
- Waugh DS. Making the most of affinity tags. Trends Biotechnol. 2005;23:316–320. doi: 10.1016/j.tibtech.2005.03.012. [DOI] [PubMed] [Google Scholar]
- Wells JA. Systematic mutational analyses of protein-protein interfaces. Methods Enzymol. 1991;202:390–411. doi: 10.1016/0076-6879(91)02020-a. [DOI] [PubMed] [Google Scholar]
- Wen J, Arakawa T, Philo JS. Size-exclusion chromatography with on-line light-scattering, absorbance, and refractive index detectors for studying proteins and their interactions. Anal Biochem. 1996;240:155–166. doi: 10.1006/abio.1996.0345. [DOI] [PubMed] [Google Scholar]
- White S. Membrane Proteins of Known Structure. 2007 http://blanco.biomol.uci.edu/Membrane_Proteins_xtal.html.
- Wiener MC. A pedestrian guide to membrane protein crystallization. Methods. 2004;34:364–372. doi: 10.1016/j.ymeth.2004.03.025. [DOI] [PubMed] [Google Scholar]
- Wiesmann C, de Vos AM. Nerve growth factor: structure and function. Cell Mol Life Sci. 2001;58:748–759. doi: 10.1007/PL00000898. [DOI] [PMC free article] [PubMed] [Google Scholar]
- Wilson WW. Light scattering as a diagnostic for protein crystal growth–a practical approach. J Struct Biol. 2003;142:56–65. doi: 10.1016/s1047-8477(03)00038-8. [DOI] [PubMed] [Google Scholar]
- Wüthrich K. NMR of Proteins and Nucleic Acids. New York: J. Wiley & Sons; 1986. [Google Scholar]
- Yamaguchi H, Matsushita M, Nairn AC, Kuriyan J. Crystal structure of the atypical protein kinase domain of a TRP channel with phosphotransferase activity. Mol Cell. 2001;7:1047–1057. doi: 10.1016/s1097-2765(01)00256-8. [DOI] [PubMed] [Google Scholar]
- Yamashita A, Singh SK, Kawate T, Jin Y, Gouaux E. Crystal structure of a bacterial homologue of Na+/Cl–dependent neurotransmitter transporters. Nature. 2005;437:215–223. doi: 10.1038/nature03978. [DOI] [PubMed] [Google Scholar]
- Yernool D, Boudker O, Jin Y, Gouaux E. Structure of a glutamate transporter homologue from Pyrococcus horikoshii. Nature. 2004;431:811–818. doi: 10.1038/nature03018. [DOI] [PubMed] [Google Scholar]
- Zagotta WN, Olivier NB, Black KD, Young EC, Olson R, Gouaux E. Structural basis for modulation and agonist specificity of HCN pacemaker channels. Nature. 2003;425:200–205. doi: 10.1038/nature01922. [DOI] [PubMed] [Google Scholar]
- Zhou Y, Morais-Cabral JH, Kaufman A, MacKinnon R. Chemistry of ion coordination and hydration revealed by a K+ channel-Fab complex at 2.0 A resolution. Nature. 2001;414:43–48. doi: 10.1038/35102009. [DOI] [PubMed] [Google Scholar]