Abstract
The effect of a solvation on the thermodynamics and kinetics of polyalanine (Ala12) is explored on the basis of its energy landscapes in vacuum and in an aqueous solution. Both energy landscapes are characterized by two basins, one associated with α-helical structures and the other with coil and β-structures of the peptide. In both environments, the basin that corresponds to the α-helical structure is considerably narrower than the basin corresponding to the β-state, reflecting their different contributions to the entropy of the peptide. In vacuum, the α-helical state of Ala12 constitutes the native state, in agreement with common helical propensity scales, whereas in the aqueous medium, the α-helical state is destabilized, and the β-state becomes the native state. Thus solvation has a dramatic effect on the energy landscape of this peptide, resulting in an inverted stability of the two states. Different folding and unfolding time scales for Ala12 in hydrophilic and hydrophobic chemical environments are caused by the higher entropy of the native state in water relative to vacuum. The concept of a helical propensity has to be extended to incorporate environmental solvent effects.
The chemical environment exerts a fundamental influence on the structure, thermodynamics, and dynamics of polypeptides. Particularly, the solvent may affect the dynamics and structure of the polypeptide and consequently alter its function, as has been demonstrated in a variety of biologically important phenomena, ranging from the rate of oxygen uptake in myoglobin to the stabilization of opposite- charged side-chain pairs at the surface of proteins (1, 2). The variance of the properties of a polypeptide in different solvents depends on the nature of the solvent–polypeptide intermolecular interactions, which lead to a rich repertoire of phenomena. These interactions involve the effect of organic solvents on the destabilization of the hydrophobic core and the exposure of side chains, as well as the opposite effects of aqueous solvents on the protein structures favoring the hydrophilic protein surface and the hydrophobic core (1, 3). Theoretical and computational evidence (4–6) for medium effects on polypeptide structures has accumulated. Following the Zimm–Bragg theory of the helix–coil equilibrium (7), it has been established that short polypeptides should not form helices in water. Indeed, numerous studies report that the relative tendency for helix formation in water is low at physiological temperatures (6, 8).
The structure of polyalanine peptides is of considerable interest as, in general, regardless of specific chemical environments, the commonly reported secondary structure propensity scales for amino acids (9–11) rank alanine as having the highest α-helical propensity. However, experimental (12–14) and computational (4–6, 15–23) studies showed that polyalanines tend to adopt random-coil conformations in aqueous solution. The ambiguity of the helical propensities, even for alanine, which is known as an excellent helix former, may indicate that these helical propensity scales do not reflect the intrinsic properties of individual residues irrespective of the environment, and that solvent effects have to be taken into account.
The thermodynamics and kinetics of a protein are determined by its energy landscape (24, 25). The relation between energy landscapes and kinetics of complex systems, e.g., clusters (26, 27) and proteins (28), is being explored in terms of a master equation. Previous studies by Y.L. and O.M.B. showed how structural constraints (29, 30) and several specific point mutations (31) affect the topography and topology of the energy landscape of peptides and proteins. Medium effects on the energy landscape of peptides will elucidate the features of solvation on the structure, thermodynamics, and dynamics of these complex systems.
In this paper, we report the observation of dramatically different energy landscapes of a peptide (dodecaalanine, Ala12) in vacuum and in water, which reflects the different environmental chemical properties of its kinetics and thermodynamic stability in hydrophobic and hydrophilic solvents. Polyalanine was chosen to explore the effect of solvent on the energy landscape, because previous experimental (12–14) and computational (4–6, 15–23) studies demonstrate its structural sensitivity to the solvent environment. Two energy landscapes of Ala12 are presented. The first corresponds to the peptide conformational space in vacuum and represents the peptide energy landscape in a hydrophobic medium. The second corresponds to the conformational space in an implicit water solvent and represents the peptide landscape in aqueous solution. A solvent-induced switchover from the native α-helical state in vacuum to the native β-state in aqueous solution is manifested, whereas the implications of the environmentally inverted stability for the thermodynamics and dynamics of this peptide are explored.
Methods
Reconstruction of an energy landscape relies on collecting a large sample of conformations, minimizing each of them to the nearest locally stable minima, and then using these local minima to characterize the landscape. To obtain an overview of the molecular energy landscape accessible to the polyalanine at physiological temperatures, we sample the conformation space of Ala12 in each environment by using a high-temperature molecular dynamics trajectory. To ensure that the conformational sample will cover the entire conformation space available to the peptide, we started the high-temperature molecular dynamics trajectory from two distinct Ala12 conformers: an ideal α-helix and a β-hairpin.
Technically, in each environment the sampling procedure includes two 1-ns molecular dynamics trajectories [performed with the charmm program (32)], one at 400 K and one at 500 K, for each of the two starting structures. Conformations are sampled every 4 ps along the high-temperature trajectories, resulting in a total of 1,000 conformations of Ala12 in each environment. The protocols of the simulations are similar to those used in previous work (29, 30). The simulations for Ala12 in water used the EEF1 implicit solvation model to take into account the solvent effect (33, 34). The EEF1 expresses the solvation free energy as a sum over group contributions, where the solvation free energy of each group is corrected for screening by the surrounding groups. In addition to the sampling simulations, two 350-K trajectories in vacuum, as well as two 350-K trajectories in water, were performed to study the folding and unfolding kinetics of the system in these environments. The folding trajectory started from a β-hairpin conformation (0% α-helical and 83% β-sheet), and the unfolding trajectory started from an α-helical conformation (100% α-helical and 0% β-sheet). The transition time of the folding reaction, β→α, was defined as the first passage time (τ) from the β-hairpin to an α-helical structure with 100% α-helical content. Similarly, the transition time of the unfolding reaction, α→β, was defined as the time required to unwind the helix and to obtain a structure with 0% α-helical content and 83% β-sheet. The α-helical and β-sheet contents of any conformation of the conformation samples and of the folding/unfolding trajectories were calculated by using the dssp program (35). In addition, to estimate the effect of solvation on the stability of the two states of Ala12 in vacuum, we collected 200 α-helical conformations and 200 β-hairpin conformations of Ala12, each sampled along 0.4-ns trajectories at 300 K by using vacuum, the EEF1 implicit solvation model, and the TIP3P explicit water models (36).
The construction of the energy landscapes and the projections of the folding and unfolding trajectories onto a low-dimensional subspace (37–39) were obtained by applying the principal component analysis method (PCA) (38, 39). In this study, we use the root-mean-square distance of the backbone heavy atoms as the distance measure between conformations composed of the conformation samples in vacuum and in solvent. In this case, the principal two-dimensional subspace was found to represent the multidimensional data to an accuracy greater than 50%.
Solvent Effect on the Flexibility of Ala12.
The flexibility of polypeptides in different solvents is expected to differ because of the different type of intermolecular interactions between the solvent and peptide molecules. For example, whereas the α-helical state of polyalanine is stable in organic media (4, 19, 23), its stability decreases in aqueous solutions, because water molecules interact with the peptide polar groups, which form the CO(i)→NH(i + 4) hydrogen bonds. Inevitably, the destabilization of the α-helix hydrogen bonds may result in destabilization and even unwinding of the entire polyalanine α-helix. Accordingly, the helical conformation of polyalanine may be more dominant in an organic medium than in water, whereas the coil structures, in which the polar groups are exposed to the solvent, are likely to be more accessible in water than in organic medium. The larger the number of conformations that a peptide can adopt, the larger are its entropy and flexibility.
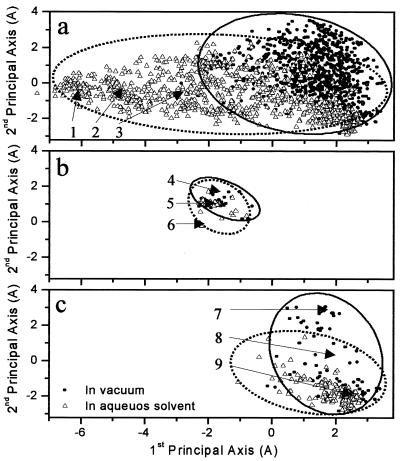
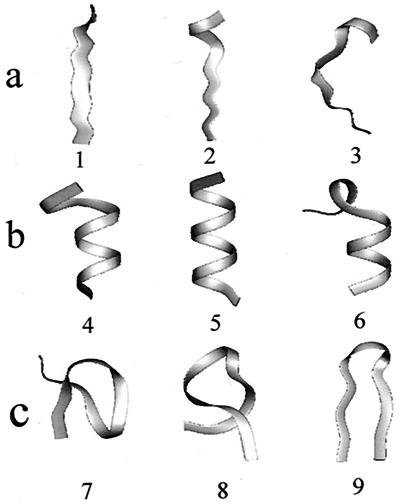
The flexibility of Ala12 in each environment can be represented by the volume of conformation space that it occupies in that specific environment. To span the entire conformation space accessible to Ala12 in each environment, we sampled conformations by simulating the peptide at high temperatures (400 K and 500 K) starting from both α-helical and β-sheet conformations. This sampling procedure was selected to overcome energetic and entropic barriers. The sampled conformations were annealed back to 300 K to ensure that the resulting conformations are accessible at physiological temperatures. The multidimensional conformation spaces of Ala12 in vacuum and in aqueous solvent were jointly projected onto the same three-dimensional subspace as shown in Fig. 1a. A comparison between the relative volume of each conformation sample and their overlap clearly outlines the effect of solvent on the flexibility of the peptide. For Ala12, a larger volume of conformation space is accessible in the aqueous solvent than in vacuum, indicating that in water the peptide can adopt conformations that are unlikely in vacuum. Fig. 2a shows three of the conformations sampled in an aqueous environment selected from the region that does not overlap with the conformation space of Ala12 in vacuum. These structures illustrate that the larger flexibility of Ala12 in aqueous solution is mainly because of unwinding of the helix and a solvation of all backbone polar groups that were involved in the stabilization of the α-helix. In water, random-coil structures are reasonable because the loss of intramolecular interaction is compensated by intermolecular interactions with water molecules.
Figure 1.
A joint two-dimensional projection of the conformation space of Ala12. (a) Conformations sampled in vacuum (full circles) and with implicit water molecules (empty triangles). (b) Conformations in both samples with α-helical content larger than 50%. (c) Conformations in both samples with β-sheet content larger than 50%. Ellipses are drawn to emphasize the Ala12 conformations in vacuum (solid line) and in solvent (dashed line). Conformations 1–9 are shown in Fig. 2.
Figure 2.
Conformations of Ala12. (a) Conformations selected from the region in the conformation space, which is accessible only in an aqueous solvent (Fig. 1a). (b) Conformations selected from the region of α-helical conformations (Fig. 1b). (c) Conformations selected from the region of β-sheet conformations (Fig. 1c).
A partial projection of only those conformations (in both conformation samples) that have an α-helical content larger than 50% is shown in Fig. 1b. A partial projection of conformations (in both conformation samples) that are characterized by a β-sheet content larger than 50% is shown in Fig. 1c. The relatively smaller region of the helical conformations in both conformation spaces (Fig. 1b) in comparison to the region of β-sheet conformations (Fig. 1c) indicates that helical structures are much more rigid than β-hairpin structures. Moreover, whereas the regions corresponding to α-helical conformations sampled in vacuum and in aqueous solvent significantly overlap, as expected, less overlap is observed between the regions corresponding to β-sheet structures. Three α-helical conformations of Ala12 placed in the α-helical region (Fig. 1b) are shown in Fig. 2b. Similarly, Fig. 2c shows three β-structures selected from the corresponding region in conformation spaces (Fig. 1c). These structures illustrate the larger flexibility of the β-sheet in comparison with the α-helical structures.
The accessibility and equilibrium population of the α-helical and the β-sheet structures of both conformational samples, in vacuum and in aqueous solution, is expected to be different because their relative stability and the barrier heights that separate them are affected by the environment. Only the energy landscape can explain the relative stability of the conformations of the sampled conformation space and the dynamics between them. For Ala12 in vacuum as well as in water, the energy landscape can be constructed, being based on the conformational samples, by plotting the energy of each conformation versus the geometrical axes obtained by applying the PCA procedure (38).
Energy Landscape of Ala12 in Vacuum.
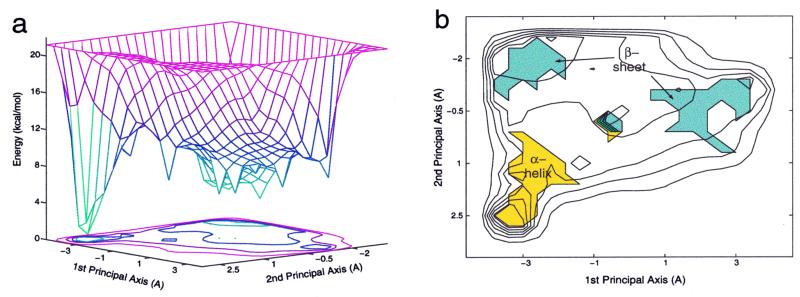
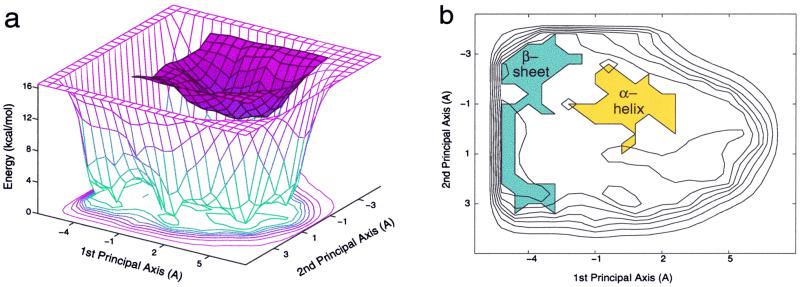
The energy landscape of Ala12 in vacuum (Fig. 3a) is composed of two main basins. One basin is shallow and broad, and the other is narrow and deep. In fact, these two basins, which are different in energy, correspond to conformations with different secondary structures. The broad and shallow basin mainly corresponds to coil and β-structures, whereas the narrow and deep basin corresponds to α-helical conformations (Fig. 3b). A comparison between the sizes of the two basins reflects the relative flexibility of the two corresponding structures. The broad basin of the coil and the β-structures, in comparison to the narrow basin of the α-helical structures, illustrates that the coil and β-structures are much more flexible and occupy most of the peptide conformation space. Namely, the basin of the β-structures includes various structures such as β-hairpin, β-strand, and random coil, whereas the basin corresponding to the α-helical structures includes structures with different α-helical content (examples for α-helical and β-structures are shown in Fig. 2 b and c, respectively).
Figure 3.
(a) The two-state energy landscape of Ala12 in vacuum. (b) The secondary structure characteristic of the two states that compose the Ala12 energy landscape.
The Ala12 energy landscape in vacuum indicates that the peptide has two structural states: an α-helical and a β-state (which includes coil and β-structures). The α-helical conformation in vacuum is more stable by 11.6 kcal/mol than the β-hairpin conformation (Table 1). The greater stability of the α-helical state in vacuum is in accord with common helical propensity scales, which rank alanine as the residue with the highest helical propensity. However, whereas Ala12 adopts an α-helix at physiological temperatures, the energy landscape suggests that the energetic barrier crossing is possible at higher temperatures, and a transition from the α-helical to the β-basin can occur. In the α→β (β→α) processes in vacuum, we expect that ΔE > 0 (<0) and ΔS > 0 (<0). When a barrier crossing is possible, the reaction α ↔ β is in favor of the β-state because of its large configurational entropy that decreases the free energy change of the reaction as the temperature increases.
Table 1.
Properties of Ala12 in vacuum and in aqueous solvent based on its energy landscapes in both environments
| Ala12 in vacuum | Ala12 in aqueous solution | |
|---|---|---|
| Energy landscape | ||
| Energy landscape topography | Two basins | Two basins |
| α-helical basin | Narrow and deep (“native”) | Narrow and shallow |
| Coil and β basin | Broad and shallow | Broad and deep (“native”) |
| Thermodynamics | ||
| Global minimum | α-helix | β-hairpin |
| ΔE(α-helix − β-hairpin), kcal/mol | −11.6 | +9.4 |
| Kinetics | ||
| α → β τ, ns* | 9 | 4 |
| β → α τ, ns† | 11 | >100 |
The first passage time from the ideal α-helical conformation of Ala12 to its β-hairpin conformation at 350 K.
The first passage time from the β-hairpin conformation of Ala12 to its α-helical conformation at 350 K.
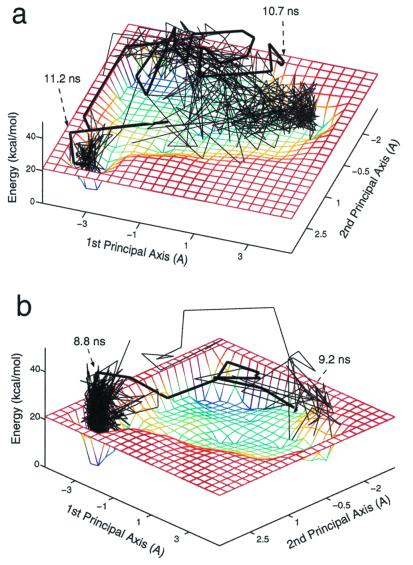
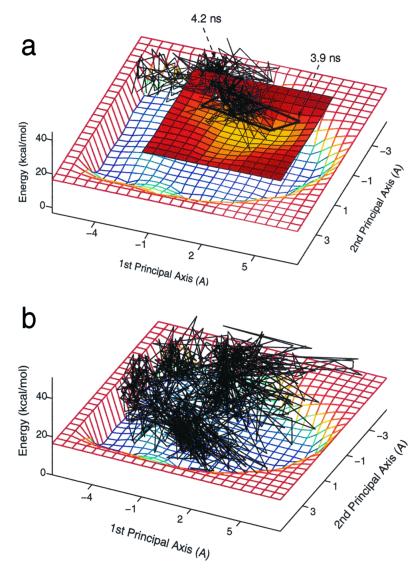
Fig. 4a shows a 350-K folding trajectory, from a β-hairpin conformation to an α-helical conformation, projected on the two-state vacuum energy landscape of Ala12. The projection of the trajectory onto the energy landscape demonstrates the two competing factors of a protein-folding process: energy versus entropy. In the case of Ala12, the peptide spends 10.7 ns in the highly entropic β-basin (nonnative state) before it undergoes a transition to the energetically favorable α-helical state (native state) and adopts an ideal α-helix conformation after 11.2 ns (Table 1). In the opposite case of the 350-K unfolding simulation shown in Fig. 4b, starting with the ideal α-helix of Ala12, it took 8.8 ns to escape from the α-helix basin into the nonnative β-basin adopting a β-hairpin structure after 9.2 ns. The heavy lines in the projected folding/unfolding trajectories of Fig. 4 a and b emphasize the successive structures before entering/escaping the α-helical basin. These two trajectories show that there are several, perhaps many, pathways for these reactions, and that this system has a transition region with more than one transition state, rather than a single transition state, as classical chemical kinetics would suggest (35, 40). The two trajectories are presented here as an indication of the effect of entropy on the folding and unfolding processes. However, to infer from the transition times of the two processes, more trajectories should be collected, starting with different initial conditions.
Figure 4.
Folding (a) and unfolding (b) trajectories of Ala12 in vacuum at 350 K projected onto the underlying energy landscape. The heavy lines indicate the 20 successive conformations before entering/escaping the native basin in the folding/unfolding trajectories, respectively.
The folding and unfolding pathways of Ala12 once projected on the two-state energy landscape illustrate the significance of the energy and entropy components of the “folded”/“unfolded” states to the folding/unfolding kinetics. The inherent flexibility of proteins results in broad basins, which dominate the folding and unfolding thermodynamics and kinetics. The large difference in the entropy of the two states may suggest that with increasing temperature, the free energy change for the folding process will be more negative and consequently may result in non-Arrhenius kinetic behavior (41).
Energy Landscape of Ala12 in an Aqueous Solvent.
The gross features of the energy landscape of Ala12 in aqueous solution (Fig. 5a) are qualitatively similar to the corresponding energy landscape in vacuum, which is composed of two basins. One basin is associated with α-helical structures, and the other corresponds to coil and β-structures. However, the quantitative features of the two basins are drastically different in aqueous solution and in vacuum. Although in vacuum the α-helical state constitutes the stable state (Fig. 3a), this state becomes destabilized in an aqueous environment, and the stable state is the one related to the β-structure. Fig. 5a depicts the two-state energy landscape of Ala12 in implicit water projected onto a two-dimensional subspace. The secondary structure characteristic of the two basins is shown in Fig. 5b. In this case, unlike in vacuum, the two first principal coordinates obtained by the PCA procedure are not sufficient to distinguish between the two states, and additional coordinates are required to better characterize the energy landscape. To overcome this difficulty, we have separately plotted (Fig. 5a) the landscape for all structures with an α-helical content of 50% or more (the higher and narrower surface) and the landscape corresponding to all other conformations of this polypeptide. The lesser success of the PCA method in capturing the topography of the energy landscape in water originates from the fact that in water, Ala12 is more flexible than in vacuum and can populate a broader range of conformations with the root-mean-square distance being comparable to that between α-helical and β-sheet conformations.
Figure 5.
(a) The two-state energy landscape of Ala12 in implicit water. The broad basin (white surface) corresponds to coil and β-structures, and the narrower and higher basin (pink surface) corresponds to α-helical structures. (b) The secondary structure characteristic of the two states composed the Ala12 energy landscape.
As is seen in Fig. 5a, the α-helical state in an aqueous medium is less stable by 9.4 kcal/mol relative to the β-hairpin conformation, which is the global minimum of Ala12 in water (Table 1). For the β→α (α→β) reaction in solution, we have ΔE > 0 (<0) and expect ΔS < 0 (>0), because of the large configurational entropy of the β-structures. The lower stability of the helical state of the peptide in water is because of solvation of the polar group, which otherwise participates in the CO(i)→NH(i + 4) hydrogen-bond network that defines the α-helix structure. The energy gap between the β-hairpin and the other β-structures is about 4 kcal/mol. In water there is only a relatively small thermodynamic preference for the β-hairpin structure in comparison to the higher preference of the α-helix in vacuum. This hints to the fact that in aqueous solution, polyalanine may adopt a variety of open structures. The high flexibility of Ala12 in water is reflected by the broadness of the native basin that corresponds to the coil and β-structures. To estimate the effect of solvation on the stability of the two states of Ala12 in vacuum, we calculate the average energies of Ala12's α-helical and β-hairpin conformations collected from 0.4-ns trajectories at 300 K by using vacuum, implicit solvent, and explicit solvent models (see Table 2). The results of both implicit and explicit solvent calculations indicate that solvation destabilizes the helical structure of Ala12 and that in a hydrophilic environment, the β-hairpin structure is the more stable state of Ala12. However, whereas the energy gap between the two states is about 10 kcal/mol in vacuum, the gap in aqueous solvent is only 4–5 kcal/mol.
Table 2.
The stability of α-helical and β-hairpin conformations of Ala12 in vacuum, implicit and explicit solvent, kcal/mol*
| Vacuum
|
Implicit
solvent
|
Explicit solvent
|
|||||
|---|---|---|---|---|---|---|---|
| Potential energy | Potential energy | Solvation energy† | Total energy | Potential energy | Solvation energy‡ | Total energy | |
| α-helical Ala12 | 184.2 ± 5.9 | −181.8 ± 5.6 | −76.2 ± 2.3 | −258.0 ± 5.4 | 191.3 ± 7.8 | −119.6 ± 10.0 | 71.7 ± 10.1 |
| β-hairpin Ala12 | 195.0 ± 6.2 | −175.0 ± 5.2 | −86.9 ± 1.9 | −261.9 ± 5.3 | 205.3 ± 6.7 | −139.1 ± 9.1 | 66.3 ± 10.2 |
| Δ(α-β) | −10.8 ± 6.1 | −6.8 ± 5.4 | 10.7 ± 2.1 | 3.9 ± 5.4 | −14 ± 7.3 | 19.5 ± 9.6 | 5.4 ± 10.2 |
The energies are calculated from 300-K molecular dynamics trajectories without minimization.
Solvation energy calculated by the EEF1.
Solvation energy calculated as the sum of all interactions between the α-helical (β-hairpin) Ala12 conformation and the 512 (514) surrounding water molecules.
Clearly the difference between the energy landscapes of Ala12 in water and in vacuum indicates that the peptide exhibits different thermodynamic and kinetic behaviors in the two environments. Fig. 6a shows a 350-K trajectory of helix→coil transition in implicit water projected onto the energy landscape of the solvated Ala12. The time required for the helix to unwind is 3.9 ns, being faster by more than a factor of two than for the same process in vacuum. In explicit water at 300 K, Ala12 unfolds after 1 ns, indicating that although the unfolding process in implicit solvent is faster than in vacuum, it does not entirely represent the solvent effect on the folding/unfolding reactions. Recall that in vacuum, the helix-to-coil process is driven only by increasing entropy, whereas in an aqueous medium, the process is also driven by decreasing energy, which, together with the increase in entropy, makes the helix→coil transition much faster. On the other hand, the reverse process, coil→helix, is predicted to be much slower in an aqueous environment relative to its rate in vacuum. Although in vacuum this process proceeds because of decreasing energy, in solvent the process is characterized by positive free energy change because of an increase in energy and a decrease in entropy (see Table 1). Fig. 6b shows a projection of a 100-ns 350-K trajectory on the energy landscape of Ala12 in aqueous solution. Because during these 100 ns a transition to the nonnative state, which corresponds to the α-helical structures, was not observed, the unfolding trajectory is presented only with respect to the native basin. The coil→helix transition time in aqueous solution is longer than 100 ns, being slower by more than an order of magnitude than the corresponding transition time in vacuum (≈11 ns, according to Fig. 4a). The different kinetics behavior can be traced to the environmental effect on the energy landscapes (Figs. 3a and 5a) that makes the free energy change of the coil→helix transition positive over the entire temperature range.
Figure 6.
Folding (a) and unfolding (b) trajectories of Ala12 in an aqueous solvent at 350 K projected onto the underlying energy landscape. The heavy line indicates the 20 successive conformations before entering the native basin in the folding trajectory. Because a transition to the unfolded state was not observed during the 100-ns unfolding trajectory, only the native basin is shown (Fig. 5b).
Conclusion
Our study demonstrates that the environment has a significant effect on the energy landscape of Ala12 polypeptide. Although the energy landscapes of Ala12 in hydrophilic and hydrophobic media are both composed of two basins, one associated with α-helical and the other with coil and β-structures, their relative properties are markedly affected by the environment. In both media, the large flexibility of the β-structures implies that most of the peptide configurational entropy originates from this state, whereas the contribution of the α-helical state to the total entropy is smaller. The main effect of the environment is exerted on the relative stability of the two states that make up the energy landscape. Although the α-helical state is the stable state in a hydrophobic environment, it is destabilized under hydrophilic conditions, and then the β-state becomes the more stable one. The inversion of the stability of the two states because of polar solvation results in a native state in aqueous solution that is characterized by larger entropy and, consequently, by a very efficient folding process.
Accordingly, polyalanine is expected to adopt an α-helical conformation in a nonpolar organic solvent and β-structures with coil conformations in a polar aqueous solution. Solid-state (i.e., hydrophobic environment) (42–45) and aqueous solution (12–14) measurements of polyalanine support its conformational dependence on the chemical environments with the ubiquity of the α-helix and β-structures prevailing in hydrophobic and in polar environments, respectively. The dependence of the conformation of alanine on the solvent characteristics (i.e., the polarity and dielectric constant of the solvent) is supported by experimental evidence that the helical propensity of alanine in water shows a dramatic increase on addition of certain alcohols (e.g., trifluoroethanol) (46, 47). Recently, it was proposed that alcohol may act on the exposed CO and NH groups by diminishing their exposure to the solvent, i.e., shifting the conformational equilibrium toward more compact structures, such as α-helical conformation (23). An alternative proposal for shifting the helix–coil equilibrium of polyalanine toward an α-helical conformation is to introduce charged residues into the sequence (48, 49); however, in this case, the tendency to form the α-helix should not be associated with the α-helical propensity of alanine discussed herein.
Additional information emerges concerning temperature-dependent conformations. The energy landscape of Ala12 in a nonpolar medium implies that the α→β reaction is thermodynamically characterized by ΔE > 0 and ΔS > 0, whereon ΔG for this reaction will decrease with increasing temperature. Consequently, the equilibrium of the α→β reaction in a hydrophobic environment is predicted to shift toward the β-state with increasing temperature. Thus, the significant preference of the α-helical conformation of polyalanine in a hydrophobic environment at 300 K can be reduced at higher temperatures. Experimentally, solid-state measurements of polyalanine indicate that the conformation of Ala200 is shifted from α-helix at lower temperatures to β-sheet at higher temperatures (44). The energy landscape of Ala12 in an aqueous solvent suggests that because the β→α reaction is characterized by ΔE > 0 and ΔS < 0 (i.e., ΔG > 0 for all of the temperature range), the temperature does not affect the ratio of the α- and β-conformations of polyalanine in water, and thus Ala12 adopts β-structures in aqueous solutions.
Acknowledgments
We are grateful to Professor R. S. Berry for stimulating comments.
Abbreviation
- PCA
principal component analysis method
References
- 1.Creighton T E. Proteins: Structures and Molecular Properties. New York: Freeman; 1993. [Google Scholar]
- 2.Brooks C L I, Karplus M, Pettit B M. Proteins: A Theoretical Perspective of Dynamics, Structure, and Thermodynamics. New York: Wiley; 1988. [Google Scholar]
- 3.Fersht A. Structure and Mechanism in Protein Science: A Guide to Enzyme Catalysis and Protein Folding. New York: Freeman; 1999. [Google Scholar]
- 4.Doruker P, Bahar I. Biophys J. 1997;72:2445–2456. doi: 10.1016/S0006-3495(97)78889-1. [DOI] [PMC free article] [PubMed] [Google Scholar]
- 5.Daggett V, Levitt M. J Mol Biol. 1992;223:1121–1138. doi: 10.1016/0022-2836(92)90264-k. [DOI] [PubMed] [Google Scholar]
- 6.Soman K V, Karimi A, Case D A. Biopolymers. 1991;31:1351–1361. doi: 10.1002/bip.360311202. [DOI] [PubMed] [Google Scholar]
- 7.Zimm B H, Bragg J K. J Chem Phys. 1959;31:526–535. [Google Scholar]
- 8.Buuren A R V, Berendsen H J C. Biopolymers. 1993;33:1159–1166. doi: 10.1002/bip.360330802. [DOI] [PubMed] [Google Scholar]
- 9.Chou P Y, Fasman G D. Annu Rev Biochem. 1978;47:251–276. doi: 10.1146/annurev.bi.47.070178.001343. [DOI] [PubMed] [Google Scholar]
- 10.O'Neil K T, DeGrado W F. Science. 1990;250:646–651. doi: 10.1126/science.2237415. [DOI] [PubMed] [Google Scholar]
- 11.Chakrabartty A, Kortemme T, Baldwin R L. Protein Sci. 1994;3:843–852. doi: 10.1002/pro.5560030514. [DOI] [PMC free article] [PubMed] [Google Scholar]
- 12.Ingwall R T, Scheraga H A, Lotan N, Berger A, Katchalski E. Biopolymers. 1968;6:331–368. doi: 10.1002/bip.1968.360060308. [DOI] [PubMed] [Google Scholar]
- 13.Platzer K E B, Ananthanarayanan V S, Andreatta R H, Scheraga H A. Macromolecules. 1972;5:177–187. [Google Scholar]
- 14.Blondelle S E, Forood B, Houghten R A, Perez-Paya E. Biochemistry. 1997;36:8393–8400. doi: 10.1021/bi963015b. [DOI] [PubMed] [Google Scholar]
- 15.Daggett V, Kollman P A, Kuntz I D. Biopolymers. 1991;31:1115–1134. doi: 10.1002/bip.360310911. [DOI] [PubMed] [Google Scholar]
- 16.Sung S S. Biophys J. 1994;66:1796–1803. doi: 10.1016/S0006-3495(94)80973-7. [DOI] [PMC free article] [PubMed] [Google Scholar]
- 17.Yang A S, Honig B. J Mol Biol. 1995;252:351–365. doi: 10.1006/jmbi.1995.0502. [DOI] [PubMed] [Google Scholar]
- 18.Yang A S, Honig B. J Mol Biol. 1995;252:366–376. doi: 10.1006/jmbi.1995.0503. [DOI] [PubMed] [Google Scholar]
- 19.Shen L, Bassolino D, Stouch T. Biophys J. 1997;73:3–20. doi: 10.1016/S0006-3495(97)78042-1. [DOI] [PMC free article] [PubMed] [Google Scholar]
- 20.Bertsch R A, Vaidehi N, Chan S I, Goddard W A I. Proteins Struct Funct Genet. 1998;33:343–357. doi: 10.1002/(sici)1097-0134(19981115)33:3<343::aid-prot4>3.0.co;2-b. [DOI] [PubMed] [Google Scholar]
- 21.Huo S, Straub J E. Proteins Struct Funct Genet. 1999;36:249–261. [PubMed] [Google Scholar]
- 22.Takano M, Yamato T, Higo J, Suyama A, Nagayama K. J Am Chem Soc. 1999;121:605–612. [Google Scholar]
- 23.Vila J A, Ripoll D R, Scheraga H A. Proc Natl Acad Sci USA. 2000;97:13075–13079. doi: 10.1073/pnas.240455797. . (First Published November 14, 2000; 10.1073/pnas.240455797) [DOI] [PMC free article] [PubMed] [Google Scholar]
- 24.Dobson C M, Sali A, Karplus M. Angew Chem. 1998;37:868–893. doi: 10.1002/(SICI)1521-3773(19980420)37:7<868::AID-ANIE868>3.0.CO;2-H. [DOI] [PubMed] [Google Scholar]
- 25.Frauenfelder H, McMahon B. Ann Phys (Leipzig) 2000;9:655–667. [Google Scholar]
- 26.Ball K D, Berry R S. J Chem Phys. 1998;109:8557–8572. [Google Scholar]
- 27.Miller M A, Doye J P K, Wales D J. Phys Rev E. 1999;60:3701–3718. doi: 10.1103/physreve.60.3701. [DOI] [PubMed] [Google Scholar]
- 28.Becker O M, Karplus M. J Chem Phys. 1997;106:1495–1517. [Google Scholar]
- 29.Levy Y, Becker O M. Phys Rev Lett. 1998;81:1126–1129. [Google Scholar]
- 30.Levy Y, Becker O M. J Chem Phys. 2001;114:993–1010. [Google Scholar]
- 31.Levy Y, Becker O M. In: Conformational Diseases. Katzir E, Solomon B, Taraboulos A, editors. Jerusalem: Center for the Study of Emerging Diseases; 2001. [Google Scholar]
- 32.Brooks B R, Bruccoleri R E, Olafson B D, States D J, Swaminathan S, Karplus M. J Comput Chem. 1983;4:187–217. [Google Scholar]
- 33.Lazaridis T, Karplus M. Science. 1997;278:1928–1931. doi: 10.1126/science.278.5345.1928. [DOI] [PubMed] [Google Scholar]
- 34.Lazaridis T, Karplus M. Proteins Struct Funct Genet. 1999;35:133–152. doi: 10.1002/(sici)1097-0134(19990501)35:2<133::aid-prot1>3.0.co;2-n. [DOI] [PubMed] [Google Scholar]
- 35.Martinez J C, Pisabarro M T, Serrano L. Nat Struct Biol. 1998;5:721–729. doi: 10.1038/1418. [DOI] [PubMed] [Google Scholar]
- 36.Jorgensen W L, Chandrasekhar J, Madura J D, Impey R W, Klien M L. J Chem Phys. 1983;79:926–935. [Google Scholar]
- 37.Elmaci N, Berry R S. J Chem Phys. 1999;110:10606–10622. [Google Scholar]
- 38.Becker O M. J Comput Chem. 1998;19:1255–1267. [Google Scholar]
- 39.Becker O M, Levy Y, Ravitz O. J Phys Chem. 2000;104:2123–2135. [Google Scholar]
- 40.Onuchic J N, Socci N D, Luthey-Schulten Z, Wolynes P G. Folding Des. 1996;1:441–450. doi: 10.1016/S1359-0278(96)00060-0. [DOI] [PubMed] [Google Scholar]
- 41.Karplus M. J Phys Chem B. 2000;104:11–27. [Google Scholar]
- 42.Shoji A, Ozaki T, Fujito T, Deguchi K, Ando S, Ando I. J Am Chem Soc. 1990;112:4693–4697. [Google Scholar]
- 43.Kimura H, Ozaki T, Sugisawa H, Deguchi K, Shoji A. Macromolecules. 1998;31:7398–7403. [Google Scholar]
- 44.Lee D-K, Ramamoorthy A. J Phys Chem B. 1999;103:271–275. [Google Scholar]
- 45.Warras R, Wieruszeski J-M, Boutillon C, Lippens G. J Am Chem Soc. 2000;122:1789–1795. [Google Scholar]
- 46.Rohl C A, Chakrabartty A, Baldwin R L. Protein Sci. 1996;5:2623–2637. doi: 10.1002/pro.5560051225. [DOI] [PMC free article] [PubMed] [Google Scholar]
- 47.Cammers-Goodwin A, Allen T J, Oslick S L, McClure K F, Lee J K, Kemp D S. J Am Chem Soc. 1996;118:3082–3090. [Google Scholar]
- 48.Marqusee S, Robbins V H, Baldwin R L. Proc Natl Acad Sci USA. 1989;86:5286–5290. doi: 10.1073/pnas.86.14.5286. [DOI] [PMC free article] [PubMed] [Google Scholar]
- 49.Williams L, Kather K, Kemp D S. J Am Chem Soc. 1998;120:11033–11043. [Google Scholar]


