Abstract
We have systematically characterized gene expression patterns in 49 adult and embryonic mouse tissues by using cDNA microarrays with 18,816 mouse cDNAs. Cluster analysis defined sets of genes that were expressed ubiquitously or in similar groups of tissues such as digestive organs and muscle. Clustering of expression profiles was observed in embryonic brain, postnatal cerebellum, and adult olfactory bulb, reflecting similarities in neurogenesis and remodeling. Finally, clustering genes coding for known enzymes into 78 metabolic pathways revealed a surprising coordination of expression within each pathway among different tissues. On the other hand, a more detailed examination of glycolysis revealed tissue-specific differences in profiles of key regulatory enzymes. Thus, by surveying global gene expression by using microarrays with a large number of elements, we provide insights into the commonality and diversity of pathways responsible for the development and maintenance of the mammalian body plan.
DNA arrays have been used to study the expression of all of the protein coding genes in yeast (1) and Mycobacterium (2). The same sorts of global studies are already possible in Drosophila (3), and they will be feasible in mouse (4) and human tissue in the not too distant future. To date, however, large arrays have not been used to learn about the development and maintenance of function of mammalian tissues. One reason for this is the paucity of cDNAs from which one might create the appropriate arrays. To overcome this problem, we have constructed many full-length mouse cDNA libraries based on a CAP trapper full-length cDNA selection method (5), to produce a mouse cDNA encyclopedia (http://genome.gsc.riken.go.jp/). We sequenced the 3′ ends of clones from these libraries and identified a nominally nonredundant set of cDNAs. We arrayed 18,816 “unique” cDNAs (the “RIKEN 19K set”) and systematically characterized the gene expression profiles of a number of adult and developing mouse tissues. We realize that the 19K set is not nonredundant. On the basis of limited clustering of the clone sequences, we estimate that there are about 13,600 nonredundant genes in the set.
The advantages of using the mouse for this analysis should be obvious: (i) collecting fresh tissues at all developmental and adult stages is easy; (ii) many mutant and gene-knockout mice are available and are useful for further analysis of gene function; and (iii) mouse cDNA and genome sequencing projects are progressing rapidly, and it will soon be possible to print near-comprehensive arrays of well-annotated cDNAs.
Below we report the expression profile of 49 adult and embryonic tissues. We performed hierarchical clustering analyses for tissues as well as genes, and we used our data to understand similarities and differences in patterns of expression between embryonic and adult tissues. In addition, we have analyzed patterns of expression of enzymes known to be part of metabolic pathways. The diversity of gene expression patterns observed has provided surprising insights into the commonality and diversity of pathways responsible for the development and maintenance of the mammalian body plan.
Materials and Methods
Preparation of Target DNAs.
The target DNAs were collected from RIKEN mouse cDNA libraries (5), which were constructed by using the CAP trapper method to enrich for full-length inserts. The cDNAs were amplified by using M13 forward and reverse primers in a 100-μl PCR with 0.2 μM final concentration (each) of forward (F1224, 5′-CGCCAGGGTTTTCCCAGTCACGA-3′) and reverse (R1233, 5′-AGCGGATAACAATTTCACACAGGA-3′) primers, 250 μM dNTPs, and 1.25 units of Ex Taq in 1× Ex Taq buffer (Takara Shuzo, Tokyo). The PCR product was precipitated with isopropyl alcohol and resuspended in 15 μl of 3× SSC. The DNA solution was spotted on poly(l-lysine)-coated slides by using a DNA arrayer (http://cmgm.stanford.edu/pbrown/mguide/index.html) with 16 tips (SMP3, TeleChem International, Sunnyvale, CA). The diameter of the spots was 100–150 μm. Mouse β-actin and glyceraldehyde-3-phosphate dehydrogenase cDNAs were used as positive controls and Arabidopsis cDNAs were used as negative controls (accession nos. X98108, X13611, X90769, Z99707, AF004393, Z49777, Q03943, U58284). Tissues from which the cDNA libraries were made (En indicates embryonic day n), and the number of the clones used (shown in parenthesis) from each cDNA library are as follows: 06, kidney (338); 07, brain (35); 09, spleen (17); 10, heart (397); 11, E18 (1,771); 12, lung (514); 15, cerebellum (1,200); 16, placenta (437); 17, testis (1,591); 18, pancreas (1,816); 20, small intestine (1,178); 22, stomach (1,517); 23, tongue (3,110); 24, ES (995); 25, E13 liver (782); 26, E10 (976); 27, E11 (426); 28, E10 and E11 (1,010); 29, hippocampus (197); 30, E12 head (168); 31, E13 head (158); 32, E14 head and E17 head (92); 33, E17 head (91).
Performance of RIKEN Microarrays.
mRNAs transcribed in vitro from Arabidopsis full-length cDNAs were serially diluted and mixed with mRNAs from mouse brain. The Arabidopsis mRNA signal was detectable when 0.3 pg was added to 1 μg of brain mRNA, corresponding to a sensitivity of 1–3 copies of mRNA per cell (data not shown).
Many of the cDNAs used to prepare target DNAs were full-length and relatively long. For this reason, we were concerned about the possibility that probes from multiple related transcripts might bind to single targets. The signal intensity of a clone that was about 80% identical to the target sequence was one-tenth that of a completely identical clone. Clones that were less than 80% identical to the target sequence gave signals at the background level (data not shown).
Preparation of Probe.
One microgram of mRNA extracted from each of the 49 tissues was labeled by incorporating Cy3 during random-primed reverse transcription. cDNA derived from entire E17.5 embryos, which we labeled with Cy5, was used as the expression reference for all tissues. Deoxynucleotides labeled with the dyes Cy3 and Cy5 were obtained from Amersham Pharmacia. The labeling was carried out at 42°C for 1 h in a total volume of 30 μl containing 400 units of SuperScript II (GIBCO/BRL); 0.1 mM Cy3-dUTP (or Cy5-dUTP); 0.5 mM each dATP, dCTP, and dGTP; 0.2 mM dTTP, 10 mM DTT, 6 μl of 5× first-strand buffer, and 6 μg of random primers. To remove unincorporated nucleotide, labeled cDNA was mixed with 500 μl of binding buffer (5 M guanidine thiocyanate/10 mM Tris⋅HCl, pH.7.0/0.1 mM EDTA containing 0.03% gelatin and 2 ng/μl tRNA) and 50 μl of silica matrix buffer (10% matrix/3.5 M guanidine hydrochloride/20% glycerol/0.1 mM EDTA/200 mM NaOAc, pH 4.8–5.0), transferred to a GFX column (Amersham Pharmacia), and centrifuged at 15,000 rpm in a Sorvall centrifuge (RC-3B plus; H6000A/HBB6 rotor) for 30 s. The flow-through was discarded, and the column was washed with 500 μl of wash buffer. The adsorbed probe was eluted into a final volume of 17 μl of distilled water. This labeled probe was mixed with blocking solution containing 3 μl of 10 μg/μl oligo(dA), 3 μl of 20 μg/μl yeast tRNA, 1 μl of 20 μg/μl mouse Cot1 DNA, 5.1 μl of 20× SSC, and 0.9 μl 10% SDS.
Array Hybridization and Data Analysis.
The RIKEN full-length mouse cDNA that comprised the target was hybridized in a final volume of 30 μl; the entire array consists of three multiblocks, and each multiblock required 10 μl of hybridization solution. Before hybridization, probe aliquots were heated at 95°C for 1 min and cooled at room temperature. Coverslips were hybridized overnight at 65°C in a Hybricasette (obtained from ArrayIt.com). After hybridization, slides were washed in 2× SSC/0.1% SDS until the coverslips dropped off, and the slides were then transferred into 1× SSC, shaken gently for 2 min, and rinsed with 0.1× SSC for 2 min. After washing, slides were spun at 800 rpm in a Sorvall centrifuge (RC-3B plus; H6000A/HBB6 rotor). These slides were scanned on a ScanArray 5000 confocal laser scanner, and the images were analyzed by using ImaGene (BioDiscovery; Los Angeles).
Analysis of the Data.
To improve the accuracy of the data, we did the experiment twice, labeling the same RNA template in two separate reactions. Data were normalized to the reference standard by subtracting (in log space) the median observed value if it were other than zero. We used only data points that were reproducible. To this end, we developed a filtering program, prim (Preprocessing Implementation for Microarray; ref. 6). Briefly, this program (i) deletes the results with “flags” added manually to corrupted spots, (ii) eliminates spots with signal intensities less than the mean + 3 × standard deviation of the background signal intensity in either Cy3 or Cy5, and (iii) eliminates spots located outside the least-mean-squares line ±2 × standard deviation. After the filtering was finished, we compared the results of the two experiments by calculating a Pearson's correlation coefficient. If the coefficient was equal to or greater than 0.7, we used the data in subsequent analyses. If not, we repeated the labeling, hybridization, and scanning up to six times. In this way, we could generate high-quality data for most tissues. Preceding the clustering, ratio values from duplicate experiments were averaged, log-transformed (base 2), and stored in a table. We applied hierarchical clustering to both axes, using the weighted pair-group method with a centroid average as implemented by the program cluster (M.B.E.: http://www.microrrays.org/software.html; ref. 7). The distance matrices we used were the Pearson correlation for clustering the arrays and the inner product of vectors normalized to magnitude 1 for the genes (this is a slight variation of the Pearson correlation). The results were analyzed by using TreeView (M.B.E.: http://www.microrrays.org/software.html; ref. 7).
Cellular Roles.
We were able to assign cellular roles to 2,206 of the RIKEN clones by comparing the sequences of the 18,816 cDNAs in our set to those of expressed sequence tags (ESTs) in The Institute for Genomic Research (TIGR) EGAD database by using the tblastx program. The threshold E-value used to assign an identification to a clone was 1.0 × 10−50.
Glycolysis Pathway Analysis.
For the glycolysis pathway analysis, we first collected reference gene sequences for members of the glycolysis pathway from the Kyoto Encyclopedia of Genes and Genomes (KEGG) database (http://www.genome.ad.jp/kegg/). Amino acid sequences from human and mouse were searched against the 18,816 RIKEN sequences with the tblastn program. We also used a text search of enzyme names against our annotations of the 18,816 genes. We set the E-value threshold in this blast search to 1.0 × 10⁻³⁰. After we had identified the members of the glycolysis pathway in our collection, we clustered them with the help of the TreeView program.
Results and Discussion
Expression Profiles of Adult and Developing Tissues.
We extracted mRNA from 49 adult and embryonic tissues from C57BL/6J mice, made labeled probes, and hybridized them to the RIKEN 19K set. In total, we completed approximately 1.8 million measurements of gene expression based on 294 microarray analyses of 49 adult and embryonic tissues. We used whole-body mRNA from equal numbers of male and female E17.5 mouse embryos as a reference probe for all tissues. This reference is more easily and reproducibly made than ones produced by mixing RNAs from a variety of cells or tissues. In addition, because it is simple to make, we feel that others will be able to use it to compare their data to ours. Whole E17.5 embryos are quite heterogeneous. RNA from these animals has a more complex expression pattern than does a mixture of RNAs from several major tissues. This difference is important because the reference sample should ideally generate a signal in every spot on the array (i.e., a nonzero denominator for the Cy3/Cy5 ratio). Finally, because embryonic tissues are obtained by Caesarian section, the samples are free from infection. We used this E17.5 whole-body cDNA reference (labeled with Cy5) to calculate the relative abundance of each gene in the experimental mRNA samples (labeled with Cy3).
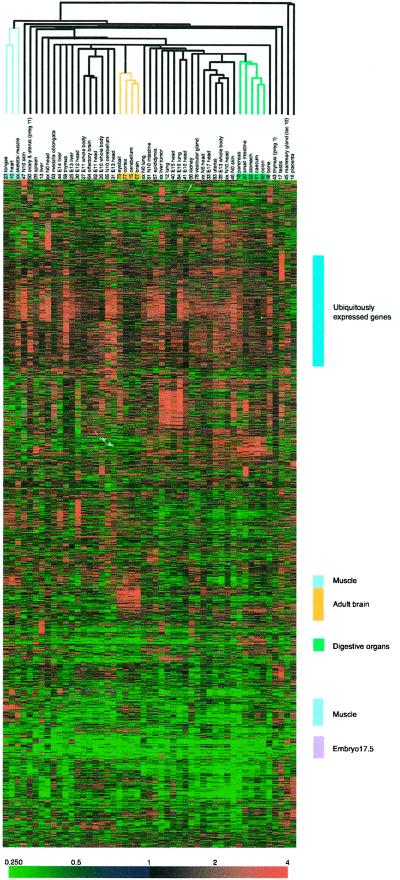
We used the prim program to filter low-quality data. A total of 14,610 clones survived the filtering process. We next used hierarchical clustering to group genes on the basis of tissue data or tissues based on patterns of genes. The data are shown in a matrix format (Fig. 1).
Figure 1.
Hierarchical clustering of gene expression data. Depicted are the approximately 1.8 million measurements of gene expression from the 294 microarray analyses of 49 adult and embryonic tissues. The dendrogram lists the tissues studied and provides a measure of the relatedness of gene expression in each sample. Each row represents a single cDNA clone on the microarray, whereas each column corresponds to a separate mRNA sample. The results presented represent the ratio of hybridization of fluorescent cDNA probes prepared from each tissue mRNA samples to a reference mRNA sample (derived from entire E17.5 mouse embryos). These ratios are a measure of relative gene expression in each experimental sample and are depicted according to the color scale shown at the bottom. As indicated, the scale extends from fluorescence ratios of 0.25 to 4 (−2 to +2 in log base 2 units). Gray indicates missing or excluded data. FANTOM, Functional Annotation of Mouse cDNAs.
The clustering of tissues revealed a remarkably ordered pattern, demonstrating that expression patterns alone could be used to sort tissues on the basis of similarities in embryological origin or function. The muscular tissues (tongue, heart, and skeletal muscle), adult brain regions (cortex, cerebellum, and brain) and eye, and digestive organs (pancreas, small intestine, stomach, cecum, and colon) fell into discrete groups based solely on similarities in patterns of gene expression. The colored bars on the right side of Fig. 1 highlight genes that show tissue-specific expression. Ubiquitously expressed genes include several types of ribosomal proteins and housekeeping genes. Interestingly and somewhat unexpectedly, some ribosomal proteins show distinct clusters of expression profiling and are expressed in a tissue-specific manner.
As expected, some genes were preferentially expressed in specific tissues. Three representative clusters that illustrate this are shown in Fig. 6 a (adult brain), b (digestive tissues), and c (the entire E17.5 embryo), which is published as supplemental data on the PNAS web site, www.pnas.org. The numerals in the column heads identify the tissue from which the probe was made as shown in Materials and Methods. The first two digits of the clone labels (the row heads) identify the source library from which these clones originated. The tissues from which the cDNA were cloned correlate well with their expression profiles in tissues as shown in yellow, green, or purple in Fig. 6 a, b, and c, respectively. This correlation indicates that the use of E17.5 embryos to make a reference probe worked quite well.
We have developed a web-based database search engine named read (RIKEN cDNA Expression Array Database) (http://genome.gsc.riken.go.jp/READ/) to allow total access to our database and to easily search for genes of interest. The reference database will be useful for further analyzing differences in gene expression between normal and diseased tissues.
Patterns of Gene Expression in the Central Nervous System (CNS) During Development and in Adulthood.
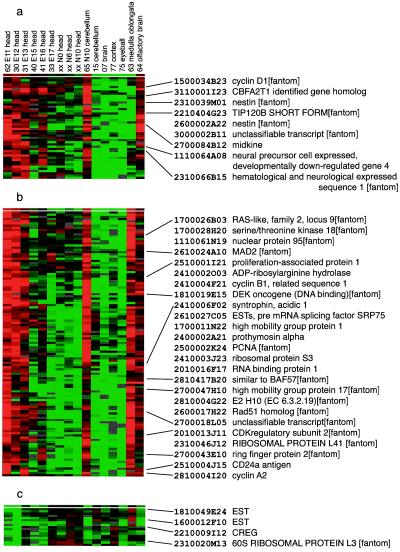
To examine variations in gene expression during development of a single tissue, we analyzed and clustered our CNS data separate from the rest. The expression profiles of the CNS samples varied as a function of developmental age (Fig. 7, which is published as supplemental data on the PNAS web site, www.pnas.org), as indicated by the colored bars at the right of the figure. However, genes that are prominently expressed in the postnatal day 10 (N10) cerebellum also are expressed in the head of early (e.g., E11, E12, and E13) embryos. Similarly, the expression profiles of the olfactory bulb are very similar to those of the head of the E11 embryo. These results suggest functional similarities between the head of the E11 embryo and the postnatal cerebellum or the olfactory bulb—a result consistent with that from the hierarchical clustering of the tissue samples (Fig. 1). Genes that are specifically expressed in these E11–E13, N10 cerebellum, and olfactory bulb can be divided into two major groups—those involved in cell death or neural remodeling (Fig. 2a) and those involved in cell division (Fig. 2b). During brain development an excess of neuroblasts is generated, and those that fail to reach appropriate targets at the right developmental stage are eliminated by a process of programmed cell death or apoptosis. Cyclin D1, which is an essential mediator of apoptotic neuronal cell death (8), is one of the genes in the “apoptosis” cluster. This is consistent with the report by Padmanabhan et al. (9) that multiple cell cycle proteins, including cyclin D1, are involved in cerebellar granule cell apoptosis. Midkine, a potential apoptosis inhibitor (10), and nestin, which is found preferentially in the neuroepithelial stem cells (11), are also included in this cluster. The preferential expression of these genes in early embryonic stages, with little expression in the adult, is consistent with the report by Wen et al. (12).
Figure 2.
Hierarchical clustering of tissue expression profile of developmental stage of CNS. (a, b, and c) Expanded views of biologically distinct gene expression signatures in the CNS set. Genes inversely correlated with cyclin D1 were extracted and shown in c. All of the gene names included in these clusters are provided in Fig. 8 a, b, and c, respectively, which is published as supplemental data on the PNAS web site, www.pnas.org.
Genes that have roles in cell division are also induced in tissues of the E11–E13 embryonic head, N10 cerebellum, and olfactory bulb (Fig. 2b). This result suggests that marked cell differentiation or proliferation occurs in these regions of the CNS. This group of induced genes includes cyclin B1, cyclin A2, Mad2 and splicing factors, as well as genes that are known to be involved in neuronal development [e.g., Dek (13) and syntrophin]. The expression of genes involved in proliferation in the adult olfactory bulb was established in the pioneering studies of Moulton et al. (14). The expression of these genes in the adult medulla oblongata, suggesting the presence of cell differentiation or proliferation in this part of the CNS, is an interesting finding, but will require further evaluation.
Finally, the cluster of ubiquitous genes includes some that are highly expressed in the head of E13 and N0 mice, including ribosomal proteins and housekeeping genes, suggesting that cells there are growing or proliferating rapidly.
Cellular repressor of E1A-stimulated genes (CREG) (Fig. 2c) is also intriguing. The inverse correlation in expression between cyclin D1 and CREG has not been reported before, to our knowledge. Cyclin D1–CDK4,6 complex activates E2F to promote proliferation through pRb phosphorylation by binding to pRb by means of the pRb binding site of cyclin D1, whereas CREG also has pRb- and p300/CBP-binding sites but inhibits E1A-stimulated E2F activation. Thus, it seems reasonable that cyclin D1 and CREG transcripts move in opposite directions because their products have opposing actions. Fig. 2c shows a set of genes the expression patterns of which correlate with that of CREG. Many of these may have CREG-related or CREG-regulated activities.
Expression of Functional Classes of Genes.
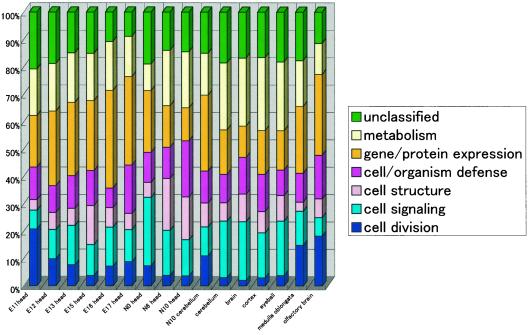
We were able to assign functions to 2,206 RIKEN cDNA clones with expression levels at least twice those in E17.5 whole embryonic tissue. On the basis of these criteria, we found that the expression of genes involved in cell division was higher in early embryonic stages than in adult stages, whereas that of genes involved in metabolism is higher in adult tissues than in embryonic stages (Fig. 3). The expression of genes influencing protein production increased just before birth, and, as we saw earlier, the genes expressed in the medulla oblongata were similar to those in N10 cerebellum and head of E11 and E12 embryos. It will be possible to further test these correlations as functional annotation is added to the gene set.
Figure 3.
Ratios of cellular roles for each CNS tissue. Cellular roles were assigned to the 2,206 genes in light of results from searching the TIGR EGAD database (http://www.tigr.org/tdb/egad/egad.shtml). Ratios of cellular roles for all of the 49 tissues are also available in supplementary data at (http://genome.gsc.riken.go.jp/READ/supplementary/).
Expression Patterns of Metabolic Pathways.
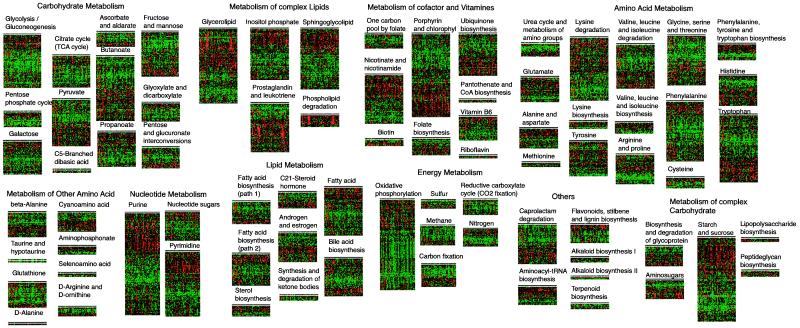
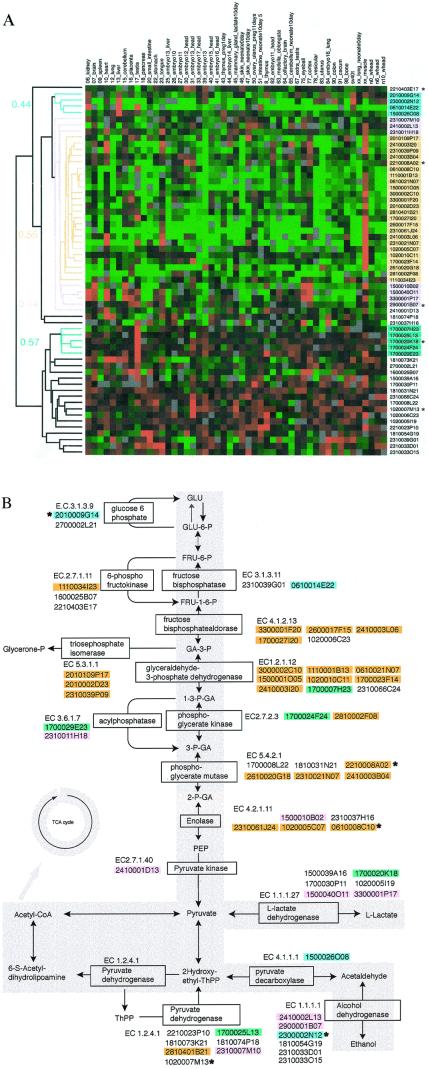
Enzymes in all classes of metabolic pathways were represented in the RIKEN 19K set. We separated these enzymes into 78 various synthetic and degradative metabolic pathways and determined the relatedness of expression patterns during development and in adult tissues. The similarities in patterns of expression among genes coding for enzymes in the same metabolic pathway were striking (Fig. 4). Although the expression patterns of individual enzymes have been examined in various tissues of the whole animal, leading to hypotheses regarding whole body regulation of metabolism, it has not previously been possible to examine the coordinate regulation of most metabolic pathways simultaneously. Using microarray expression analysis, we have provided strong evidence that metabolic pathways are coordinately regulated throughout the body of an organism during development and in the adult. Intriguingly, genes were clustered into two major groups in all of the metabolic pathways (Fig. 4). One group was the ubiquitously expressed gene set and the other was a tissue-specifically expressed gene set. Expressed genes in a tissue-specific pattern were mainly clustered into muscle-specific and liver- or kidney-specific genes. For example, tissue-specific genes involved in the amino acid metabolism were mainly found in the liver and kidney, whereas those involved in glycolysis were in muscle (Fig. 5a).
Figure 4.
Hierarchical tree view of the clustered genes of all metabolic pathways. Clones that meet the criteria as described in Materials and Methods were clustered for genes and shown. All of the genes included in each pathway are shown as supplementary information at (http://genome.gsc.riken.go.jp/READ/supplementary/allpathway/).
Figure 5.
(a) Hierarchical tree view of the clustered genes that are involved in the glycolysis pathway. The colors correspond to those of b. Gene names are provided in Fig. 9, which is published as supplementary data on the PNAS web site, www.pnas.org. (b) Glycolysis pathway map derived from the RIKEN 19K set. Genes that have high correlation with each other are colored. Genes colored in yellow, blue, and green show the correlation coefficient value of 0.64, 0.52 and 0.54, respectively. The genes shown in pink were categorized in the same group as the genes shown in yellow but with a correlation coefficient value of 0.42. A * indicates the annotations of these genes were inherited from the FANTOM annotation.
We examined the expression patterns of genes encoding enzymes in the well-studied glycolytic pathway in more detail. We positioned various genes in the glycolysis pathway and color-coded each group created by hierarchical clustering in light of their expression levels (Fig. 5). Genes that were closely clustered are shown in the same color. Genes colored in yellow have a correlation coefficient of 0.55, those in blue have a value of 0.44, and the green ones have a value of 0.57. The genes shown in pink were categorized in the same group as those in yellow at a correlation coefficient of 0.44 (Fig. 5). Surprising differences were observed when the expression patterns of genes involved in glycolysis were examined at this level of detail. The genes shown in yellow and pink show the muscle-specific expression pattern, whereas the genes color coded in green and blue are testis-specific and liver- and kidney-specific, respectively. Here, as shown in the muscle-specific gene cluster, genes closely clustered in expression (Fig. 5a) were more closely linked in the glycolysis pathway (Fig. 5b, shown in yellow), while genes weakly linked for coexpression (shown in pink) were more distant in the pathway. Interestingly, even though they may have the same EC number (and presumably arise from a single gene) genes that were clustered in different groups differ in their library of origin and tissue-specific pattern of expression. For example, the genes shown in green all derived from the testis [Fig. 5; the first two digits in the clone label (17) correspond to the library from which they arose]. This finding provides support for the existence of isoforms that may be specifically expressed and functioning in the testis (15). These genes are hypothesized to play an important role in regulating the switch between various pathways of energy production during spermatogenesis and in the spermatozoon. Similarly, there are tissue-specific differences in gene products for glycolytic enzymes derived from muscle (Fig. 5a, shown in yellow and pink) and those from liver and kidney (Fig. 5, shown in blue). Our results strongly suggest that clustering efficiently distinguishes genes or perhaps isoforms of those genes that function in a tissue-specific manner.
Conclusions
Understanding the temporal and spatial expression of a gene is useful for further analysis of its function and any associated disease condition. The use of cDNA microarrays allows efficient analysis of the expression of many genes, providing assessment of the function of pathways. We have established an expression database for a large set of genes in 49 different tissues. The quality and accuracy of these data were supported by comparing information for each gene about the tissue from which it was derived with array data. Assigning a functional role to each gene with tissue-specific expression will be quite valuable. The number of functionally annotated genes is low at this time. As this number increases, array data will prove even more useful. For this reason, a FANTOM (Functional Annotation of Mouse cDNAs) (http://genome.gsc.riken.go.jp/FANTOM/) meeting was held to systematically assign functional annotation by intensive computational analysis followed by human inspection. The details of the concept and results of the FANTOM meeting (16) will be reported elsewhere. Of the RIKEN 19K set, 10,004 clones were included in the FANTOM set and their annotations were used in the present analysis. Our future efforts will focus on increasing the number of analyzed genes so that we can draw a complete picture of the expression profiles. Using whole-body cDNA from an E17.5 embryo as the reference material will allow the comparison of data between laboratories. READ is available to the public through our database (http://genome.gsc.riken.go.jp/READ/).
Supplementary Material
Acknowledgments
We especially thank A. Wynshaw-Boris and M. Brownstein for helpful discussion and English editing. We thank N. Tominaga, M. Gariboldi, T. Ishikawa, T. Sakai, T. Shimoji, C. Sakai, T. Kamoshida, M. Nakamura, R. Yano, M. Nakagawa, and T. Kasukawa for technical assistance and helpful discussion. We also thank C. Weitz, H. Suzuki, T. Endo, and K. Shimizu for helpful advice. We thank K. Shinozaki for kindly providing the full-length Arabidopsis cDNAs. We acknowledge all of the members of the FANTOM consortium for the use of FANTOM annotation. This study was supported in part by Special Coordination Funds for Promoting Science and Technology from the Science and Technology Agency of the Japanese Government to Y. Okazaki. This study has been supported by Special Coordination Funds for Promoting Science and Technology and a Research Grant for the RIKEN Genome Exploration Research Project from the Science and Technology Agency of the Japanese Government, Special Coordination Funds for Promoting the Bioresource Program from RIKEN Tsukuba and CREST (Core Research for Evolutional Science and Technology) and ACT-JST (Research and Development for Applying Advanced Computational Science and Technology) of the Japan Science and Technology Corporation (JST) to Y. Hayashizaki. This work was also supported by a Grant-in-Aid for Scientific Research on Priority Areas and Human Genome Program, from the Ministry of Education, Science and Culture, and by a Grant-in-Aid for a Second Term Comprehensive 10-Year Strategy for Cancer Control from the Ministry of Health and Welfare to Y. Hayashizaki.
Abbreviations
- En
embryonic day n
- Nn
postnatal day n
- EST
expressed sequence tag
- FANTOM
Functional Annotation of Mouse cDNAs
- CNS
central nervous system
References
- 1.DeRisi J L, Iyer V R, Brown P O. Science. 1997;278:680–686. doi: 10.1126/science.278.5338.680. [DOI] [PubMed] [Google Scholar]
- 2.Behr M A, Wilson M A, Gill W P, Salamon H, Schoolnik G K, Rane S, Small P M. Science. 1999;284:1520–1523. doi: 10.1126/science.284.5419.1520. [DOI] [PubMed] [Google Scholar]
- 3.White K P, Rifkin S A, Hurban P, Hogness D S. Science. 1999;286:2179–2184. doi: 10.1126/science.286.5447.2179. [DOI] [PubMed] [Google Scholar]
- 4.Tanaka T S, Jaradat S A, Lim M K, Kargul G J, Wang X, Grahovac M J, Pantano S, Sano Y, Piao Y, Nagaraja R, et al. Proc Natl Acad Sci USA. 2000;97:9127–9132. doi: 10.1073/pnas.97.16.9127. [DOI] [PMC free article] [PubMed] [Google Scholar]
- 5.Carninci P, Hayashizaki Y. Methods Enzymol. 1999;303:19–44. doi: 10.1016/s0076-6879(99)03004-9. [DOI] [PubMed] [Google Scholar]
- 6.Kaota K, Miki R, Bono H, Shimizu K, Okazaki Y, Hayashizaki Y. Physiol Genomics. 2001;4:183–188. doi: 10.1152/physiolgenomics.2001.4.3.183. [DOI] [PubMed] [Google Scholar]
- 7.Eisen M B, Spellman P T, Brown P O, Botstein D. Proc Natl Acad Sci USA. 1998;95:14863–14868. doi: 10.1073/pnas.95.25.14863. [DOI] [PMC free article] [PubMed] [Google Scholar]
- 8.Kranenburg O, van der Eb A J, Zantema A. EMBO J. 1996;15:46–54. [PMC free article] [PubMed] [Google Scholar]
- 9.Padmanabhan J, Park D S, Greene L A, Shelanski M L. J Neurosci. 1999;19:8747–8756. doi: 10.1523/JNEUROSCI.19-20-08747.1999. [DOI] [PMC free article] [PubMed] [Google Scholar]
- 10.Lendahl U, Zimmerman L B, McKay R D. Cell. 1990;60:585–595. doi: 10.1016/0092-8674(90)90662-x. [DOI] [PubMed] [Google Scholar]
- 11.Owada K, Sanjo N, Kobayashi T, Mizusawa H, Muramatsu H, Muramatsu T, Michikawa M. J Neurochem. 1999;73:2084–2092. [PubMed] [Google Scholar]
- 12.Wen X, Fuhrman S, Michaels G S, Carr D B, Smith S, Barker J L, Somogyi R. Proc Natl Acad Sci USA. 1998;95:334–339. doi: 10.1073/pnas.95.1.334. [DOI] [PMC free article] [PubMed] [Google Scholar]
- 13.Scully A L, McKeown M, Thomas J B. Mol Cell Neurosci. 1999;13:337–347. doi: 10.1006/mcne.1999.0752. [DOI] [PubMed] [Google Scholar]
- 14.Moulton D G. In: CIBA Foundation Symposium on Taste and Smell in Vertebrates. Wolstenholme G E W, Knight J, editors. London: Novartis; 1970. pp. 227–250. [Google Scholar]
- 15.Welch J E, Schatte E C, O'Brien D A, Eddy E M. Biol Reprod. 1992;46:869–878. doi: 10.1095/biolreprod46.5.869. [DOI] [PubMed] [Google Scholar]
- 16.The RIKEN Genome Exploration Research Group Phase II Team and the FANTOM Consortium. Nature (London) 2001;409:685–690. [Google Scholar]
Associated Data
This section collects any data citations, data availability statements, or supplementary materials included in this article.


