

Abstract
The DNA bases interact strongly with gold electrodes, complicating efforts to measure the tunneling conductance through hydrogen-bonded Watson Crick base pairs. When bases are embedded in a self-assembled alkane-thiol monolayer to minimize these interactions, new features appear in the tunneling data. These new features track the predictions of density-functional calculations quite well, suggesting that they reflect tunnel conductance through hydrogen-bonded base pairs.
Introduction
Electron tunneling is an extremely localized phenomenon. So much so, that it is believed that tunneling electrodes could detect signals from one (and only one) base in a single-stranded DNA, setting the stage for a new approach to DNA sequencing.1–4 However, this same sensitivity renders the detected signals extremely sensitive to the detailed atomic geometry of the contacts,5 complicating attempts to make reproducible tunneling measurements in the presence of water, ions and the inevitable hydrocarbon contamination of metal electrodes. In order to overcome these problems, we have introduced a new technique we call recognition tunneling.6 In recognition tunneling, both electrodes are functionalized by recognition reagents attached to the metals by bonds that are strong enough to displace contamination. Tunneling signals are detected via the “telegraph noise” that arises as the reagents stochastically make and break connections with eachother,7 or with a target analyte trapped in the gap.8 A “two-level” (on-off-on-off…) signal is characteristic of the interaction of a single molecular pair in the tunnel gap, a phenomenon previously exploited by Nichols and Haiss to make measurements of single molecule conductance.9,10
We have determined the tunnel conductance of DNA base-nucleoside pairs using this method, obtaining results that are in reasonable agreement with the predictions of density functional calculations.7 In this case, theory and experiment agree on an unusual feature: the tunnel current through a guanine-dexoycytidine pair (three hydrogen bonds) is lower than the tunnel current through an adenine-thymidine pair (two hydrogen bonds). Theoretical analysis11 shows two factors at play. Firstly, transmission through the deoxyribose sugar ring is low, diminishing the importance of the hydrogen bonds in the overall transmission. Specifically, addition of the sugar ring to the molecule alters the molecular levels so as to reduce overall transmission by a large amount. A classical analogy would be to think of the hydrogen bonded system as a low value resistor that depends strongly on the number of hydrogen bonds, in series with a very high value resistor (the sugar) that does not. Secondly, a more favorable alignment of the Fermi energy in the case of adenine-thymidine swamps any enhancement owing to the extra hydrogen bond in the guanine-deoxycytidine pair.
Theoretical calculations of the transmission through base pairs (directly tethered to electrodes without an intervening deoxyribose ring) show both much larger currents, and a much greater sensitivity to hydrogen bonding, with the predicted currents for triply-hydrogen bonded base pairs being several times the predicted currents through doubly-hydrogen bonded base pairs.12 Our first attempts to measure currents between base pairs were disappointing. The currents were much smaller than predicted by theory and appeared to be insensitive to the number of hydrogen bonds connecting the base pairs. Knowing that DNA bases interact strongly with gold electrodes,13,14 we reasoned that the ribose sugar ring must have played the valuable role of keeping the bases up off the electrode in the case of measurements made with 5′-thiolated nucleosides (as confirmed by FTIR measurements7). We therefore modified DNA bases with a thiolated ethylene linker, in the hope that this would keep the bases off the surface, but this also produced small signals that were insensitive to the number of hydrogen bonds holding the pairs together. However, when we first functionalized the gold substrate with an octanethiol monolayer, and subsequently exposed the monolayer to thiolated bases, we discovered new, high current features in the tunnel current data that correlate well with the predictions of density functional calculations, suggesting that this approach mitigates the base-gold interactions, leaving some fraction of the bases in an upright position in the SAM.
The tunnel gaps used in this work had to be made smaller than those used to record signals from base-nucleoside pairs, resulting in an increased risk of artifacts that generate telegraph noise from sources other than a hydrogen-bonding event in the gap. This paper describes a second innovation, which is the adaptation of a combined AC-DC measurement introduced by Tao to verify the interpretation of break junction data.15 In this method, a small AC modulation is applied to the Z-PZT, resulting in a corresponding AC component in the tunnel current. The magnitude of this modulation is related to the stiffness of the molecular junction. A stiff molecule spanning the electrodes will diminish the modulation relative to the free junction. In the case of break-junction measurements, steps in the plot of DC current vs. gap extension can be associated with trapped molecules if the AC modulation is reduced when the molecule is bound. We have applied the same approach to telegraph noise signals. In this case, we expect to see an anti-correlation between the magnitude of the normalized AC signal and that of the DC signal. As the molecules bind across the tunnel gap, the DC signal jumps up, while the AC signal jumps down. This is precisely what is observed for most of the data, and we have used this signature as our criterion for collecting “good” data.
Experimental Methods
Reagents, chemicals and characterization
The desired tunneling geometries are illustrated in Figure 1. 8-mercaptoguanine (G in Fig. 1A) 8-mercaptoadenine (A in Fig. 1B) and 2-amino-8-mercatpto-adenine (2AA in Fig. 1C) were used as received from Aldrich. 1-(2-Thioacetate ethyl)cytosine and 1-(2-thioacetate ethyl)thymine were synthesized and characterized as described in the supporting information. Monolayers were prepared and characterized on freshly flame-annealed gold-on-mica substrates following the published procedures.16 Gold STM probes were prepared and functionalized as described elsewhere.7,17
Figure 1.

Interactions between a purine on the STM probe and a pyrimidine embedded in an octanethiol SAM. (A) Guanine-cytosine, (B) adenine-thymine and (C) 2-aminoadenine-thymine.
Monolayers of 1-(2-mercaptoethyl)cytosine(i in Fig. 1A) and 1-(2-mercaptoethyl)thymine(ii in Fig. 1B and C) on Au(111) were prepared by immersing the Au substrates in 1mM solutions of 1-(2-thioacetate ethyl)cytosine and 1-(2-thioacetate ethyl)thymine in DMF that were deacetylated with pyrrolidine before use, respectively, for about 2 hours, and then rinsing with DMF and trichlorobenzene sequentially and blown dry with nitrogen. Ellipsometry measurements16 were indicative of the formation of monolayers or submonolayers. The quality of FTIR spectra was not adequate to determine orientation of the films. (see supporting online information).
We prepared mixed SAMs as follow: freshly annealed Au(111) films were immersed in 5mM octanethiol (Sigma Aldrich) in toluene for about 20 hours, forming highly ordered SAMs (Figure 2A). After rinsing with toluene, they were immersed in 1 mM solutions of the thiolated pyrimidines (i and ii) for a further 2 hours. The films were then rinsed with DMF and kept under clean toluene for a another half hour. This final step was critical for the formation of a high quality mixed SAM (Figure 2B). The films were characterized by ellipsometry which excluded the possibility of multilayer. The FTIR spectra suggest the coexistence of both molecules in the mixed SAM (supporting online information).
Figure 2.
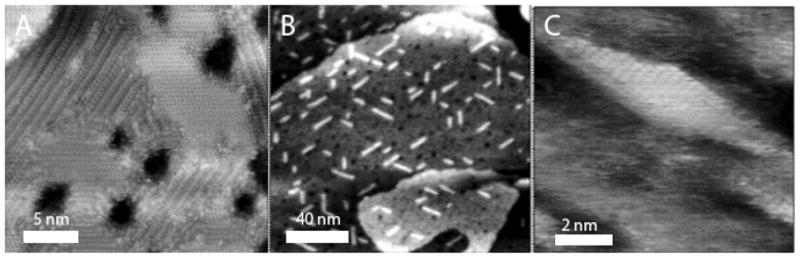
High resolution STM images of SAMs: (A) octanethiol SAM showing a mixture of domains of upright molecules and molecules lying flat on Au (111). (B) After insertion of 1-(2-mercapto ethyl)thymine, showing stripes of an ordered thymine phase. (C) Zoom in on one of the thymine stripes showing molecular-scale structure. Images were obtained in 1,2,4 trichlorobenzene at −0.1 V (tip bias) and 10 pA using Pt-Ir probes.
Mixed monolayers containing thymine displayed a remarkable structure in STM images (Figure 2B). Bright striped phases were formed (not seen in the alkanethiol monolayers alone) and zooming in on them (Figure 2C) showed structures suggestive of rows of stacked thymines. The spacing between adjacent rows was ~ 0.35 nm and the spacing between the disk-like features in the rows was ~0.25 nm. We could not resolve molecular scale features in the mixed SAMs containing guanine.
Tunneling measurements and imaging
A PicoSTM (Agilent, Chandler) scanning tunneling microscope was used for both tunneling measurements and imaging of the mixed SAMs. During measurements, both tip and sample substrate are submerged infreshly-distilled1,2,4-trichlorobenzene. For high resolution imaging, we used Pt-Ir probes prepared as described elsewhere.18
For measurements of telegraph noise, the functionalized tip was left to stabilize in close proximity to the substrate for at least 30 minutes. After approaching the tip to the surface to obtain a desired baseline conductance, GBL, the current servo was turned off, and the gap was controlled manually via a Labview program which adjusts the z-PZT. Once the gap was stable for periods of 10s or so with no further manual adjustment, runs of telegraph noise were collected. Data were collected over a range of baseline conductances between 5 and 70 nS (corresponding to currents between 0.25and 3.5 nA with tip biases of 0.05 volts). Telegraph noise was not observed for gap conductances less than 5 nS. Further details are given elsewhere.6
For the data reported here, we also applied a2kHz AC modulation to the z-PZT, adjusted to give a peak to peak amplitude of 0.016nm was used. This frequency is much higher than the telegraph noise frequency of around 150Hz. The amplitude of the in-phase response was recorded using a lock-in (Stanford Research SR 830). During data acquisition, data from 3 channels was collected simultaneously using a digital oscilloscope (Yokogawa DL750). These signals were (1)DC current (collected through a 400 Hz low pass filter), (2) AC+DC current (full bandwidth) and (3) AC amplitude from the lock-in amplifier with the time constant set to 3 ms.
An example of a typical set of raw data is shown in Figure 3. The DC current (lower panel) shows discrete jumps between the baseline conductance and a larger value associated with the stochastic bridging of the gap by a bonded molecular pair. The normalized AC signal (top trace), obtained by dividing the AC amplitude signal by the DC current signal, remains constant if there is no molecule trapped in the gap, but falls when a molecule is trapped. 15 This is because, with IDC = I0 exp(−βz), the AC current, for small modulation amplitudes, A, is given by IAC = βAIDC. Thus, if β and A do not change, the normalized AC current, IAC/IDC, remains constant (Chang, manuscript in preparation). A trapped molecule will generally lower both β and A (the letter because of the increased stiffness of the junction). In the case of the telegraph noise measurement, this is observed as a fall in the AC signal when the gap is bridged (i.e., when the DC signal rises) as shown in Figure 3.
Figure 3.
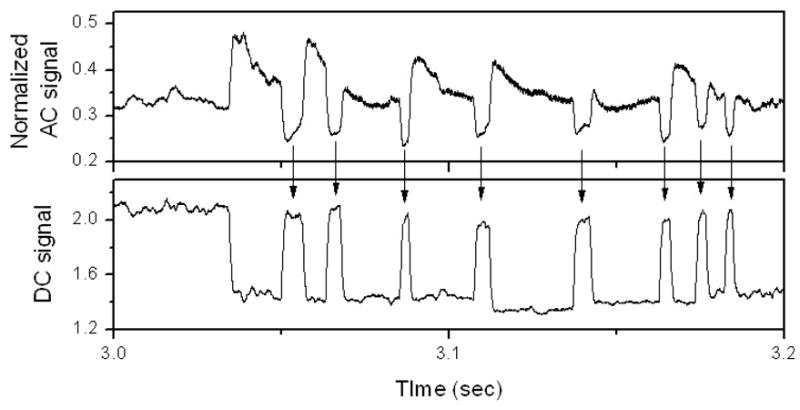
Showing how the AC modulation signals (top trace) and the DC current signal (bottom trace) are anti-correlated, evidence of molecular binding and unbinding in the tunnel gap.
Results and Discussion
Scatter plots of the molecular conductance, ΔGON, vs the baseline conductance, GBL, are shown for A-T, G-C and 2AA-T in Figures 4, 5 and 6. In each case, data for the pure SAM are shown in the top panel (4A, 5A and 6A) and data for the mixed SAMs are shown in the lower panels (4C, 5C and 6C). Corresponding histograms of the molecular conductances are shown on the right (4B and D, 5B and D and 6B and D). These data show the broad spread that comes from variations in the contact geometry, with the trend of increasing ΔGON with increasing GBL previously reported for measurements of this kind.6 Common (low energy) configurations give rise to “plateau” regions in these plots, represented by a peak in the distribution of conductances6 (Figure 4B and D, 5B and D and 6B and D).
Figure 4.

Scatter plots of molecular conductance, ΔGon vs. the baseline tunnel conductance GBL for (A) adenine interacting with thymine monolayers and (C) adenine interacting with thymine inserted into octanethiol monolayers. Histograms of the molecular conductance are shown to the right (B – pure SAM, D- mixed SAM).
Figure 5.

Scatter plots of molecular conductance, ΔGon vs. the baseline tunnel conductance GBL for (A) 2-aminodenine interacting with thymine monolayers and (C) 2-aminoadenine interacting with thymine inserted into octanethiol monolayers. Histograms of the molecular conductance are shown to the right (B – pure SAM, D- mixed SAM). The arrow points to a new high conductance feature observed in the conductance distribution in the mixed SAM.
Figure 6.

Scatter plots of molecular conductance, ΔGon vs. the baseline tunnel conductance GBL for (A) guanine interacting with cytosine monolayers and (C) 2-aminoadenine interacting with cytosine inserted into octanethiol monolayers. Histograms of the molecular conductance are shown to the right (B – pure SAM, D- mixed SAM). The arrow points to a new high conductance feature observed in the conductance distribution in the mixed SAM.
The pure SAMs all show one peak in the conductance histogram, and Gaussian fits (supporting information) yield the peak values and widths shown in Table 1. They show no significant changes with the number of bridging hydrogen bonds. We also calculated the average bound state lifetimes directly from the telegraph noise traces6 and values are shown in Table 1. The bound states persist for longer for triply hydrogen bonded pairs7 but no significant differences are observed here.
Table 1.
Telegraph noise characteristics for basepairs.
| A on T | AA on T | G on C | |
|---|---|---|---|
|
Pure SAM Conductance (nS) |
4.49±1.28 | 2.67±1.16 | 4.77±0.71 |
|
Mixed SAM Peak 1 Conductance (nS) |
3.42±0.46 | 2.75±0.97 | 3.41±1.00 |
| Peak 2 Conductance (nS) | 15.24±0.57 | 12.30±0.94 | |
| Theoretical value (nS)* | 3.0 (22.2) | 16.1 (119) | 11.3 (83.8) |
| Average lifetime (ms) | 6.30±2.64 | 6.65±3.61 | 7.60±2.73 |
The values in the parenthesis are calculated for pyrimidines with thiol groups directly bonded to the heterocycle
Theoretical values for basepairs, including 2AA-T, have been calculated by Lee and Sankey.12 These calculations were carried out for pyrimidines attached to gold electrodes by a thiol group directly bonded to the heterocycle, and the corresponding values are shown in parenthesis in Table 1. Note the large range in the predicted conductances for the three molecular pairs, and the large predicted difference between conductances for two-and three-hydrogen bond connections (a factor between 4 and 5X). This is in sharp contrast to values calculated for base-nucleoside pairs where the number of hydrogen bonds makes little difference to the predicted (and measured) molecular conductance.7
The theoretical predictions for the bases do not take account of the ethylene linkages used in the present work. We expect the conductances of the ethylene-tethered bases (Fig. 1) to be lower by a factor e−2 because the electronic decay constant β, for alkanes tethered to gold via a thiol linkage is 1 per methylene. 19 Appropriately corrected values of the predicted conductance are shown in Table 1.
Data for the mixed SAMs (Figures 4C, 5C and 6C with corresponding histograms given in 4D, 5D and 6D) show evidence of a second plateau at a higher value of conductance for the two triply hydrogen bonded complexes. Fits to the conductance distributions for these mixed SAMs are shown in Figure 7 with the corresponding peak positions and widths listed in Table 1.
Figure 7.

Gaussian fits to the conductance distributions for the mixed pyrimidine SAMs. (A) A-T, (B) 2AA-T and (C) G-C. The arrows indicate the high conductance peaks.
The adenine-thymine data from mixed SAMs are little changed from what was observed in the pure film, both in peak position and peak width (see Table 1). Does this mean that the thymine configuration is little different between the pure and mixed SAMs? This is a possibility, in that thymine has the weakest intrinsic interaction with gold13 so the data obtained from the pure SAM could have come from properly hydrogen bonded pairs. However, we can rule this possibility out, both because of the striking degree of alignment of the thymines in the mixed film (Figure 2) and because of the appearance of a new conductance peak in the 2AA-T data (see below). This implies that the thymine orientation must be altered when the molecules are embedded in the octanethiol monolayer. Therefore it appears that the distribution of conductances measured for a vertically oriented array of thymines coincidentally overlaps the distribution measured over the pure film (where, presumably, there are possibilities for even quite exotic interactions like π-stacking20).
The appearance of a second, high conductivity peak in the mixed-SAM distributions for 2AA-T and G-C (Figure 5 and 6) must be a consequence of an increased frequency of vertical orientations that enable proper hydrogen bonding of the purine and pyrimidine. The continued presence of a significant low conductance peak shows that the interactions are still far from uniform. Comparing the theoretical predictions (listed in Table 1) to the values of the second peaks for 2AA-T and G-C, and to the only peak for A-T, shows an uncanny degree of agreement. The absolute scale of the agreement cannot be taken too literally because of the many uncertainties in calculations of this sort.21 The correspondence between predicted ratios of conductance (2AA-T>G-C≫A-T) is significant, capturing the predicted order 2AA-T > G-C for the triply hydrogen bonded complexes.
Conclusions
The predicted trends in conductance for three DNA basepairings (2AA-T, G-C and AT) are not observed in single molecule conductance measurements made with monolayer of thiolated bases attached to bare gold electrodes. New features appear in the conductance distributions for 2AA-T and G-C when the bases on the substrate are inserted into an octanethiol SAM. If these features arise from properly hydrogen bonded base pairs, then a remarkable agreement with theory is found. Mixed SAMs may offer a powerful approach for carrying out recognition tunneling with reagents that have a strong intrinsic chemical interaction with the electrodes.
Supplementary Material
Acknowledgments
We acknowledge financial support from the DNA sequencing technology program of the National Institute of Human Genome Research (HG004378).
Footnotes
Experimental details, including chemical synthesis of 1-(2-thioacetate ethyl)cytosine and 1-(2-thioacetate ethyl)thymine, Ellipsometry and FTIR results, and conductance histograms for the pure SAMs. This material is available free of charge via the Internet at http://pubs.acs.org.
References
- 1.Lee JW, Thundat T. DNA and RNA sequencing by nanoscale reading through programmable electrophoresis and nanoelectrode-gated tunneling and dielectric detection US. 2005 [Google Scholar]
- 2.Zwolak M, Di Ventra M. Nano Lett. 2005;5:421. doi: 10.1021/nl048289w. [DOI] [PubMed] [Google Scholar]
- 3.Zwolak M, Di Ventra M. Reviews of Modern Physics. 2008;80:141. [Google Scholar]
- 4.Branton D, Deamer D, Marziali A, Bayley H, Benner SA, Butler T, Di Ventra M, Garaj S, Hibbs A, Huang X, Jovanovich SB, Krstic PS, Lindsay S, Ling XS, Mastrangelo CH, Meller A, Oliver JS, Pershin YV, Ramsey JM, Riehn R, Soni GV, Tabard-Cossa V, Wanunu M, Wiggin M, Schloss J. Nature Biotechnology. 2008;26:1146. doi: 10.1038/nbt.1495. [DOI] [PMC free article] [PubMed] [Google Scholar]
- 5.Cui XD, Primak A, Zarate X, Tomfohr J, Sankey OF, Moore AL, Moore TA, Gust D, Harris G, Lindsay SM. Science. 2001;294:571. doi: 10.1126/science.1064354. [DOI] [PubMed] [Google Scholar]
- 6.Lindsay S, He J, Sankey O, Hapala P, Jelinek P, Zhang P, Chang S, Huang S. Nanotechnology. 2010;21:262001. doi: 10.1088/0957-4484/21/26/262001. [DOI] [PMC free article] [PubMed] [Google Scholar]
- 7.Chang S, He J, Lin L, Zhang P, Liang F, Young M, Huang S, Lindsay S. Nanotechnology. 2009;20:075102. doi: 10.1088/0957-4484/20/18/185102. [DOI] [PMC free article] [PubMed] [Google Scholar]
- 8.Chang S, Huang S, He J, Liang F, Zhang P, Li S, Chen X, Sankey OF, Lindsay SM. Nano Letters. 2010;10:1070. doi: 10.1021/nl1001185. [DOI] [PMC free article] [PubMed] [Google Scholar]
- 9.Haiss W, Nichols RJ, Zalinge Hv, Higgins SJ, Bethell D, Schiffrin DJ. Phys Chem Chem Phys. 2004;6:4330. [Google Scholar]
- 10.Haiss W, Wang C, Grace I, Batsanov AS, Schiffrin DJ, Higgins SJ, Bryce MR, Lambert CJ, Nichols RJ. Nature Materials. 2006;5:995. doi: 10.1038/nmat1781. [DOI] [PubMed] [Google Scholar]
- 11.Lee M. Electronic Structure Simulations of DNA base recognition and Vibrational Property Analysis of Polyanionic Hydrides. Arizona State University; 2009. [Google Scholar]
- 12.Lee MH, Sankey OF. Phys Rev E. 2009;79:051911 1. doi: 10.1103/PhysRevE.79.051911. [DOI] [PubMed] [Google Scholar]
- 13.Kimura-Suda H, Petrovykh DY, Tarlov MJ, Whitman LJ. J Am Chem Soc. 2003;125:9014. doi: 10.1021/ja035756n. [DOI] [PubMed] [Google Scholar]
- 14.Ostblom M, Liedberg B, Demers LM, Mirkin CA. J Phys Chem B. 2005;109:15150. doi: 10.1021/jp051617b. [DOI] [PubMed] [Google Scholar]
- 15.Xia JL, Diez-Perez I, Tao NJ. Nano Lett. 2008;8:1960. doi: 10.1021/nl080857a. [DOI] [PubMed] [Google Scholar]
- 16.He J, Lin L, Zhang P, Lindsay SM. Nano Letters. 2007;7:3854. doi: 10.1021/nl0726205. [DOI] [PMC free article] [PubMed] [Google Scholar]
- 17.Chang S, He J, Kibel A, Lee M, Sankey OF, Zhang P, Lindsay SM. Nature Nanotechnology. 2009;4:297. doi: 10.1038/nnano.2009.48. [DOI] [PMC free article] [PubMed] [Google Scholar]
- 18.Nagahara LA, Thundat T, Lindsay SM. Rev Sci Instrum. 1989;60:3128. [Google Scholar]
- 19.Li X, He J, Hihath J, Xu B, Lindsay SM, Tao NJ. J Am Chem Soc. 2006;128:2135. doi: 10.1021/ja057316x. [DOI] [PubMed] [Google Scholar]
- 20.Wu SM, Gonzalez MT, Huber R, Grunder S, Mayor M, Schoenenberger C, Calame M. Nature Nanotechnology. 2008;3:569. doi: 10.1038/nnano.2008.237. [DOI] [PubMed] [Google Scholar]
- 21.Lindsay SM, Ratner MA. Advanced Materials. 2007;19:23. [Google Scholar]
Associated Data
This section collects any data citations, data availability statements, or supplementary materials included in this article.