

Abstract
AIM
Asymmetric (ADMA) and symmetric dimethylarginine (SDMA) are produced by breakdown of proteins that have been methylated post-translationally at an arginine residue. Plasma levels of ADMA are elevated in insulin resistance states. Nonalcoholic fatty liver disease (NAFLD) is associated with insulin resistance and varying degrees of hepatic dysfunction. Since ADMA is metabolized in the liver, we hypothesized that ADMA levels will be high in patients with NAFLD as a consequence of hepatic dysfunction and insulin resistance.
METHODS
Plasma levels of ADMA, SDMA, total homocysteine, glucose and insulin were measured in non-diabetic patients with biopsy-proven NAFLD (11steatosis and 24 NASH) and 25 healthy subjects.
RESULTS
Plasma ADMA levels were significantly higher (p = 0.029) in patients with biopsy-proven NAFLD (0.43±0.21 μmol/L) compared with controls (0.34±0.10 μmol/L). However, when adjusted for insulin resistance (HOMA) the difference between two groups was not evident. Plasma SDMA levels were similar in all 3 groups.
Plasma levels of ADMA were positively correlated with plasma total homocysteine levels (p=0.003). . Plasma levels of SDMA were negatively correlated with estimated glomerular filtration rate (p=0.016) and positively correlated with plasma total homocysteine levels (p=0.003). The ratio of ADMA/SDMA was positively correlated with body mass index (BMI) (p = 0.027).
CONCLUSION
Elevated plasma concentrations of ADMA in biopsy-proven NAFLD were primarily related to insulin resistance. Hepatic dysfunction in NAFLD does not appear to make significant contribution to changes in plasma methylarginine levels.
Keywords: NASH, steatosis, ADMA, SDMA, insulin resistance, NAFLD
INTRODUCTION
Methylated arginines, NG′-methyl-L-arginine (monomethylarginine, MMA), NG,NG′-dimethyl-L-arginine (symmetric dimethylarginine, SDMA) and NG,NG-dimethyl-L-arginine (asymmetric dimethylarginine, ADMA) are generated by the cleavage of proteins that are post-translationally methylated at the arginine residues. Proteins with methylated arginines play essential regulatory role, including signal transduction, RNA transcription, and DNA repair (1). ADMA and MMA are inhibitors of nitric oxide synthase (NOS) that catalyzes the conversion of L-arginine to nitric oxide (NO), a potent endogenous vasodilator (2,3). Elevated levels of ADMA have also been identified as a risk factor for endothelial dysfunction (4,5). Plasma levels of ADMA are related to its release from protein breakdown and to its disposal through its cleavage to dimethylamine and citrulline by the enzyme dimethylarginine hydrolase (DDAH). Although DDAH is present in the liver, pancreas, spleen, and kidney, hepatic DDAH plays a dominant role in the removal of plasma ADMA (6,7). High circulating levels of ADMA are associated with hyperhomocysteinemia, a key intermediate in methionine metabolism. Studies of cardiac microvascular endothelial cells in culture showed that high levels of homocysteine inhibited the expression of DDAH and resulted in accumulation of ADMA in the medium (9). SDMA is not metabolized by DDAH and is primarily eliminated by renal excretion, consequently, impaired kidney function results in higher levels of SDMA in the plasma (10).
Higher plasma ADMA levels have been reported in insulin resistance states (11) and in subjects with Type 1 and Type 2 diabetes (12,13). Plasma ADMA levels have been shown to decrease in response to improvement in insulin sensitivity in obese women (14). In addition, hepatic dysfunction is associated with high plasma levels of ADMA (6,7,15). Non-alcoholic fatty liver disease (NAFLD) is the hepatic component of metabolic syndrome and is associated with systemic insulin resistance (16). NAFLD spans from steatosis, the accumulation of fat droplets in hepatocytes or fatty liver, to the more severe form, i.e. steatohepatitis, characterized by steatosis plus lobular inflammation accompanied by ballooning degeneration of hepatocytes with and without fibrosis. NAFLD is associated with systemic insulin resistance and evidence of increased oxidative stress (16,17). These metabolic perturbations have been suggested to impair hepatic DDAH activity and could result in changes in plasma concentrations of methylarginines (15,18). In the present study we have quantified plasma levels of ADMA and SDMA in non-diabetic subjects with biopsy-proven NAFLD and examined their relationship to insulin resistance, hepatic steatosis and NASH. We hypothesized that as a consequence of hepatic dysfunction, plasma ADMA levels would be higher in patients with NASH and steatosis as compared with healthy control subjects.
METHODS
Thirty-five non-diabetic subjects with histologically diagnosed NAFLD (11 hepatic steatosis and 24 NASH) were recruited from the liver clinics of the Cleveland Clinic and MetroHealth Medical Center in Cleveland, Ohio. Liver biopsies were reviewed in a blinded manner by the same pathologist and given a NASH activity score (0–8) (19). Subjects with diabetes mellitus and subjects with the plasma creatinine higher than 1.5 mg/dl were excluded from the study. Twenty-five healthy subjects in the control group had normal blood chemistry and no evidence of steatosis by ultrasound examination (20). Written informed consent was obtained from all subjects. The protocol was approved by the Institutional Review Boards of MetroHealth Medical Center and the Cleveland Clinic Foundation.
Subjects reported to the General Clinical Research Center at 7 AM following 12 hours of fasting. After a 30 minute rest period, three venous blood samples were obtained 5 minutes apart for the measurement of plasma glucose and insulin concentrations. Additional blood was collected into EDTA-containing tubes. Blood samples were centrifuged at 4°C and plasma obtained was stored at −80°C.
Monomethylarginine (MMA), monoethylarginine (MEA), ADMA, and SDMA standards were purchased from Calbiochem (Darmstadt, Germany). L-Arginine was obtained from Pierce (Rockford, IL). o-Phthaldialdehyde (OPA) was from Fluka (Bucks, Switzerland). All other chemicals were obtained from Fisher (Pittsburg, PA) and Sigma-Aldrich (St. Louis, MO). Oasis MCX cation-exchange solid phase extraction (SPE) cartridges (1 ml) were purchased from Waters (Milford, MA).
Plasma ADMA and SDMA were analyzed by HPLC using a fluorescent detector as described by Teerlink and colleagues with minor modifications (21). Analytes were separated isocratically with the mobile phase consisting of 25 mM potassium phosphate buffer (pH 6.5) with 7% acetonitrile. MEA was used as an internal standard. This non-physiological L-arginine derivative is a preferable internal standard than homoarginine, MMA, or monopropylarginine (21,22), since both homoarginine and MMA are present in small quantities in human plasma. Monopropylarginine is a non-physiological compound; however its chromatographic properties are similar to those of ADMA and SDMA. Fifty μl of 2.8 μM MEA (internal standard) was added to200 μl of the standard solutions or to the plasma samples. The final concentration of internal standard in plasma samples was 0.56 uM. Methylarginines were separated by solid phase cation-exchange chromatography. Analytes were eluted with 1 ml of a mixture 30% ammonium hydroxide, 1 M sodium hydroxide, water, and methanol (10/0.5/40/50), evaporated to dryness and then reconstituted in 100 μl water. Fifty μl of reconstituted eluent was derivatized with 50 μl of freshly prepared 7.5 mM OPA + 11.5 mM 3-mercaptopropionic acid solution in methanol/potassium borate buffer, pH 9.5. The standard curves were constructed based on the chromatographic peak area ratios of MMA/MEA, ADMA/MEA, and SDMA/MEA. Intercepts of calibration curves were not significantly different from zero (regression coefficient 0.99). The lower limits of quantification, defined as the lowest point in the calibration curve with a signal/noise ratio equal to 10, were 4.71 ng/mL, 4.05 ng/mL, and 5.06 ng/mL for MMA, SDMA, and ADMA, respectively. Intra- and inter-assay variation coefficients for SDMA and ADMA were <2.5% and <4.0% –
Plasma glucose was measured using the glucose oxidase method (Beckman glucose analyzer) and plasma insulin levels were measured using a commercial ELISA kit (Linco Research; St. Charles, MO). HOMA (homeostasis model assessment) was calculated as a measure of insulin resistance (http://www.dtu.ox.ac.uk/homa). The HOMA model calculates insulin resistance based on simultaneous measurements of plasma glucose and insulin in overnight-fasted subjects (23). Plasma total homocysteine levels were measured by HPLC (24). Serum alanine and aspartate aminotransferases (AST, ALT) were measured by standard methods in the clinical laboratory.
Glomerular filtration rate (eGFR) was estimated using Modification of Diet in Renal Disease (MDRD) formula (25).
Statistical Analysis
The data were analyzed by Student’s t-test for comparison of results between control and combined NAFLD groups (steatosis + NASH). P<0.05 was considered statistically significant. Analysis of variance (ANOVA) was used to assess differences in continuous variables such as plasma levels of ADMA, SDMA and ADMA/SDMA ratio. When at least one group was significantly different from the others, pair-wise comparisons were performed using the Bonferroni adjustment for multiple comparisons. If the distributional assumptions were not met then Kruskall-Wallis tests and Dunn’s multiple comparison procedure were used to compare the groups. Spearman’s correlation coefficients were used to assess associations between plasma ADMA, SDMA and ADMA/SDMA insulin resistance and homocysteine. Finally, analysis of covariance (ANCOVA) was used to assess differences in plasma ADMA, SDMA and ADMA/SDMA between the 3 groups adjusting for insulin resistance (HOMA). SAS version 9.1 software (The SAS Institute, Cary, NC) was used to perform all analyses.
RESULTS
The clinical and biochemical characteristics of the study subjects are summarized in Table 1. Subjects with NAFLD had significantly higher (p<0.001) body mass index [BMI: wt (kg)/height m2] compared with controls. BMI was not significantly different amongst patients with steatosis and with NASH. Serum AST and ALT were significantly higher (p<0.001) in patients with NASH compared with patients with steatosis and healthy controls. Plasma triglyceride and insulin concentrations were significantly higher (p=0.007 and p<0.015, respectively) in all patients with NAFLD than in control subjects (Table 1). Plasma glucose concentrations were significantly higher in NASH than healthy controls. Total homocysteine concentration in the plasma was significantly higher in subjects with NASH as compared with the controls. It should be underscored that plasma levels of total homocysteine in our population, controls and NAFLD, were within the normal range (<10 μmoles/L). Estimated glomerular filtration rate (eGFR) was not significantly different between groups.
Table 1.
Clinical and biochemical characteristics of the study subjects
| Factor | Controls (n=25) | Steatosis (n=11) | NASH (n=24) | P value |
|---|---|---|---|---|
| Age (years) | 42.0 (9.4) | 43.5 (10.7) | 43.6 (12.6) | NS |
| Male | 7 (28) | 6 (54.6) | 8 (33.3) | NS |
| Body Mass Index (kg/m2) | 23.3 (2.7) | 34.0 (4.0)* | 34.8 (4.7)* | <0.001 |
| Triglycerides (mg/dL) | 77.0 (64.0, 93.0) | 159.0 (115.0, 174.0)* | 160.0 (94.5, 216.5)* | 0.007 |
| Glucose (mmol/L) | 4.7 (4.4, 4.8) | 5.0 (4.5, 5.3) | 5.1 (4.7, 5.5)* | 0.015 |
| Insulin (pmol/L) | 50.0 (39.4, 64.4) | 111.6 (95.8, 188.9)* | 147.0 (113.3, 236.1)* | <0.001 |
| AST | 22.0 (18.0, 27.0) | 30.0 (19.0, 37.0) | 47.0 (32.0, 76.5)† | <0.001 |
| ALT | 16.0 (13.0, 22.0) | 35.0 (21.0, 61.0)* | 58.0 (46.0, 118.5)* † | <0.001 |
| Total homocysteine (μmol/L)# | 6.5 (5.7, 8.9) | 7.4 (6.7, 9.0) | 8.8 (7.9, 10.6)* | 0.006 |
| eGFR | 86.3 (79.7, 96.2) | 81.4 (74.1, 84.1) | 88.6 (73.3, 97.0) | NS |
Statistics presented are Mean (SD), Median (Q25, Q75) or N (%)
Measured for 20 controls, 11 steatosis and 23 NASH patients.
Significantly different from controls;
Significantly different from controls and steatosis group (p<0.017)
eGFR: estimated glomarular filtration rate (calculated as described in Methods)
The calculated HOMA scores (measure of insulin resistance) were significantly higher (p<0.001) in patients with biopsy-proven NAFLD (Table 2). Plasma ADMA and SDMA levels were not significantly different between controls and patients with steatosis or NASH (Table 2). Since the steatosis group was small (n=11), we combined the steatosis and NASH, all NAFLD, for further analysis. When steatosis and NASH groups were combined, plasma levels of ADMA were significantly higher (p<0.015) in patients with NAFLD (0.43±0.21 μmol/L) as compared with the control subjects (0.34±0.10 μmol/L) (Figure 1). The circulating levels of SDMA were similar in controls and subjects with NAFLD. Higher plasma levels of ADMA in patients with NAFLD resulted in significantly higher (p<0.02) ADMA/SDMA ratio in these patients compared with that in controls (Figure 1).
Table 2.
Insulin resistance, plasma ADMA, SDMA and ADMA/SDMA ratio
| Factor | Controls (n=25) | Steatosis (n=11) | NASH (n=24) | P value |
|---|---|---|---|---|
| Insulin Resistance (HOMA) | 0.9 (0.7, 1.2) | 2.2 (1.8, 3.4)* | 2.8 (2.1, 4.3)* | <0.001 |
| ADMA (μmol/L) | 0.34 (0.1) | 0.41 (0.23) | 0.45 (0.21) | 0.13 |
| SDMA (μmol/L) | 0.25 (0.08) | 0.28 (0.13) | 0.28 (0.11) | 0.59 |
| ADMA/SDMA | 1.38 (0.23) | 1.49 (0.35) | 1.61 (0.41) | 0.053 |
Data are Median (Q25, Q75) for HOMA and Mean (SD) for others.
P values correspond to: Kruskal-Wallis tests for HOMA and ANOVA for others.
Significantly different from controls (p<0.02)
Figure 1.
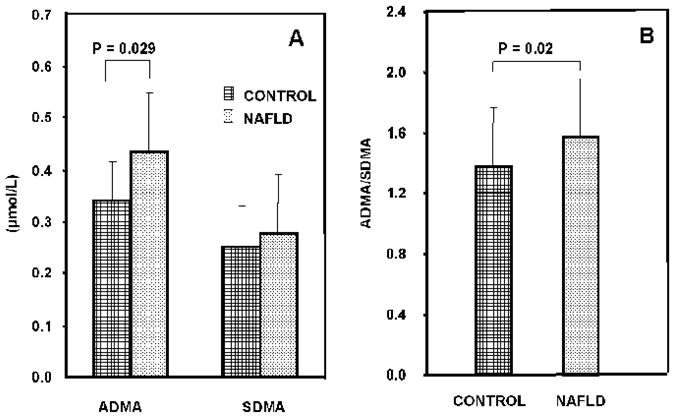
The plasma concentrations of ADMA and SDMA (panel A) and ADMA/SDMA ratio (panel B) in healthy controls and subjects with NAFLD.
Since insulin resistance is accompanied by higher plasma levels of ADMA (11,14,24), we examined whether the increase in ADMA levels were related to insulin resistance or the liver disease. When adjusted for HOMA score, the plasma concentrations of ADMA, SDMA or ADMA/SDMA ratios in patients with NAFLD were not significantly different from that in controls (Table 3).
Table 3.
Plasma ADMA, SDMA and ADMA/SDMA values adjusted* for HOMA
| Factor | Controls (n=25) | Steatosis (n=11) | NASH (n=24) | P value |
|---|---|---|---|---|
| ADMA (μmol/L) | 0.32 (0.23, 0.40) | 0.42 (0.31, 0.53) | 0.47 (0.38, 0.55) | 0.094 |
| SDMA (μmol/L) | 0.24 (0.19, 0.29) | 0.28 (0.22, 0.35) | 0.29 (0.24, 0.34) | 0.45 |
| ADMA/SDMA | 1.35 (1.18, 1.15) | 1.50 (1.30, 1.70) | 1.64 (1.48, 1.79) | 0.089 |
Values presented are mean (95% CI)
Adjusted means were obtained with an ANCOVA analysis.
Each factor (ADMA, SDMA, ADMA/SDMA) was modeled as the dependent variable and independent variables were NAFLD group, insulin resistance.
We examined the relationship between ADMA, SDMA, ADMA/SDMA ratio and clinical factors of interest in the entire subject population (controls and NAFLD, Table 4). As shown, plasma ADMA levels were positively correlated with plasma homocysteine levels (rho = 0.4; p= 0.003) (Table 4). Plasma SDMA levels were negatively correlated with eGFR (p<0.02). The ADMA/SDMA ratio was positively correlated with body mass index (BMI) (rho = 0.29; p= 0.027) and with eGFR (rho = 0.3; p=0.045).
Table 4.
Correlations between ADMA and SDMA and clinical factors of interest
| Factor | ADMA | SDMA | ADMA/SDMA | |||
|---|---|---|---|---|---|---|
| rho (95%) CI) | p value | rho (95%) CI) | p value | rho (95%) CI) | p value | |
| Insulin Resistance (HOMA) | 0.12 (−0.14,0.38) | 0.36 | −0.01 (−0.27,0.25) | 0.94 | 0.23 (−0.03,0.48) | 0.079 |
| Homocysteine | 0.40 (0.14,0.65) | 0.003 | 0.40 (0.14,0.65) | 0.003 | 0.07 (−0.21,0.35) | 0.6 |
| BMI | 0.15 (−0.11,0.41) | 0.27 | 0.02 (−0.24,0.29) | 0.86 | 0.29 (0.03,0.54) | 0.027 |
| eGFR | −0.08 (−0.36,0.21) | 0.59 | −0.33 (−0.60,−0.07) | 0.016 | 0.28 (0.01,0.55) | 0.045 |
| Albumin | −0.17 (−0.44,0.11) | 0.24 | −0.18 (−0.45,0.10) | 0.21 | 0.20 (−0.07,0.48) | 0.14 |
| Mean Blood Pressure | 0.20 (−0.06,0.46) | 0.14 | 0.16 (−0.10,0.42) | 0.23 | 0.18 (−0.09,0.44) | 0.18 |
Spearman correlation coefficients; p values correspond to testing the null hypothesis that rho = 0 and deemed to significant if p < 0.05.
BMI = body mass index; eGFR = estimated glomerular filtration rate
DISCUSSION
In the present study, we observed that the plasma levels of ADMA and ADMA/SDMA ratio, but not plasma SDMA levels, were higher in non-diabetic subjects with biopsy-proven NAFLD compared with that in controls. There was no difference in ADMA levels between subjects with steatosis and those with NASH. The plasma level of ADMA correlated positively with plasma levels of total homocysteine in the entire population. The plasma concentrations of SDMA and ADMA/SDMA ratio showed a significant correlation with the eGFR.
Plasma levels of ADMA in our control subjects were similar to those quantified by others using mass spectrometry (27–29) and HPLC techniques (21,22). After adjusting for insulin resistance (HOMA), plasma levels of ADMA in patients with biopsy-proven NAFLD were not different from those in controls. This suggests that the insulin resistance is the primary contributor to the higher plasma concentration of ADMA in the NAFLD subjects. Other investigators have reported that higher plasma levels of ADMA are associated with insulin resistance (12,26). The higher levels of ADMA in the insulin resistant state have been attributed to a higher rate of whole body protein turnover (14,26). Since plasma glucose concentrations were not significantly different amongst groups, the changes in ADMA may have been due to the differences in the plasma insulin concentrations.
Previous data show that hepatic dysfunction results in increased levels of ADMA in the plasma (7,15,30,31). In critically ill patients, hepatic dysfunction was associated with elevated ADMA levels, and was the strongest predictor of mortality (15). Plasma ADMA concentrations were elevated in the hepatic vein of patients with compensated cirrhosis (31), and decreased following liver transplantation and recovery of liver function (32). Our subjects were clinically compensated and did not show evidence of significant hepatic dysfunction. This may explain the lack of any observed differences in methylarginine concentrations between controls and NAFLD.
Increased generation of ADMA may also be related to an increased activity of protein methyltransferase (PRMT), the enzyme responsible for the methylation of arginine residue in cellular proteins. Cell culture studies in vitro have shown that inhibition of PRMT results in a reduction in ADMA synthesis by endothelial cells (4). Increased hepatic expression of PRMT in patients with alcoholic hepatitis was accompanied by higher plasma ADMA levels (33). PRMT utilizes S-adenosyl-L-methionine as the methyl donor resulting in the formation of S-adenosyl homocysteine and ultimately homocysteine. Although there is no direct evidence that high concentrations of homocysteine in-vivo inhibit DDAH activity, in-vitro data have demonstrated that homocysteine dose-dependently reduces the activity of recombinant human DDAH (34). High homocysteine levels by inhibiting DDAH activity could result in an increase in plasma ADMA levels (2,33). This is consistent with our observation of a significant positive correlation between plasma levels of ADMA and homocysteine levels (Table 4). A similar association between plasma levels of ADMA and homocysteine was also reported in a study of a general population (34).
The clinical significance of elevated plasma ADMA is related to its pathogenic role as an endogenous inhibitor of NO synthase and consequent endothelial dysfunction (3,6). Patients with NASH have been reported to have significantly greater endothelial dysfunction compared with those with simple steatosis (6,34,35). This may be a consequence of elevated plasma and tissue ADMA levels in these patients.
Our data show that the liver disease and insulin resistance in patients with NAFLD did not significantly affect the metabolism of SDMA. The positive correlation between plasma SDMA and eGFR is because SDMA is excreted primarily by the kidney.
The small sample size of the steatosis group (n=11) is a significant limitation of our present study. Thus, although there is a trend towards increase in methylarginine with disease severity (Table 2), the data are not statistically significant. Only a very large sample size can show continuous change with severity of disease.
In summary, plasma ADMA and ADMA/SDMA ratio were higher in subjects with biopsy-proven NAFLD. Plasma levels of ADMA were also significantly correlated with the plasma concentration of total homocysteine. Compensated hepatic dysfunction did not appear to contribute to the elevated plasma levels of ADMA of patients with non-alcoholic steatohepatitis.
Acknowledgments
This work was supported by start-up funds (to SCK) from the Cleveland Clinic Foundation, and by NIH grants DK079937 to SCK and CTSA 1UL1 RR024989 to Case Western Reserve University.
We thank the Clinical Research Unit staff for their help with the studies and Mrs. Joyce Nolan for secretarial assistance.
Footnotes
Publisher's Disclaimer: This is a PDF file of an unedited manuscript that has been accepted for publication. As a service to our customers we are providing this early version of the manuscript. The manuscript will undergo copyediting, typesetting, and review of the resulting proof before it is published in its final citable form. Please note that during the production process errors may be discovered which could affect the content, and all legal disclaimers that apply to the journal pertain.
References
- 1.McBride AE, Silver PA. State of the arg: protein methylation at arginine comes of age. Cell. 2001;106:5–8. doi: 10.1016/s0092-8674(01)00423-8. [DOI] [PubMed] [Google Scholar]
- 2.Vallance P, Leone A, Calver A, Collier J, Moncada S. Endogenous dimethylarginine as an inhibitor of nitric oxide synthesis. J Cardiovasc Pharmacol. 1992;20:S60–2. doi: 10.1097/00005344-199204002-00018. [DOI] [PubMed] [Google Scholar]
- 3.Leiper J, Nandi M, Torondel B, et al. Disruption of methylarginine metabolism impairs vascular homeostasis. Nature Med. 2007;13:198–203. doi: 10.1038/nm1543. [DOI] [PubMed] [Google Scholar]
- 4.Boger RH, Bode-Boger SM, Szuba A, et al. Asymmetric dimethylarginine (ADMA): a novel risk factor for endothelial dysfunction: its role in hypercholesterolemia. Circulation. 1998;98:1842–7. doi: 10.1161/01.cir.98.18.1842. [DOI] [PubMed] [Google Scholar]
- 5.Horowitz JD, Heresztyn T. An overview of plasma concentrations of asymmetric dimethylarginine (ADMA) in health and disease and in clinical studies: methodological considerations. J Chromatogr B Analyt Technol Biomed Life Sci. 2007;851:42–50. doi: 10.1016/j.jchromb.2006.09.023. [DOI] [PubMed] [Google Scholar]
- 6.Siroen MP, Teerlink T, Nijveldt RJ, Prins HA, Richir MC, Van Leeuwen PA. The clinical significance of asymmetric dimethylarginine. Annu Rev Nutr. 2006;26:203–28. doi: 10.1146/annurev.nutr.26.061505.111320. [DOI] [PubMed] [Google Scholar]
- 7.Richir MC, Bouwman RH, Teerlink T, et al. The prominent role of the liver in the elimination of asymmetric dimethylarginine (ADMA) and the consequences of impaired hepatic function. J Parent Ent Nutr. 2008;32:613–21. doi: 10.1177/0148607108321702. [DOI] [PubMed] [Google Scholar]
- 8.Dayal S, Lentz SR. ADMA and hyperhomocysteinemia. Vasc Med. 2005;(10):S27–33. doi: 10.1191/1358863x05vm599oa. [DOI] [PubMed] [Google Scholar]
- 9.Tyagi N, Sedoris KC, Steed M, Ovechkin AV, Moshal KS, Tyagi SC. Mechanisms of homocysteine-induced oxidative stress. Am J Physiol Heart Circ Physiol. 2005;289:H2649–56. doi: 10.1152/ajpheart.00548.2005. [DOI] [PubMed] [Google Scholar]
- 10.Kielstein JT, Salpeter SR, Bode-Boeger SM, Cooke JP, Fliser D. Symmetric dimethylarginine (SDMA) as endogenous marker of renal function--a meta-analysis. Nephrol Dial Transplant. 2006;21:2446–51. doi: 10.1093/ndt/gfl292. [DOI] [PubMed] [Google Scholar]
- 11.Sydow K, Mondon CE, Cooke JP. Insulin resistance: potential role of the endogenous nitric oxide synthase inhibitor ADMA. Vasc Med. 2005;10:S35–43. doi: 10.1177/1358836X0501000106. [DOI] [PubMed] [Google Scholar]
- 12.Abbasi F, Asagmi T, Cooke JP, et al. Plasma concentrations of asymmetric dimethylarginine are increased in patients with type 2 diabetes mellitus. Am J Cardiol. 2001;88:1201–3. doi: 10.1016/s0002-9149(01)02063-x. [DOI] [PubMed] [Google Scholar]
- 13.Altinova AE, Arslan M, Sepici-Dincel A, Akturk M, Altan N, Toruner FB. Uncomplicated type 1 diabetes is associated with increased asymmetric dimethylarginine concentrations. J Clin Endocrinol Metab. 2007;92:1881–5. doi: 10.1210/jc.2006-2643. [DOI] [PubMed] [Google Scholar]
- 14.McLaughlin T, Stuhlinger M, Lamendola C, et al. Plasma asymmetric dimethylarginine concentrations are elevated in obese insulin-resistant women and fall with weight loss. J Clin Endocrinol Metab. 2006;91:1896–1900. doi: 10.1210/jc.2005-1441. [DOI] [PubMed] [Google Scholar]
- 15.Tsikas D, Rode I, Becker T, Nashan B, Klempnauer J, Frolich JC. Elevated plasma and urine levels of ADMA and 15(S)-8-iso-PGF2alpha in end-stage liver disease. Hepatology. 2003;38:1063–4. doi: 10.1053/jhep.2003.50455. [DOI] [PubMed] [Google Scholar]
- 16.McCullough AJ. Pathophysiology of nonalcoholic steatohepatitis. J Clin Gastroenterol. 2006;40:S17–29. doi: 10.1097/01.mcg.0000168645.86658.22. [DOI] [PubMed] [Google Scholar]
- 17.Videla LA, Rodrigo R, Orellana M, et al. Oxidative stress-related parameters in the liver of non-alcoholic fatty liver disease patients. Clin Sci (Lond) 2004;106:261–8. doi: 10.1042/CS20030285. [DOI] [PubMed] [Google Scholar]
- 18.Sydow K, Munzel T. ADMA and oxidative stress. Atheroscler Suppl. 2003;4:41–51. doi: 10.1016/s1567-5688(03)00033-3. [DOI] [PubMed] [Google Scholar]
- 19.Kleiner DE, Brunt EM, Van NM, et al. Design and validation of a histological scoring system for nonalcoholic fatty liver disease. Hepatology. 2005;41:1313–21. doi: 10.1002/hep.20701. [DOI] [PubMed] [Google Scholar]
- 20.Borch-Johnsen K. The new classification of diabetes mellitus and IGT: a critical approach. Exp Clin Endocrinol Diabetes. 2001;109:S86–93. doi: 10.1055/s-2001-18572. [DOI] [PubMed] [Google Scholar]
- 21.Teerlink T, Nijveldt RJ, de JS, Van Leeuwen PA. Determination of arginine, asymmetric dimethylarginine, and symmetric dimethylarginine in human plasma and other biological samples by high-performance liquid chromatography. Anal Biochem. 2002;303:131–7. doi: 10.1006/abio.2001.5575. [DOI] [PubMed] [Google Scholar]
- 22.Marra M, Bonfigli AR, Testa R, Testa I, Gambini A, Coppa G. High-performance liquid chromatographic assay of asymmetric dimethylarginine, symmetric dimethylarginine, and arginine in human plasma by derivatization with naphthalene-2,3-dicarboxaldehyde. Anal Biochem. 2003;318:13–17. doi: 10.1016/s0003-2697(03)00157-x. [DOI] [PubMed] [Google Scholar]
- 23.Hermans MP, Levy JC, Morris RJ, Turner RC. Comparison of insulin sensitivity tests across a range of glucose tolerance from normal to diabetes. Diabetologia. 1999;42:678–87. doi: 10.1007/s001250051215. [DOI] [PubMed] [Google Scholar]
- 24.Garcia AJ, Apitz-Castro R. Plasma total homocysteine quantification: an improvement of the classical high-performance liquid chromatographic method with fluorescence detection of the thiol-SBD derivatives. J Chromatogr B. 2002;779:359–63. doi: 10.1016/s1570-0232(02)00401-4. [DOI] [PubMed] [Google Scholar]
- 25.Nelson AW, Mackinnon B, Traynor J, Geddes CC. The relationship between serum creatinine and estimated glomerular filtration rate: implications for clinical practice. Scott Med J. 2006;51:5–9. doi: 10.1258/RSMSMJ.51.4.5. [DOI] [PubMed] [Google Scholar]
- 26.Marliss EB, Chevalier S, Gougeon R, et al. Elevations of plasma methylarginines in obesity and ageing are related to insulin sensitivity and rates of protein turnover. Diabetologia. 2006;49:351–9. doi: 10.1007/s00125-005-0066-6. [DOI] [PubMed] [Google Scholar]
- 27.Schwedhelm E. Quantification of ADMA: analytical approaches. Vasc Med. 2005;10:S89–95. doi: 10.1177/1358836X0501000113. [DOI] [PubMed] [Google Scholar]
- 28.Martens-Lobenhoffer J, Krug O, Bode-Boger SM. Determination of arginine and asymmetric dimethylarginine (ADMA) in human plasma by liquid chromatography/mass spectrometry with the isotope dilution technique. J Mass Spectrom. 2004;39:287–94. doi: 10.1002/jms.684. [DOI] [PubMed] [Google Scholar]
- 29.Martens-Lobenhoffer J, Bode-Böger SM. Chromatographic-mass spectrometric methods for the quantification of L-arginine and its methylated metabolites in biological fluids. J Chromatogr B Analyt Technol Biomed Life Sci. 2007;851:30–41. doi: 10.1016/j.jchromb.2006.07.038. [DOI] [PubMed] [Google Scholar]
- 30.Nijveldt RJ, Teerlink T, Siroen MP, et al. Elevation of asymmetric dimethylarginine (ADMA) in patients developing hepatic failure after major hepatectomy. J Parenter Enteral Nutr. 2004;28:382–7. doi: 10.1177/0148607104028006382. [DOI] [PubMed] [Google Scholar]
- 31.Vizzutti F, Romanelli RG, Arena U, et al. ADMA correlates with portal pressure in patients with compensated cirrhosis. Eur J Clin Invest. 2007;37:509–15. doi: 10.1111/j.1365-2362.2007.01814.x. [DOI] [PubMed] [Google Scholar]
- 32.Martin-Sanz P, Olmedilla L, Dulin E, et al. Presence of methylated arginine derivatives in orthotopic human liver transplantation: relevance for liver function. Liver Transpl. 2003;9:40–8. doi: 10.1053/jlts.2003.50008. [DOI] [PubMed] [Google Scholar]
- 33.Mookerjee RP, Malaki M, Davies NA, et al. Increasing dimethylarginine levels are associated with adverse clinical outcome in severe alcoholic hepatitis. Hepatology. 2007;45:62–71. doi: 10.1002/hep.21491. [DOI] [PubMed] [Google Scholar]
- 34.Stülinger MC, Tsao PS, Her JH, Kimoto M, Balint RF, Cooke JP. Homocysteine impairs the nitric oxide synthase pathway: role of asymmetric dimethylarginine. Circulation. 2001;104:2569–75. doi: 10.1161/hc4601.098514. [DOI] [PubMed] [Google Scholar]
- 35.Teerlink T. Measurement of asymmetric dimethylarginine in plasma: methodological considerations and clinical relevance. Clin Chem Lab Med. 2005;43:1130–8. doi: 10.1515/CCLM.2005.197. [DOI] [PubMed] [Google Scholar]