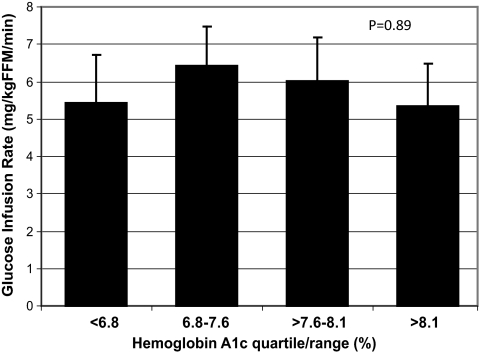
FIG. 4.
Insulin resistance does not correlate with poor glycemic control. Insulin sensitivity is expressed as glucose infusion rate per fat-free mass (GIR, mg/kg FFM/min) and shown by quartile of GHb measured 3 days before the clamp study day. GHb range for each quartile is shown and n = 10 for each quartile. Analysis by ANOVA yields a P value of 0.89 for differences between quartiles. Pairwise comparisons are all nonsignificant with P values ranging from 0.49 (2nd and 4th quartiles) to 0.96 (1st and 4th quartiles).

