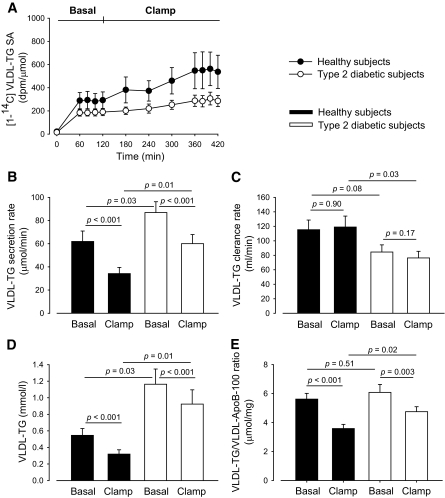
FIG. 3.
VLDL-TG–specific activity (A), VLDL-TG secretion rate (B), VLDL-TG clearance rate (C), VLDL-TG concentration (D), and VLDL-TG/VLDL-ApoB-100 ratio (E) in the VLDL-TG SA steady state periods. Black circles and bars, healthy subjects; open (white) circles and bars, type 2 diabetic subjects. Data are mean ± SEM.

