

Abstract
The rate of recombination is a key genomic parameter that displays considerable variation among taxa. Species comparisons have demonstrated that the rate of evolution in recombination rate is strongly dependent on the physical scale of measurement. Individual recombination hotspots are poorly conserved among closely related taxa, whereas genomic-scale recombination rate variation bears a strong signature of phylogenetic history. In contrast, the mode and tempo of evolution in recombination rates measured on intermediate physical scales is poorly understood. Here, we conduct a detailed statistical comparison between two whole-genome F2 genetic linkage maps constructed from experimental intercrosses between closely related house mouse subspecies (Mus musculus). Our two maps profile a common wild-derived inbred strain of M. m. domesticus crossed to distinct wild-derived inbred strains representative of two other house mouse subspecies, M. m. castaneus and M. m. musculus. We identify numerous orthologous genomic regions with significant map length differences between these two crosses. Because the genomes of these recently diverged house mice are highly collinear, observed differences in map length (centimorgans) are suggestive of variation in broadscale recombination rate (centimorgans per megabase) within M. musculus. Collectively, these divergent intervals span 19% of the house mouse genome, disproportionately aggregating on the X chromosome. In addition, we uncover strong statistical evidence for a large effect, sex-linked, site-specific modifier of recombination rate segregating within M. musculus. Our findings reveal considerable variation in the megabase-scale recombination landscape among recently diverged taxa and underscore the continued importance of genetic linkage maps in the post-genome era.
The rate of recombination—defined as the number of crossovers per unit DNA—is a quantitative genetic trait that displays marked variation within populations (Broman et al. 1998; Kong et al. 2002; Neumann and Jeffreys 2006; Cheng et al. 2009), between populations (Graffelman et al. 2007), and between species (True et al. 1996; Jensen-Seaman et al. 2004; Ptak et al. 2005; Winckler et al. 2005). Although a handful of loci contributing to recombination rate differences have been identified in house mice (Shiroishi et al. 1991; Grey et al. 2009; Parvanov et al. 2009, 2010), humans (Jeffreys and Neumann 2005; Kong et al. 2008; Chowdhury et al. 2009), and Drosophila (Chinnici 1971; Brooks and Marks 1986), the genetic architecture of recombination rate variation remains vaguely characterized. Theoretical models suggest that natural selection can act on recombination-modifying loci to alter the rate of recombination under a wide spectrum of ecological conditions (for review, see Otto and Lenormand 2002). However, few empirical studies offer explicit tests of these theoretical models, leaving the question of which evolutionary forces contribute to natural variation in recombination rate largely unanswered (Rice 2002; Dumont and Payseur 2008; Morran et al. 2009).
Understanding the causes of variation in recombination rate is a key challenge for genetics and evolution. The rate of recombination is a critical determinant of the fidelity of the meiotic process. Recombination rates that are too high or too low often give rise to aneuploid gametes or arrest the meiotic cell cycle (Hassold and Hunt 2001), outcomes that can reduce organismal fitness. In addition, recombination rates mold features of the genomic landscape, including base composition (Duret and Arndt 2008), codon bias (Comeron et al. 1999), the distribution of repetitive elements (Charlesworth et al. 1994), and patterns of DNA diversity (Maynard Smith and Haigh 1974; Begun and Aquadro 1992; Charlesworth et al. 1993). Determining the causes of polymorphism and divergence in recombination rate will therefore provide insights into the mechanisms of genome evolution. Finally, recombination is itself an important evolutionary force, controlling the rate at which haplotypes are added to the gene pool and shaping the fates of new alleles in populations (Fisher 1930; Muller 1932; Hill and Robertson 1966; Felsenstein 1974). Levels of linkage disequilibrium across genomes and the efficacy of natural selection are expected to vary among taxa as a function of recombination rate.
Interspecific comparisons of recombination rates measured on variable physical window sizes have revealed scale-dependent mechanisms of recombination rate evolution. High-resolution recombination hotspot maps inferred from linkage disequilibrium show no conservation between humans and chimpanzees, indicating very rapid evolution of fine-scale recombination rates (Ptak et al. 2005; Winckler et al. 2005). Biased gene conversion (Boulton et al. 1997; Jeffreys and Neumann 2002, 2009) and protein evolution in molecules that recognize and bind cis sequence motifs near preferred sites for recombination (Baudat et al. 2010; Myers et al. 2010) may largely account for the weak conservation of recombination hotspots over short evolutionary timescales. In contrast, interspecific variation in the genomic rate of recombination displays a strong phylogenetic signature (Dumont and Payseur 2008). The slowed pace of recombination rate evolution at the whole-genome level may largely derive from the meiotic constraint of ≥1 crossover per chromosome per meiosis (Coop and Przeworski 2007), a requirement that tethers global recombination rate evolution to the evolution of chromosome number (Dutrilleux 1986; Pardo-Manuel de Villena and Sapienza 2001; Li and Freudenberg 2009).
The contrasting evolutionary patterns observed at the hotspot and genome-wide levels raise the question of how recombination rates evolve on intermediate scales (megabases). Despite the availability of a large number of genetic linkage maps from many taxa, few studies have systematically compared broadscale recombination rates between species. True et al. (1996) examined patterns of genetic map length divergence between sibling species of Drosophila, concluding that extensive differences in megabase-resolution map lengths can accumulate on the timescale of 1 to 3 million years. The comparison of linkage maps developed for a subset of the Apis mellifera and Apis florea genomes, two taxa that diverged ∼8–10 million years ago (Mya), yielded similar conclusions (Meznar et al. 2010). The genetic map lengths of orthologous intervals are weakly correlated between human, mouse, and rat (Jensen-Seaman et al. 2004) and between chicken and zebra finch (Backström et al. 2010), indicating that the distant shared ancestry of a genomic region is a poor predictor of contemporary recombination rates. In contrast, the comparison of genetic linkage maps among Nasonia species (Beukeboom et al. 2010) suggests that broadscale recombination rates are largely conserved in these very recently diverged taxa (∼1 Mya).
Previous genetic map comparisons have employed different comparative methodologies, each possessing distinct limitations. Some have been strictly qualitative in scope (Dawson et al. 2007; Beukeboom et al. 2010). However, estimates of genetic map lengths are accompanied by very large statistical uncertainties (Broman et al. 2002), meaning that unequal point estimates of genetic map length between taxa could simply reflect variability among independent draws from an identical distribution. Other interspecific genetic map comparisons have focused on the correlation between map length estimates in orthologous genomic regions (Jensen-Seaman et al. 2004; Backström et al. 2010). Unfortunately, this approach fails to identify individual genomic regions with significant differences in map length. The number and genomic distribution of intervals with divergent map lengths are parameters that hold important information about recombination rate evolution. Although some comparative linkage map studies (True et al. 1996; Meznar et al. 2010) have applied statistical tests of map length divergence at individual intervals, the presence of large-scale genomic rearrangements and sequence divergence between species alters the genomic context of compared regions and shrouds the interpretation of observed patterns of recombination rate divergence (Ranz et al. 2007). This consideration is critical: centromeres and telomeres exert very strong cis effects on recombination (Nachman and Churchill 1996; Choo 1998), and epigenetic and sequence parameters that define the local DNA environment are important determinants of recombination rate variation across genomes (Petes 2001; Jensen-Seaman et al. 2004; Sigurdsson et al. 2009). Moreover, the presence of lineage-specific insertions or deletions can lead to differences in the rate of recombination (centimorgans [cM] per megabase, cM/Mb) between species that have not undergone changes in genetic map length.
Here, we report a detailed quantitative analysis of two whole-genome genetic linkage maps constructed from inter-subspecific F2 panels of house mice belonging to the Mus musculus subspecies group. Our mapping populations were developed from two intercrosses sharing a common wild-derived inbred strain of house mouse, a representative of Mus musculus domesticus. Since F2 linkage maps reflect the patterning and intensity of recombination events in F1 hybrids, our map comparisons evaluate differences in map length between two wild-derived inbred strain genomes tested against the identical genetic background contributed by the shared strain. By comparing genetic linkage maps between strains derived from closely related subspecies, our analysis circumvents the genome synteny and collinearity challenge associated with the comparison of more divergent taxa. We document significant differences in chromosomal and sub-chromosomal recombination rates between the two F2 linkage maps, suggesting that extensive broadscale changes in recombination rate segregate within the M. musculus species complex.
Results
Intersubspecific F2 mapping panels and genotype data
We conducted two experimental intercrosses using wild-derived inbred strains representing each of the three principal house mouse subspecies: Mus musculus castaneus (Mmc), Mus m. domesticus (Mmd), and Mus musculus musculus (Mmm). A 605-member F2 panel was created from reciprocal intercrosses between wild-derived inbred house mouse strains CAST/EiJ (Mmc) and WSB/EiJ (Mmd; 437 CAST/WSB × CAST/WSB F2's and 168 WSB/CAST × WSB/CAST F2's). Five hundred and seventy F2 animals were generated from crosses between WSB/EiJ and PWD/PhJ (Mmm; 557 WSB/PWD × WSB/PWD F2's, 13 PWD/WSB × PWD/WSB F2's).
We genotyped all F2 animals at 323 X-linked and autosomal SNPs distributed nearly uniformly across the genome. Loci were selected to simultaneously distinguish Mmd alleles from both Mmm and Mmc alleles. We implemented a number of quality-control steps to ensure high quality of our genotype data set (see Methods). Our data-cleaning pipeline retained a total of 580 individuals and 186 markers from the Mmd and Mmc intercross and 554 animals and 197 loci from the Mmd and Mmm intercross.
Genetic map construction
F2 genetic linkage maps were constructed from the Mmd and Mmc cross (hereafter, the Mmc cross) and the Mmd and Mmm cross (the Mmm cross) (Supplemental Table 1). The order of markers along chromosomes was determined by anchoring loci to the mouse reference genome (build 37); alternative marker orders induced very large expansions in map length and were accompanied by marked decreases in LOD support for linkage. We identified only two possible exceptions to this pattern: Switching the positions of the two most telomeric markers on chromosome 1 in the Mmm cross and the two most centromeric loci on chromosome 19 in the Mmc cross provided marginally higher likelihood values. It is challenging to reconstruct marker order from patterns of linkage at chromosome termini, as the absence of flanking marker genotypes makes it difficult to distinguish true recombination events from genotyping errors. For this reason, we maintain these markers in the order of the physical DNA sequence.
Total autosomal (X chromosome) genetic map length is 1270 (54) cM in the Mmc cross and 1177 (66) cM in the Mmm cross (Supplemental Table 1). These maps cover ∼84.8% and 84.0% of the recombining portions of the physical mouse genome, respectively. Linear interpolation of chromosome map lengths to account for regions distal to the most terminal markers on each chromosome map yields estimated total genome map lengths of 1443 cM (plus 68 cM for the X chromosome) for the Mmc cross and 1345 (70) cM for the Mmm cross. These values are similar to those of the standard mouse genetic linkage map, which spans 1436 sex-averaged cM over the autosomal genome, plus 79 (female) cM on the X chromosome (Cox et al. 2009). Additionally, we find a very strong positive correlation between the map positions of loci on our two linkage maps and their interpolated centimorgan map positions on the reference mouse genetic map (Mmc map: Spearman's ρ = 0.91, P < 10−16; Mmm map: Spearman's ρ = 0.89, P < 10−16) (Cox et al. 2009). The high similarity between our linkage maps and the standard reference provides assurance that few genotyping errors are present in our data set.
The Mmc and Mmm maps share 151 loci, delimiting 131 orthologous intervals ranging in size from 1.2 Mb to 65.6 Mb with a mean (median) of 15.8 Mb (12.0 Mb). All shared intervals are defined by flanking markers with strong statistical evidence of linkage (LOD score >3.5) (Supplemental Table 2).
Statistical comparison of total shared genetic map lengths
To facilitate direct comparison between the Mmc and Mmm genetic linkage maps, we pared down our genotype data sets to include only the 151 loci common to the two crosses. We constructed genetic linkage maps from these thinned data, summing map lengths over all chromosomes to calculate the total shared genetic map length for each cross. The total shared genetic map lengths are quite similar between the two crosses, with the Mmc cross map just 2.2% longer than the map length estimated from the Mmm cross. On average, F1 animals between Mmc and Mmd have approximately 0.5 additional crossovers at meiosis compared with Mmm and Mmd F1's (Table 1).
Table 1.
Comparisons of inter-subspecific genetic linkage maps constructed from identical markers

To statistically evaluate the null hypothesis of equal total map lengths between the two crosses, we sampled with replacement from the Mmc F2 genotype data set and constructed a new genetic linkage map from this bootstrap sample. We repeated this procedure with the Mmm F2 data set and then calculated the difference in total shared map length between the two bootstrapped genetic linkage maps (Mmc map length − Mmm map length). This resampling protocol was repeated 1000 times to generate a distribution of differences in total shared map length. The central 95% mass of this distribution includes 0 (Table 1), indicating that the linkage map from the Mmc cross is not significantly longer than the Mmm map.
We confirmed this result using a simple permutation test. We pooled the Mmc and Mmm genotype data sets and then randomly partitioned this data set into two samples equal in size to the original data sets. We constructed genetic linkage maps from both samples. As before, we evaluated the difference in total shared map length between the two randomized data sets (Mmc map length − Mmm map length). This procedure was repeated 1000 times to generate a distribution of values under the null hypothesis of equal total genetic map length in the Mmc and Mmm crosses. The observed difference in genetic map length lies in the 0.059 quantile of this distribution (Table 1).
Variation in chromosomal map lengths
Although the total shared map lengths of the Mmc and Mmm crosses are not statistically distinguishable, we explored the possibility that total shared map lengths of individual chromosomes might differ significantly between the two crosses. Although individual chromosome maps provide poor coverage over some chromosomes (most notably chromosomes 7, 12, 16, and 18), the most terminal markers span at least 50% of the physical sequence for all but two chromosomes (Chr 16: 34% physical coverage; Chr 18: 48% physical coverage).
The total map length of chromosome 4 is significantly longer on the Mmc map than the Mmm map, as assessed by both bootstrap and permutation approaches (Table 1). The map lengths of chromosomes 1 and 10 are significantly different by the permutation method but not the bootstrap approach (Table 1), suggesting that the latter method is more conservative (Supplemental Fig. 2). Chromosomes 5, 7, and 11 display clear trends toward significance, with chromosomes 5 and 7 possessing longer map lengths in the Mmc cross and chromosome 11 in the Mmm cross (Table 1).
Sub-chromosomal genetic map length differences
To identify megabase-sized regions with map length differences between the Mmc and Mmm crosses, we compared the map lengths of the 131 orthologous intervals defined by identical polymorphic markers on the Mmc and Mmm maps. Thirty-two intervals have divergent map lengths as assessed by the bootstrap test, and 44 intervals display differences in genetic map length by the permutation test (Supplemental Table 2). We identify 33 intervals with divergent recombination fractions by a simple likelihood ratio test that compares the empirical fit of a model with equal recombination fractions in the Mmm and Mmc crosses to a model in which recombination fractions are allowed to differ between the crosses (Supplemental Table 2; see Methods). To be conservative, we focus on the subset of 31 intervals that is divergent by all three statistical methods (uncorrected P < 0.05 for each test) (Supplemental Table 2), recognizing that five to six of these intervals may be false positives. These 31 divergent regions differ by an average of 4.2 cM (range = 1.8–9.8 cM) between the Mmc and Mmm maps. Nineteen of these intervals display increased map length in the Mmc cross, with the remaining 12 intervals characterized by longer genetic map lengths in the Mmm cross (Fig. 1). Together, these 31 divergent regions span ∼19% of the mouse genome, disproportionately localizing to the X chromosome (permutation test, uncorrected P < 0.05). There is no statistical evidence for clustering of divergent intervals across the 10 chromosomes with multiple divergent intervals (permutation test, P > 0.05 for all chromosomes). However, few intervals with significant differences in map length appear to lie in terminal chromosomal regions (Fig. 1).
Figure 1.

Intervals with significant genetic map length differences between the Mmm cross and the Mmc cross are plotted on the physical mouse genome. (Black horizontal lines) The positions of loci typed in both crosses; (light gray boxes) regions with significantly longer map length in the Mmc cross relative to the cross with Mmm; (dark gray boxes) genomic intervals with significantly longer map lengths in the Mmm cross. The asterisk on chromosome 11 denotes a very small interval with a significantly longer map length in the Mmm cross.
Our results suggest that map length divergence between Mmc and Mmm is not uniformly distributed across the genome, but instead is restricted to a limited number of genomic regions. To test the null hypothesis of uniform divergence in map length between the Mmm and Mmc maps, we first derived a genetic linkage map by inflating the observed map lengths on the Mmm map (i.e., the shorter map) by the proportional genome-wide difference in map length between the two crosses. This resulted in a map equal in total length to the observed Mmc map. We then compared the likelihood of this uniformly inflated map to that of the observed Mmc genetic linkage map using a likelihood ratio test (see Methods). We strongly reject this simple null model (D = 981.49, P < 10−214), indicating that observed differences in map length between Mmc and Mmm are locus-specific.
Divergence in the distribution of recombination events between Mmc and Mmm
Our genetic linkage maps reveal clear, statistically significant differences in map length for a single chromosome (chromosome 4), and provide suggestive evidence for significant map length variation at two others (chromosomes 1 and 10) (Table 1). However, significant changes in the megabase-scale recombination landscape can arise in the absence of divergence in overall chromosomal map length. Despite harboring multiple intervals with recombination rate differences between the two crosses, the total shared map lengths of chromosomes 2, 3, 6, 8, 9, 12, 17, and X are not significantly divergent (Fig. 1; Table 1). This pattern arises from the stretching and shrinking of the genetic map in different regions along the chromosome in the two crosses, with the outcome that overall map length remains quite constant (Fig. 2).
Figure 2.

Chromosome X displays no difference in total map length between the Mmd and Mmc cross and the Mmd and Mmm cross despite harboring multiple intervals with divergent map lengths. The chromosome X linkage maps constructed from both crosses are shown, with markers anchored to their common physical positions on the mouse reference genome (build 37), which was derived from an inbred strain predominately of Mmd origin (Yang et al. 2007). Asterisks denote intervals with significantly longer map lengths in one cross.
To evaluate distributional differences in recombination between our two maps, we performed a likelihood ratio test per Jorgenson et al. (2005). First, we pooled the Mmc and Mmm data sets to construct a combined genetic linkage map. Second, we found the vector of pairwise recombination fractions for each chromosome that maximized the likelihood of the combined data set. These likelihoods represent the likelihood of the observed genotype data under a model in which recombination fractions are assumed to be identical for the Mmc and Mmm crosses. Next, we identified the vector of recombination fractions that maximized the likelihood of the Mmc data and found the analogous vector for the Mmm data. The sum of the maximum likelihood values for the separate Mmc and Mmm maps represents the probability of the observed genotype data under a model in which the vector of recombination fractions for each chromosome is allowed to differ between the two crosses. Finally, we compared the likelihood from the combined map to the sum of the likelihoods from the individual maps. The resulting test statistics were significant (as assessed by 1000 permutations of the data) for chromosomes 1, 3–6, 8–12, 17, and X (Table 1). Notably, distributional differences in recombination have arisen on chromosomes 3, 5, 6, 8, 9, 11, 12, 17, and X in the absence of changes in overall chromosome map length as assessed by nonparametric bootstrap and permutation methods (Table 1). Conversely, total map lengths for chromosome 7 are nearly statistically distinct between the Mmc and Mmm maps using nonparametric methods, but far from significant by the likelihood ratio test (Table 1). The expansion in map length over this chromosome appears to be roughly uniformly distributed, with the effect that differences in recombination fractions at individual intervals are too small to breach the threshold of statistical significance.
Correlates of broadscale recombination rate divergence
Genomic sequence features, including GC content, repetitive elements, and gene density, correlate with variation in recombination rate across single genomes (Kong et al. 2002; Jensen-Seaman et al. 2004; Myers et al. 2005; Shifman et al. 2006). The well-curated genome sequence of the house mouse, combined with our two inter-subspecific genetic linkage maps, provides a unique opportunity to identify genomic sequence parameters that correlate with observed map length differences between the Mmc and Mmm crosses.
We performed a simple randomization test to ask whether specific sequence attributes of the genome are over- or under-represented in the 31 intervals with divergent map lengths (Supplemental Table 3). There is an enrichment of LINE elements—in particular, the CR1 and L1 families of LINE elements—in divergent intervals compared with nondivergent intervals (PLINES = 0.034; PCR1 = 0.047; PL1 = 0.06). We find a significant deficit of satellite DNA and low-complexity G-rich repeats in regions with significant map length differences (PSatellite = 0.005; PG-rich = 0.025). However, none of these P-values survive Bonferroni correction (for α = 0.05, P < 0.001), and genome-wide variation in these sequence variables provides little power to predict the level of map length divergence in a particular interval (multiple linear regression, adjusted R2 = 0.052). Although the inclusion of additional sequence parameters not examined here (especially epigenetic modifications to chromatin and histone proteins) (Petes 2001; Sigurdsson et al. 2009) may improve the predictive power of our linear model, there appears to be weak covariation of local genomic sequence context and megabase-scale map length differences between the Mmc and Mmm maps.
We also tested whether genomic regions with significant map length divergence between the two crosses were enriched for copy number variants (CNVs) segregating between house mouse subspecies (identified by She et al. [2008]). CNVs are not over-represented among divergent intervals (P > 0.1) (Supplemental Table 3).
Comparing linkage maps from reciprocal intercrosses with subspecies Mmd and Mmc
We repeated the above analyses to test for differences in sub-chromosomal, chromosomal, and genome-wide recombination rates between genetic linkage maps constructed from reciprocal intercrosses of Mmd and Mmc. Because Mmd × Mmc F1 and Mmc × Mmd F1 animals carry an identical autosomal genome complement, differences between reciprocal F2 genetic linkage maps suggest a role for sex-linked or mitochondrial recombination rate modifiers (Fig. 3).
Figure 3.

Reciprocal intercross design. F1 males from the Mmc × Mmd cross inherit their X chromosome from their Mmc mother and their Y chromosome from the Mmd father. Conversely, F1 males from the Mmd × Mmc cross receive the Mmd X chromosome and the Mmc Y. Female F1's from both cross directions are genetically identical at all loci with the exception of the mitochondria. Significant differences between linkage maps derived from reciprocal F2 panels most likely derive from the distinct F1 male genotypes.
The total genetic map length in the Mmc × Mmd cross is ∼100 cM (95% CI: 42.43–163.96) longer than the map length of the reciprocal cross, a highly significant result (Table 2). Map lengths of chromosomes 1, 3, 8, and 14 are significantly longer in the Mmc × Mmd cross (Table 2). Thirteen of the 166 intervals evaluated show differences in map length between the two crosses, with 12 of these genomic regions displaying significantly longer map lengths in the Mmc × Mmd cross (Fig. 4; Supplemental Table 4).
Table 2.
Comparisons of chromosomal map lengths from reciprocal intercrosses with Mmc and Mmd

Figure 4.

Intervals with significant genetic map length differences between reciprocal crosses of Mmd and Mmc are plotted on the physical mouse genome. (Black horizontal lines) The positions of genotyped loci; (light gray boxes) regions with significantly longer map length in the Mmc × Mmd cross; (dark gray boxes) genomic intervals with significantly longer map lengths in the Mmd × Mmc cross.
These results provide strong evidence for a sex-linked or mitochondrial modifier of recombination segregating between Mmc and Mmd. Since all divergent genomic intervals are autosomal (Table 2), this modifier must affect recombination in trans. Although the divergent genomic intervals we detect encompass only a small subset (∼7.4%) of the genome, we are underpowered to find intervals with modest changes in map length (Supplemental Fig. 1). This fact, coupled with the observation that 12 out of the 13 significant intervals have longer map lengths in one direction of the cross, prompted us to ask whether the observed difference between reciprocal cross directions could be explained by a trans-acting locus that uniformly increases the global rate of recombination in Mmc × Mmd F1's. We performed a likelihood ratio test to evaluate this possibility. In particular, we compared the likelihood of a linkage map derived by uniformly inflating Mmd × Mmc map lengths to yield a map equal in overall length to the observed Mmc × Mmd map to the likelihood of the observed Mmc × Mmd linkage map. The resulting likelihood ratio test statistic is highly statistically significant (D = 660.763; P ≈ 10−145), providing evidence for a site-specific enhancer of recombination on the Mmc X, Mmd Y, or Mmc mitochondrion (or, alternatively, a site-specific repressor of recombination on the Mmd X, Mmc Y, or Mmd mitochondrion).
An analogous analysis in the cross with Mmm was not possible because too few Mmm × Mmd F2 animals were generated (n = 13).
Discussion
Interpreting map length differences in inter-subspecific crosses
Our quantitative comparison of two genetic linkage maps identifies significant differences in chromosomal and sub-chromosomal map lengths between wild-derived strains of closely related house mouse subspecies, despite the conservation of overall map lengths. Several unique features of our study bear on the interpretation of differences in genetic map length between the Mmc and Mmm crosses. First, because the two crosses share a common inbred strain (WSB/EiJ; Mmd), F1 animals are identical at one set of chromosomes, varying only in whether their second set of chromosomes was inherited from inbred strain CAST/EiJ (Mmc) or PWD/PhJ (Mmm). Second, all mice were reared in a common laboratory setting, minimizing environmental contributions to observed differences in genetic map length. Third, the expected conservation of genome structure and sequence among house mouse subspecies suggests that differences in map length have arisen in the absence of radical changes in the genomic context of orthologous regions (see below). Assuming that physical distances between markers are approximately equal on the two maps, map length differences between the two crosses are proportional to differences in recombination rate. Together, these considerations suggest that most of the variation in map length between the two crosses derives from genetic differences between the Mmc and Mmm strains at loci that affect recombination rate.
The significant map length differences we identify point to variation in recombination rate segregating within the M. musculus species complex. This variation could reflect subspecies-level divergence, shared ancestral polymorphism among subspecies, or both. Using one inbred strain to represent each subspecies does not allow us to distinguish these contributions. Future map comparisons involving additional wild-derived inbred strains from these subspecies will be useful for evaluating how much of the variation in map length we document is present between versus within subspecies.
Detection of map length differences
By focusing on genomic intervals that pass three statistical criteria for significance—including both model-based and nonparametric approaches—our analysis conservatively identified intervals with divergent map lengths (Supplemental Fig. 1). However, the use of a conservative threshold for declaring significance raises the likely possibility that a larger percentage of the mouse genome is characterized by variable recombination rates than the 19% reported here. Indeed, the subset of genomic intervals that show significant differences in map length by one or more tests highlights a greater percentage (26.0%) of the mouse genome. Furthermore, the high statistical uncertainty associated with map length estimates leaves little power to find regions with small changes in map length (Supplemental Figs. 1, 2).
In addition, we are limited to evaluating recombination rate divergence on a physical window defined by the positioning of shared markers on our two genetic linkage maps. We found multiple contiguous intervals that show significant map length divergence between the two crosses (Fig. 1), suggesting that a broader physical scale may be more appropriate in some sectors of the genome. On the other hand, finer-scale variation in recombination rate between Mmc and Mmm will go undetected on these maps if neighboring regions exhibit compensatory changes, as has been documented in yeast (Wu and Lichten 1995; Fan et al. 1997). The scale sensitivity of recombination rate poses a complication to data analysis that may only be fully addressed by examining a much larger number of meioses with many more markers than considered here.
The effect of structural genome evolution on the identification of genetic map length differences
Structural genomic features are important determinants of recombination rate. Chromosome number and recombination rate are strongly positively correlated across mammalian taxa (Dutrilleux 1986; Burt and Bell 1987; Pardo-Manuel de Villena and Sapienza 2001), and inversion heterozygosity can suppress recombination throughout inverted regions (Dobzhansky and Epling 1948). In addition, recombination rates vary predictably across a range of genomic contexts, including base composition, position relative to telomeres and centromeres, gene density, and repetitive elements (Kong et al. 2002; Jensen-Seaman et al. 2004; Myers et al. 2005; Shifman et al. 2006; Coop et al. 2008). Importantly, the three subspecies of house mice considered in this analysis have low levels of DNA sequence divergence (<1%) (Geraldes et al. 2008), identical karyotypes, and lack any large-scale structural genomic differences (Silver 1995). Additionally, we find strong statistical support for identical marker order on the Mmc and Mmm genetic linkage maps. Although small inversions (Lyon et al. 1988), CNVs (Cheung et al. 2003; She et al. 2008), and insertions/deletions (Akagi et al. 2010) segregate among house mice, such small-scale structural changes are not expected to exert systematic effects on the number or distribution of recombination events in a genome. Intervals showing map length differences between our two crosses do not show higher levels of CNV compared with genomic regions with no map length differences (Supplemental Table 3). Furthermore, we do not recover any intervals on our maps that have zero or near-zero map lengths in one cross but not the other (Supplemental Table 2), suggesting that any genomic rearrangements that may be segregating between the inbred strains used here do not have overt effects on recombination.
Taken together, we conclude that differences in map length between our two crosses have arisen in the absence of dramatic shifts in the genomic context, large changes in the physical size, or pronounced differences in the structural organization of orthologous intervals. Map length differences between our two crosses at least partially reflect evolutionary variation in recombination rate. However, the genomic regions compared in this analysis likely differ in DNA content and physical size among the wild-derived inbred strains, indicating that an undetermined fraction of the map length variation we document may be due to structural and contextual—not strictly recombinational—differences between strains.
The effect of hybrid incompatibilities on genetic map length estimation
Two of the subspecies used in this analysis exhibit partial reproductive isolation. Crosses between the WSB (Mmd) and PWD (Mmm) strains used here sometimes yield sterile hybrid F1 or F2 males (MA White and BA Payseur, unpubl.), replicating a pattern observed for other strains of Mmd and Mmm (Good et al. 2008). Although F2 genetic linkage maps are not affected by F2 hybrid sterility, the existence of F2 hybrid inviability in either cross could lead to underestimation of recombination rate in particular genomic intervals if selection removed recombinant (hybrid) genotypic combinations. Consistent with previous inter-subspecific mapping studies in other species (Hall and Willis 2005; McDaniel et al. 2007), we found multiple SNPs showing deviations from the expected 1:2:1 genotype ratio in the F2's (see Methods). This segregation distortion could reflect F2 hybrid inviability or differential gametic transmission in the F1's. Importantly, segregation distortion does not impact the estimation of map length in F2 crosses, as long as distorted alleles are (i) unlinked or (ii) linked tightly enough that they are effectively transmitted as a single locus. In these cases, distorted loci will simply affect how crossover events that occur in F1 parents are manifest in the genotypes of F2 progeny (e.g., if distortion is toward allele B, more recombination events will be inferred from the two-locus F2 genotype A/B–B/B than genotype A/B–A/A).
For hybrid inviability to explain the patterns of variation in recombination rate between the Mmm and Mmc crosses, loosely linked incompatibilities that reduce viability must be widespread among F2 conceptuses. This scenario seems unlikely. No clear evidence for hybrid inviability between these subspecies has been reported. In our study, F2 litter sizes were larger than F1 litter sizes in both crosses (Mmd and Mmm cross: F2 mean = 7.3 [SD = 2.1], F1 mean = 5.7 [SD = 2.4]; Mmd and Mmc cross: F2 mean = 5.9 [SD = 2.6], F1 mean = 4.3 [SD = 1.9]), as well as litter sizes from the parental strains (Mmd: mean = 4.03 [SD = 1.4]; Mmc: mean = 4.5 [SD = 0.71]; Mmm: mean = 5.0 [SD = 2.3]). Moreover, post-partum mortality rates were low (<5%) among both F1 and F2 animals, suggesting that any reduction in viability was weak. Even if incompatibilities causing hybrid inviability exist between these subspecies, there is no reason to predict that they will usually be spaced at large distances on the same chromosome. Consistent with this assertion, a recent comparison of two interspecific genetic linkage maps constructed from incipient species Nasonia vitripennis, Nasonia giraulti, and Nasonia longicornus with an intraspecific genetic linkage map of N. vitripennis revealed minimal differences in map lengths, despite the segregation of known hybrid incompatibilities in the interspecific crosses (Beukeboom et al. 2010).
Causes of intermediate scale recombination rate divergence
The biological factors controlling the distribution of recombination rates on the intermediate scale are poorly understood. Within genomes, the positioning of recombination events is regulated by strong positive crossover interference (Broman and Weber 2000; Broman et al. 2002), as well as regional properties of the DNA sequence (Jensen-Seaman et al. 2004; Myers et al. 2005; Coop et al. 2008). Changes in the strength of crossover interference (Petkov et al. 2007) or differences in genome sequence and architecture between individuals could precipitate broadscale recombination rate differences. The conflation of male and female meioses in sex-averaged F2 linkage maps precludes an analysis of differences in interference between the Mmc and Mmm mapping panels, while the broad conservation of genome structure and sequence in house mice argues against the latter possibility. Our analysis of the association between genomic sequence parameters and recombination rate divergence identifies an excess of divergent recombination rate intervals in genomic regions enriched for LINE elements and depauperate for satellite DNA and low-complexity G-rich elements. However, the mechanisms by which these sequence features render genomic regions more liable to evolutionary changes in recombination rate remain unknown.
Since the majority of recombination events cluster into discrete hotspots (Paigen et al. 2008; Webb et al. 2008), patterns of broadscale recombination rate divergence may largely reflect the cumulative evolutionary dynamics of all hotspots in a given region. When viewed in combination with the short divergence time between house mouse subspecies (∼450,000 generations) (Salcedo et al. 2007), our results seem to imply rampant turnover of recombination hotspots within the M. musculus species complex. Several previous studies have documented clear differences in hotspot activity conferred by Mmc alleles and alleles from common laboratory strains of predominately Mmd origin (Shiroishi et al. 1991; Grey et al. 2009; Parvanov et al. 2009). The recent identification of Prdm9, a DNA-binding protein controlling the initiation of recombination at multiple recombination hotspots in the mouse genome, nominates a mechanism for the rapid evolution of recombination hotspots en masse. Changes in the DNA motif binding specificity of Prdm9 can trigger abrupt shifts in the fine-scale recombinational landscape (Baudat et al. 2010; Myers et al. 2010). The wild-derived inbred mouse strains used in this analysis have different functional variants of Prdm9 (Parvanov et al. 2010), although it is unclear whether this locus underlies any of the broadscale variation in recombination rate we document.
Genetic modifiers of recombination rate
Comparison of two intersubspecific crosses involving Mmd indicates that Mmc and Mmm differ at one or more modifiers of recombination rate. Because our study infers recombination rate divergence from differences among F1 heterozygous animals, the genetic modifiers we identify must have additive or dominant effects; recessive modifiers segregating between Mmc and Mmm cannot be identified in the heterozygous genetic background evaluated here. Alternatively, recombination rate differences could be attributable to loci with different dominance rankings in Mmc or Mmm relative to Mmd or to epistatic interactions between subspecies-specific alleles. The identification of genomic regions with divergent map lengths in the reciprocal crosses between Mmc and Mmd implicates the presence of at least one sex-linked or mitochondrial modifier. Further experimental crosses will be required to map these loci, calculate their effect sizes, determine their modes of inheritance, and characterize the molecular mechanisms through which they elicit changes in recombination.
Two distinct classes of recombination rate modifiers have been identified in previous studies: loci that affect recombination rate in a site-specific manner (Chinnici 1971; Brooks and Marks 1986; Shiroishi et al. 1991; Grey et al. 2009; Parvanov et al. 2009, 2010), and modifiers that uniformly increase the rate of recombination across genomes (Kong et al. 2008; Chowdhury et al. 2009). Our comparison of reciprocal intercrosses between Mmc and Mmd uncovers evidence for a sex-linked modifier that appears to affect recombination at only a subset of loci across the genome. Similarly, we find evidence for at least one modifier of local recombination rates segregating between Mmc and Mmm. Unfortunately, our data are unable to resolve the mechanisms by which this site-specific control of recombination is achieved.
The recombination rate modifiers identified in the Mmm and Mmc map comparisons promote clear shifts in the distribution of recombination events across the Mmm and Mmc genomes without enacting changes in genome-wide map length or, with a few exceptions, whole chromosome map lengths (Fig. 1; Table 1). This observation suggests that chromosome and genome-wide recombination levels are subject to stronger evolutionary constraints than recombination rates in localized intervals, a possibility that has been raised previously (Myers et al. 2005). This scenario implies that recombination rate increases in one sector of the genome are compensated by decreases in recombination rate elsewhere, creating a tug-of-war interplay between modifying loci that results in a nearly constant, genome-wide level of recombination. Such phenomena will impose limitations on the evolvability of recombination rates and may help account for observed scale-dependent patterns of recombination rate evolution.
Conclusions
Our comparison of two intersubspecific genetic linkage maps sharing a common subspecies reveals significant chromosomal and subchromosomal variation for recombination rate among wild-derived inbred strains of house mice. Despite the fact that estimated DNA sequence divergence among house mice in the M. muculus species complex is <1% (Geraldes et al. 2008), we find significant differences in recombination rate for 31 of 131 tested intervals that collectively span 19% of the mouse genome. These results indicate that the genetic map of house mice is evolving at a considerably faster pace than the physical map, a finding that underscores the continued importance of genetic linkage maps in the post-genome era.
Methods
Animal husbandry
Wild-derived inbred strains of Mus musculus castaneus (CAST/EiJ), Mus musculus domesticus (WSB/EiJ), and Mus musculus musculus (PWD/PhJ) were purchased from the Jackson Laboratory (Bar Harbor, ME) and housed in the University of Wisconsin School of Medicine and Public Health mouse facility according to animal care protocols approved by the University of Wisconsin Animal Care and Use Committee. Mice were provided with food and water ad libitum and sacrificed at 10 wk (±7 d) of age.
Genotyping
DNA from each F2 animal was extracted from liver tissue using a Wizard Genomic DNA Purification Kit (Promega) following the manufacturer's protocols.
SNPs simultaneously distinguishing WSB/EiJ alleles from both CAST/EiJ and PWD/PhJ alleles were identified from Phase 2 of the Perlegen mouse resequencing project (Frazer et al. 2007). SNPs were selected to provide even genomic coverage and on their ability to multiplex at a high level using the Sequenom assay designer 3.1 software package (Sequenom). Two hundred and ninety-eight assays were chosen out of a larger list of 726, and plexed into eight wells, with an average of 37 assays per well. The average interval between SNPs was ∼10–15 Mb. After an initial round of genotyping, an additional 48 supplemental assays (two wells) were designed to fill gaps where previous assays failed to give informative calls (7.7% of total assays), resulting in 323 assays. Genotyping was performed using the Sequenom iPLEX MassARRAY system as previously described (Gabriel et al. 2009). Briefly, a 100-bp sequence flanking the targeted SNP was amplified using standard multiplexed PCR methods, and remaining primers were deactivated by SAP treatment. A single-base extension reaction was then performed with an 18-mer to 31-mer primer designed directly adjacent to the SNP in question. The resulting primer-extension complex was desalted and spotted onto a chip, and MALDI-TOF mass spectrometry was used to determine the SNP allele based on mass of the product.
Data cleaning
Several steps were taken to ensure that the genotypes used for map construction were of high quality. Loci with genotyping assays that failed to correctly call SNPs in the parental strains and F1 control samples were excluded, and non-Mendelian X chromosome genotypes were recoded as missing data. Individual SNPs and animals with >20% missing data were removed from the analysis. Autosomal SNPs deviating from the expected 1:2:1 segregation ratio (Chi square test, α = 0.05 cutoff) were deleted unless (1) a large contiguous block of loci displayed distortion toward the same allele; and (2) the strength of segregation distortion decayed roughly symmetrically from a single central locus. These two criteria are hallmarks of genuine segregation distortion, which might be common in crosses between different subspecies (Hall and Willis 2005; McDaniel et al. 2007).
The house mouse exhibits very strong positive crossover interference (Broman et al. 2002), suggesting that multilocus F2 genotypes requiring multiple closely spaced crossovers are most likely attributable to genotype miscalls. We used several measures to filter out these probable errors. First, autosomal (X chromosome) genotype configurations requiring >3 (2) crossovers in the span of 15 cM were recoded as missing data. Note that for an F2 intercross, maternal and paternal recombination events occurring on the autosomes cannot be distinguished, so crossovers observed in autosomal F2 genotypes reflect the sum of recombinational activity in both parents. Second, whole-chromosome multilocus genotypes requiring an unrealistic number of recombination events were recoded as missing data (>7 crossovers for chromosomes 1–7; >5 crossovers for chromosomes 8–19; >4 crossovers for chromosome X). Third, three individuals with extreme whole-genome crossover counts (<7 or >55 crossovers) were removed from the data set.
Genetic linkage map construction
Genetic linkage maps were constructed using the est.map function in the qtl add-on package for R (Broman and Sen 2009). This function treats observed genotype data as a realization of a Hidden Markov process in order to derive maximum likelihood estimates of recombination fractions between pairs of adjacent markers on a linkage group. Recombination fractions were converted to map distances using the Carter-Falconer mapping function, which provides an empirical fit to recombination patterns in the laboratory mouse (Carter and Falconer 1951; Broman et al. 2002). Although a few base miscalls might have survived our rigorous data cleaning procedure, we assumed a genotype error rate of 0 during map construction. Including a very small number of errors will have a negligible effect on overall map length estimation.
For map comparisons, we constructed genetic linkage maps using only markers successfully genotyped in both crosses. Maps were assembled for the Mmc cross, the Mmm cross, and a pooled panel of F2 animals. In addition, we built two maps corresponding to the reciprocal directions of the cross involving Mmd and Mmc. Maps using all markers successfully genotyped in the Mmc and Mmm crosses were also constructed, but these were not used for comparative purposes as differences in marker number and density could induce biases in the statistical detection of divergent intervals.
Statistical analyses
We employed a three-tiered strategy for identifying orthologous intervals with significantly divergent map lengths between the two crosses. First, we conducted a likelihood ratio test comparing the LOD score of an interval from the combined map to the sum of the interval LOD scores from the two crosses:
This test was originally described by Jorgenson et al. (2005). Observed values of D were assigned empirical P-values derived from 1000 permutations of the data.
Second, we generated a bootstrap sample from the Mmd × Mmm genotype data set and a bootstrap sample from the Mmd × Mmc data set. We constructed a linkage map from each bootstrap data set and then calculated the difference in map length between the two maps for each shared interval. This procedure was repeated 1000 times to generate a distribution of map length differences. We identified intervals with 95% bootstrap confidence intervals that do not overlap zero as significant by this test.
Third, we combined the genotype data from the two crosses and randomly selected 580 individuals from the combined data set—the number of individuals retained in the Mmd and Mmc cross. We constructed a genetic linkage map from this random subset of animals, as well as a map from the remaining 554 individuals. For each shared interval on the two maps, we calculated the difference between the “Mmc” map length and the “Mmm” map length. This permutation procedure was repeated 1000 times to derive a distribution of map length differences under the assumption that map lengths in the two crosses are equivalent. Intervals with observed map length differences lying in the extreme tails (one-sided, α = 0.05) of this empirical distribution were considered significantly diverged.
We focused on intervals that showed significant map length divergence in all three tests. Simple simulations show that this three-pronged approach is more conservative than any test in isolation (false-positive rate ∼4%), with 80% power to detect a difference in map length of ∼45% when the maps compared have equal sample sizes (Supplemental Fig. 1). When sample sizes are imbalanced, there is an expected decrease in power (80% power to detect a difference in map length ∼67% when one map has twice as many individuals as the other).
Likelihood ratio tests were conducted to evaluate evolutionary hypotheses in a statistical framework. To determine whether the map length in Cross 2 is longer than the map in Cross 1 because of a uniform, genome-wide increase in recombination, we compared the likelihood of a linkage map derived by inflating recombination fractions on the shorter map (Cross 1) by the overall percent difference in map length between the two crosses to the likelihood of the observed map:
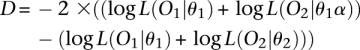 |
which easily simplifies. Here, O1 (O2) is the observed genotype data for Cross 1 (Cross 2), θ1 (θ2) is the maximum likelihood estimate of the vector of pairwise recombination fractions for Cross 1 (Cross 2), and α is an inflation factor obtained by dividing the total map length in Cross 2 by the total map length in Cross 1. D follows an asymptotic χ2 distribution on 1 degree of freedom.
Statistical analyses were conducted using in-house Perl scripts, R (http://www.R-project.org), and the Condor distributive computing environment (http://www.cs.wisc.edu/condor/).
Correlates of recombination rate divergence
Sequence parameters tested for relationships with recombination rate divergence were retrieved from NCBI build 37 of the reference mouse genome using the RepeatMasker, RefSeq Genes, and GC Percent tracks of the UCSC Table Browser (Karolchik et al. 2004).
Acknowledgments
We thank Karl Broman for useful discussions and advice throughout the course of this study. B.L.D. was supported by a NSF Predoctoral Fellowship, and M.A.W. is supported by a NLM training grant in Computation and Informatics in Biology and Medicine to the University of Wisconsin (NLM 2T15LM007359). We thank the Condor team for providing access to their distributed computing resources. This research was supported by NSF grant DEB 0918000 to B.A.P.
Footnotes
[Supplemental material is available online at http://www.genome.org.]
Article published online before print. Article and publication date are at http://www.genome.org/cgi/doi/10.1101/gr.111252.110.
References
- Akagi K, Stephens RM, Li J, Evdokimov E, Kuehn MR, Volfovsky N, Symer DE 2010. MouseIndelDB: A database integrating genomic indel polymorphisms that distinguish mouse strains. Nucleic Acids Res 38: D600–D606 [DOI] [PMC free article] [PubMed] [Google Scholar]
- Backström N, Forstmeier W, Schielzeth H, Mellenius H, Nam K, Bolund E, Webster MT, Öst T, Schneider M, Kempenaers B, et al. 2010. The recombination landscape of the zebra finch Taeniopygia guttata genome. Genome Res 20: 485–495 [DOI] [PMC free article] [PubMed] [Google Scholar]
- Baudat F, Buard J, Grey C, Fledel-Alon A, Ober C, Prezeworski M, Coop G, de Massy B 2010. PRDM9 is a major determinant of meiotic recombination hotspots in humans and mice. Science 327: 836–840 [DOI] [PMC free article] [PubMed] [Google Scholar]
- Begun DJ, Aquadro CF 1992. Levels of naturally occurring DNA polymorphism correlate with recombination rates in D. melanogaster. Nature 356: 519–520 [DOI] [PubMed] [Google Scholar]
- Beukeboom LW, Niehuis O, Pannebakker BA, Koevoets T, Gibson JD, Shuker DM, van de Zande L, Gadau J 2010. A comparison of recombination frequencies in intraspecific versus interspecific mapping populations of Nasonia. Heredity 104: 302–309 [DOI] [PubMed] [Google Scholar]
- Boulton A, Myers RS, Redfield RJ 1997. The hotspot conversion paradox and the evolution of meiotic recombination. Proc Natl Acad Sci 94: 8058–8063 [DOI] [PMC free article] [PubMed] [Google Scholar]
- Broman KW, Sen S 2009. A guide to QTL mapping with R/qtl. Springer, New York [Google Scholar]
- Broman KW, Weber JL 2000. Characterization of human crossover interference. Am J Hum Genet 66: 1911–1926 [DOI] [PMC free article] [PubMed] [Google Scholar]
- Broman KW, Murray JC, Sheffield VC, White RL, Weber JL 1998. Comprehensive human genetic maps: Individual and sex-specific variation in recombination. Am J Hum Genet 63: 861–869 [DOI] [PMC free article] [PubMed] [Google Scholar]
- Broman KW, Rowe LB, Churchill GA, Paigen K 2002. Crossover interference in the mouse. Genetics 160: 1123–1131 [DOI] [PMC free article] [PubMed] [Google Scholar]
- Brooks LD, Marks RW 1986. The organization of genetic variation for recombination in Drosophila melanogaster. Genetics 114: 525–547 [DOI] [PMC free article] [PubMed] [Google Scholar]
- Burt A, Bell G 1987. Mammalian chiasma frequencies as a test of two theories of recombination. Science 326: 803–805 [DOI] [PubMed] [Google Scholar]
- Carter TC, Falconer DS 1951. Stocks for detecting linkage in the mouse, and the theory of their design. J Genet 50: 307–323 [DOI] [PubMed] [Google Scholar]
- Charlesworth B, Morgan MT, Charlesworth D 1993. The effect of deleterious mutations on neutral molecular variation. Genetics 134: 1289–1303 [DOI] [PMC free article] [PubMed] [Google Scholar]
- Charlesworth B, Sniegowski P, Stephan W 1994. The evolutionary dynamics of repetitive DNA in eukaryotes. Nature 371: 215–220 [DOI] [PubMed] [Google Scholar]
- Cheng EY, Hunt PA, Naluai-Cecchini TA, Flinger CL, Fujimoto VY, Pasternack TL, Schwartz JM, Steinauer JE, Woodruff TJ, Cherry SM, et al. 2009. Meiotic recombination in human oocytes. PLoS Genet 5: e1000661 doi: 10.1371/journal.pgen.1000661 [DOI] [PMC free article] [PubMed] [Google Scholar]
- Cheung J, Wilson MD, Zhang J, Khaja R, MacDonald JR, Heng HHQ, Koop BF, Scherer SW 2003. Recent segmental and gene duplications in the mouse genome. Genome Biol 4: R47 doi: 10.1186/gb-2003-4-8-r47 [DOI] [PMC free article] [PubMed] [Google Scholar]
- Chinnici JP 1971. Modification of recombination frequency in Drosophila. II. The polygenic control of crossing over. Genetics 69: 85–96 [DOI] [PMC free article] [PubMed] [Google Scholar]
- Choo KHA 1998. Why is the centromere so cold? Genome Res 8: 81–82 [DOI] [PubMed] [Google Scholar]
- Chowdhury R, Bois PRJ, Feingold E, Sherman SL, Cheung VG 2009. Genetic analysis of variation in human meiotic recombination. PLoS Genet 5: e1000648 doi: 10.1371/journal.pgen.1000648 [DOI] [PMC free article] [PubMed] [Google Scholar]
- Comeron JM, Kreitman M, Aguadé M 1999. Natural selection on synonymous sites is correlated with gene length and recombination in Drosophila. Genetics 151: 239–249 [DOI] [PMC free article] [PubMed] [Google Scholar]
- Coop G, Przeworski M 2007. An evolutionary view of human recombination. Nat Rev Genet 8: 23–34 [DOI] [PubMed] [Google Scholar]
- Coop G, Wen X, Ober C, Pritchard JK, Przeworski M 2008. High-resolution mapping of crossovers reveals extensive variation in fine-scale recombination patterns among humans. Science 319: 1395–1398 [DOI] [PubMed] [Google Scholar]
- Cox A, Ackert-Bicknell CL, Dumont BL, Ding Y, Bell JT, Brockmann GA, Wergedal JE, Bult C, Paigen B, Flint J, et al. 2009. A new standard genetic map for the laboratory mouse. Genetics 182: 1335–1344 [DOI] [PMC free article] [PubMed] [Google Scholar]
- Dawson DA, Åkesson M, Burke T, Pemberton JM, Slate J, Hansson B 2007. Gene order and recombination rate in homologous chromosome regions of the chicken and a passerine bird. Mol Biol Evol 24: 1537–1552 [DOI] [PubMed] [Google Scholar]
- Dobzhansky T, Epling C 1948. The suppression of crossing over in inversion heterozygotes of Drosophila pseudoobscura. Proc Natl Acad Sci 34: 137–141 [DOI] [PMC free article] [PubMed] [Google Scholar]
- Dumont BL, Payseur BA 2008. Evolution of the genomic rate of recombination in mammals. Evolution 62: 276–294 [DOI] [PubMed] [Google Scholar]
- Duret L, Arndt PF 2008. The impact of recombination on nucleotide substitutions in the human genome. PLoS Genet 4: e1000071 doi: 10.1371/journal.pgen.1000071 [DOI] [PMC free article] [PubMed] [Google Scholar]
- Dutrilleux B 1986. Le rôle des chromosomes dans l'evolution: Une nouvelle interpretation. Ann Genet 29: 69–75 [PubMed] [Google Scholar]
- Fan QQ, Xu F, White MA, Petes TD 1997. Competition between adjacent meiotic recombination hotspots in the yeast Saccharomyces cerevisiae. Genetics 145: 661–670 [DOI] [PMC free article] [PubMed] [Google Scholar]
- Felsenstein J 1974. The evolutionary advantage of recombination. Genetics 78: 737–756 [DOI] [PMC free article] [PubMed] [Google Scholar]
- Fisher RA 1930. The genetical theory of natural selection. Oxford University Press, London, UK [Google Scholar]
- Frazer KA, Eskin E, Kang HM, Bogue MA, Hinds DA, Bielharz EJ, Gupta RV, Montgomery J, Morenzoni MM, Nilson GB, et al. 2007. A sequence-based variation map of 8.27 million SNPs in inbred mouse strains. Nature 448: 1050–1053 [DOI] [PubMed] [Google Scholar]
- Gabriel S, Ziaugra L, Tabbaa D 2009. SNP genotyping using the Sequenom MassARRAY iPLEX platform. Curr Prot Hum Genet 60: Chapter 2, Unit 2–12 [DOI] [PubMed] [Google Scholar]
- Geraldes A, Basset P, Gibson B, Smith KL, Harr B, Yu H-T, Bulatova N, Ziv Y, Nachman MW 2008. Inferring the history of speciation in house mice from autosomal, X-linked, Y-linked and mitochondrial genes. Mol Ecol 17: 5349–5363 [DOI] [PMC free article] [PubMed] [Google Scholar]
- Good JM, Handel MA, Nachman MW 2008. Asymmetry and polymorphism of hybrid male sterility during the early stages of speciation in house mice. Evolution 62: 50–65 [DOI] [PMC free article] [PubMed] [Google Scholar]
- Graffelman J, Balding DJ, Gonzalez-Neira A, Bertranpetit J 2007. Variation in estimated recombination rates across human populations. Hum Genet 122: 301–310 [DOI] [PubMed] [Google Scholar]
- Grey C, Baudat F, de Massy B 2009. Genome-wide control of the distribution of meiotic recombination. PLoS Genet 7: e1000035 doi: 10.1371/journal.pbio.1000035 [DOI] [PMC free article] [PubMed] [Google Scholar]
- Hall MC, Willis JH 2005. Transmission ratio distortion in intraspecific hybrids of Mimulus guttatus: Implications for genomic divergence. Genetics 170: 375–386 [DOI] [PMC free article] [PubMed] [Google Scholar]
- Hassold T, Hunt P 2001. To err (meiotically) is human: The genesis of human aneuploidy. Nat Rev Genet 2: 280–291 [DOI] [PubMed] [Google Scholar]
- Hill WG, Robertson A 1966. Effect of linkage on limits to artificial selection. Genet Res 8: 269–294 [PubMed] [Google Scholar]
- Jeffreys AJ, Neumann R 2002. Reciprocal crossover asymmetry and meiotic drive in a human recombination hotspot. Nat Genet 31: 267–271 [DOI] [PubMed] [Google Scholar]
- Jeffreys AJ, Neumann R 2005. Factors influencing recombination frequency and distribution in a human meiotic crossover hotspot. Hum Mol Genet 14: 2277–2287 [DOI] [PubMed] [Google Scholar]
- Jeffreys AJ, Neumann R 2009. The rise and fall of a human recombination hotspot. Nat Genet 41: 625–629 [DOI] [PMC free article] [PubMed] [Google Scholar]
- Jensen-Seaman MI, Furey TS, Payseur BA, Lu Y, Roskin KM, Chen C-F, Thomas MA, Haussler D, Jacob HJ 2004. Comparative recombination rates in the rat, mouse, and human genomes. Genome Res 14: 528–538 [DOI] [PMC free article] [PubMed] [Google Scholar]
- Jorgenson E, Tang H, Gadde M, Province M, Leppert M, Kardia S, Schork N, Cooper R, Rao DC, Boerwinckle E, et al. 2005. Ethnicity and human genetic linkage maps. Am J Hum Genet 76: 276–290 [DOI] [PMC free article] [PubMed] [Google Scholar]
- Karolchik D, Hinrichs AS, Furey TS, Roskin KM, Sugnet CW, Haussler D, Kent WJ 2004. The UCSC Table Browser data retrieval tool. Nucleic Acids Res 32: D493–D496 [DOI] [PMC free article] [PubMed] [Google Scholar]
- Kong A, Gudbjartsson DF, Sainz J, Jonsdottir GM, Gudjonsson SA, Richardsson B, Sigurdardottir S, Barnard J, Hallbeck B, Masson G, et al. 2002. A high-resolution recombination map of the human genome. Nature 31: 241–247 [DOI] [PubMed] [Google Scholar]
- Kong A, Thorleifsson G, Stefansson H, Masson G, Helgason A, Gudbjartsson DF, Jonsdottir GM, Gudjonsson SA, Sverrisson S, Thorlacius T, et al. 2008. Sequence variants in the RNF212 gene associate with genome-wide recombination rate. Science 319: 1398–1401 [DOI] [PubMed] [Google Scholar]
- Li W, Freudenberg J 2009. Two-parameter characterization of chromosome-scale recombination rate. Genome Res 19: 2300–2307 [DOI] [PMC free article] [PubMed] [Google Scholar]
- Lyon MF, Zenthon J, Evans EP, Burtenshaw MD, Willison KR 1988. Extent of the mouse t complex and its inversions shown by in situ hybridization. Immunogenetics 27: 375–382 [DOI] [PubMed] [Google Scholar]
- Maynard Smith J, Haigh J 1974. The hitch-hiking effect of a favourable gene. Genet Res 23: 23–35 [PubMed] [Google Scholar]
- McDaniel SF, Willis JH, Shaw AJ 2007. A linkage map reveals a complex basis for segregation distortion in an interpopulation cross in the moss Ceratodon purpureus. Genetics 176: 2489–2500 [DOI] [PMC free article] [PubMed] [Google Scholar]
- Meznar ER, Gadau J, Koeniger N, Rueppell O 2010. Comparative linkage mapping suggests a high recombination rate in all honeybees. J Hered 101: S118–S126 [DOI] [PubMed] [Google Scholar]
- Morran LT, Cappy BJ, Anderson JL, Phillips PC 2009. Sexual partners for the stressed: Facultative outcrossing in the self-fertilizing nematode Caenorhabditis elegans. Evolution 63: 1473–1482 [DOI] [PMC free article] [PubMed] [Google Scholar]
- Muller HJ 1932. Some genetic aspects of sex. Am Nat 66: 118–138 [Google Scholar]
- Myers S, Bottolo L, Freeman C, McVean G, Donnelly P 2005. A fine-scale map of recombination rates and hotspots across the human genome. Science 310: 321–324 [DOI] [PubMed] [Google Scholar]
- Myers S, Bowden R, Tumian A, Bontrop RE, Freeman C, MacFie TS, McVean G, Donnelly P 2010. Drive against hotspot motifs in primates implicates the PRDM9 gene in meiotic recombination. Science 327: 876–879 [DOI] [PMC free article] [PubMed] [Google Scholar]
- Nachman MW, Churchill GA 1996. Heterogeneity in rates of recombination across the mouse genome. Genetics 142: 537–548 [DOI] [PMC free article] [PubMed] [Google Scholar]
- Neumann R, Jeffreys AJ 2006. Polymorphism in the activity of human crossover hotspots independent of local DNA sequence variation. Hum Mol Genet 15: 1401–1411 [DOI] [PubMed] [Google Scholar]
- Otto SP, Lenormand T 2002. Resolving the paradox of sex and recombination. Nat Rev Genet 3: 252–261 [DOI] [PubMed] [Google Scholar]
- Paigen K, Szatkiewicz JP, Sawyer K, Leahy N, Parvanov ED, Ng SHS, Graber JH, Broman KW, Petkov PM 2008. The recombinational anatomy of a mouse chromosome. PLoS Genet 4: e1000119 doi: 10.1371/journal.pgen.1000119 [DOI] [PMC free article] [PubMed] [Google Scholar]
- Pardo-Manuel de Villena F, Sapienza C 2001. Recombination is proportional to the number of chromosome arms in mammals. Mamm Genome 12: 318–322 [DOI] [PubMed] [Google Scholar]
- Parvanov ED, Ng SHS, Petkov PM, Paigen K 2009. Trans-regulation of mouse meiotic recombination hotspots by Rcr1. PLoS Genet 7: e1000036 doi: 10.1371/journal.pbio.1000036 [DOI] [PMC free article] [PubMed] [Google Scholar]
- Parvanov ED, Petkov PM, Paigen K 2010. Prdm9 controls activation of mammalian recombination hotspots. Science 327: 835 doi: 10.1126/science.1181495 [DOI] [PMC free article] [PubMed] [Google Scholar]
- Petes TD 2001. Meiotic recombination hot spots and cold spots. Nat Rev Genet 2: 360–369 [DOI] [PubMed] [Google Scholar]
- Petkov PM, Broman KW, Szatkiewicz JP, Paigen K 2007. Crossover interference underlies sex differences in recombination rates. Trends Genet 23: 539–542 [DOI] [PubMed] [Google Scholar]
- Ptak SE, Hinds DA, Koehler K, Nickel B, Patil N, Ballinger DG, Przeworski M, Frazer KA, Pääbo S 2005. Fine-scale recombination patterns differ between chimpanzees and humans. Nat Genet 37: 429–434 [DOI] [PubMed] [Google Scholar]
- Ranz JM, Maurin D, Chan YS, von Grotthuss M, Hillier LW, Roote J, Ashburner M, Bergman CM 2007. Principles of genome evolution in the Drosophila melanogaster species group. PLoS Biol 5: e152 doi: 10.1371/journal.pbio.0050152 [DOI] [PMC free article] [PubMed] [Google Scholar]
- Rice WR 2002. Experimental tests of the adaptive significance of sexual recombination. Nat Rev Genet 3: 241–251 [DOI] [PubMed] [Google Scholar]
- Salcedo T, Geraldes A, Nachman MW 2007. Nucleotide variation in wild and inbred mice. Genetics 177: 2277–2291 [DOI] [PMC free article] [PubMed] [Google Scholar]
- She X, Cheng Z, Zollner S, Church DM, Eichler EE 2008. Mouse segmental duplication and copy number variation. Nat Genet 40: 909–914 [DOI] [PMC free article] [PubMed] [Google Scholar]
- Shifman S, Bell JT, Copley RR, Talyor MS, Williams RW, Mott R, Flint J 2006. A high-resolution single nucleotide polymorphism genetic map of the mouse genome. PLoS Biol 12: e395 doi: 10.1371/journal.pbio.0040395 [DOI] [PMC free article] [PubMed] [Google Scholar]
- Shiroishi T, Sagai T, Hanzawa N, Gotoh H, Moriwaki K 1991. Genetic control of sex-dependent meiotic recombination in the major histocompatibility coplex of the mouse. EMBO J 10: 681–686 [DOI] [PMC free article] [PubMed] [Google Scholar]
- Sigurdsson MI, Smith AV, Bjornsson HT, Jonsson JJ 2009. HapMap methylation-associated SNPs, makers of germline DNA methylation, positively correlate with regional levels of human meiotic recombination. Genome Res 19: 581–589 [DOI] [PMC free article] [PubMed] [Google Scholar]
- Silver LM 1995. The mouse genome. In Mouse genetics: Concepts and applications, pp. 83–92 Oxford University Press, New York [Google Scholar]
- True JR, Mercer JM, Laurie CC 1996. Differences in crossover frequency and distribution among three sibling species of Drosophila. Genetics 142: 507–523 [DOI] [PMC free article] [PubMed] [Google Scholar]
- Webb AJ, Berg IL, Jeffreys A 2008. Sperm cross-over activity in regions of the human genome showing extreme breakdown of marker associations. Proc Natl Acad Sci 105: 10471–10476 [DOI] [PMC free article] [PubMed] [Google Scholar]
- Winckler W, Myers SR, Richter DJ, Onofrio RC, McDonald GJ, Bontrop RE, McVean GAT, Gabriel SB, Reich D, Donnelly P, et al. 2005. Comparison of fine-scale recombination rates in humans and chimpanzees. Science 308: 107–111 [DOI] [PubMed] [Google Scholar]
- Wu T-C, Lichten M 1995. Factors that affect the location and frequency of meiosis-induced double-strand breaks in Saccharomyces cerevisiae. Genetics 140: 55–66 [DOI] [PMC free article] [PubMed] [Google Scholar]
- Yang H, Bell T, Churchill F, Pardo-Manuel de Villena F 2007. On the subspecific origin of the laboratory mouse. Nat Genet 39: 1100–1107 [DOI] [PubMed] [Google Scholar]