Abstract
The mechanism for how metformin activates AMPK (AMP-activated kinase) was investigated in isolated skeletal muscle L6 cells. A widely held notion is that inhibition of the mitochondrial respiratory chain is central to the mechanism. We also considered other proposals for metformin action. As metabolic pathway markers, we focused on glucose transport and fatty acid oxidation. We also confirmed metformin actions on other metabolic processes in L6 cells. Metformin stimulated both glucose transport and fatty acid oxidation. The mitochondrial Complex I inhibitor rotenone also stimulated glucose transport but it inhibited fatty acid oxidation, independently of metformin. The peroxynitrite generator 3-morpholinosydnonimine stimulated glucose transport, but inhibited fatty acid oxidation. Addition of the nitric oxide precursor arginine to cells did not affect glucose transport. These studies differentiate metformin from inhibition of mitochondrial respiration and from active nitrogen species. Knockdown of adenylate kinase also failed to affect metformin stimulation of glucose transport. Hence, any means of increase in ADP appears not to be involved in the metformin mechanism. Knockdown of LKB1, an upstream kinase and AMPK activator, did not affect metformin action. Having ruled out existing proposals, we suggest a new one: metformin might increase AMP through inhibition of AMP deaminase (AMPD). We found that metformin inhibited purified AMP deaminase activity. Furthermore, a known inhibitor of AMPD stimulated glucose uptake and fatty acid oxidation. Both metformin and the AMPD inhibitor suppressed ammonia accumulation by the cells. Knockdown of AMPD obviated metformin stimulation of glucose transport. We conclude that AMPD inhibition is the mechanism of metformin action.
Keywords: AMP Kinase, Diabetes, Drug Action, Fatty Acid Oxidation, Glucose Metabolism, AMP Deaminase, Metformin
Introduction
Metformin is currently the most widely used drug for Type II diabetes, and its use is indicated for other diseases related to metabolic syndrome (1). Although the drug has been used for over 50 years (2), its mechanism remains unclear. Recently, it was discovered that metformin causes an activation of the enzyme AMP-activated kinase (AMPK)2 (3), which is now established as a central regulator of intermediary metabolism. The enzyme is broadly distributed, and established as a key regulator of skeletal muscle metabolism (4–6).
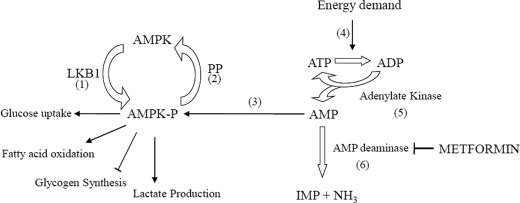
The regulation of AMPK is illustrated in Fig. 1. AMPK activation requires phosphorylation at a specific threonine residue (7). In muscle, the major kinase catalyzing this reaction has been suggested to be LKB1 (8). Thus, the upstream kinase of AMPK is a potential regulatory site (7). In fact, it has been proposed that in liver cells LKB1 activation is the mechanism for metformin activation of AMPK, based on the observation that genetic ablation of the LKB1 eliminated the ability of metformin to activate AMPK in vivo (9). However, evidence also exists against the possibility that LKB1 is the target of metformin action (10, 11).
FIGURE 1.
AMPK in muscle. The proposed mechanisms for the action of metformin in stimulating AMPK can be mapped to this diagram. The enzyme needs to be phosphorylated (1), which is catalyzed principally by LBK1 in liver and muscle. Dephosphorylation (2) inactivates the enzyme; however, binding to AMP leads to activation (3) by making AMPK a poorer substrate for the phosphatase. Normally, energy demand (4) can increase ADP and consequently AMP concentration by means of increased flow through adenylate kinase (5). Alternatively, AMP may arise by an increased ADP due to interruption of mitochondrial energy supply, which would also increase AMP concentration involving flow-through adenylate kinase (5). The present work supports a new site of action for metformin, the AMP deaminase (6). Also shown are several metabolic processes known to be affected by AMPK activation via metformin: glucose uptake, fatty acid oxidation, glycogen synthesis, and lactate formation.
There are other proposals for how metformin might activate AMPK, and all of these involve increased production of AMP. This nucleotide, whereas present in near millimolar concentrations in cells, is present in its free state in the cytosol at micromolar concentrations (12). Increasing AMP concentrations favor its binding to AMPK, both promoting and maintaining the active phosphorylated form (13).
A commonly proposed mechanism for metformin action is an inhibition of mitochondrial respiration at Complex I. This interruption of energy production would decrease ATP production and hence elevate the concentration of ADP. This in turn would elevate the concentration of AMP through the action of adenylate kinase (14–17). This is consistent with an increase in glucose transport that occurs with mitochondrial respiratory inhibition (18).
A variant on the mitochondrial respiration inhibition is the possibility that a reactive nitrogen (19) and/or oxygen species (20) is responsible for activation of AMPK. Thus nitric oxide or the adduct peroxinitrate of nitric oxide plus superoxide (which is formed when mitochondrial respiration is blocked), have been shown to activate AMPK, and could also account for increased glucose uptake (19).
However, it is also known that in both liver and muscle other metabolic processes are affected by metformin. In both of these tissues, metformin stimulates fatty acid oxidation (21–24). It is difficult to rationalize an inhibition of respiration with a stimulation of fatty acid oxidation. We therefore assessed currently proposed mechanisms of action for metformin for their ability to stimulate both glucose uptake and fatty acid oxidation. As none of the current proposals met these conditions, we formed a new hypothesis: AMP deaminase (representing AMP breakdown) might be inhibited by metformin. We present evidence consistent with this hypothesis.
EXPERIMENTAL PROCEDURES
Materials
Metformin, and most chemicals, including BSA (bovine serum albumin, essentially fatty acid free), were obtained from Sigma. Prior to use, BSA was dialyzed extensively against Krebs-Henseleit bicarbonate buffer (KHB). Palmitic acid was from Nu-Chek Prep Inc. (Elysian, MN). Dulbecco's modified Eagle's medium (DMEM), α-minimum essential medium (α-MEM), Hanks' balanced salt solution, fetal bovine serum (FBS), horse serum, trypsin, and NuPAGE 4–12% BisTris gel, and Lipofectamine transfection reagents were from Invitrogen. Scintillation vials were obtained from Wheaton (Millville, NJ) and Scintisafe (30% advanced safety LSC mixture) from Fischer Scientific (Fairlawn, NJ). Cell culture plates and flasks were obtained from Corning Inc. (Corning, NY). 2-Deoxy-d-[2,6-3H]glucose, [1-14C]palmitic acid, and d-[U-14C]glucose were from Amersham Biosciences. Nitrocellulose membranes were obtained from Bio-Rad. Adenylate kinase 1 siRNA (siGenome duplex AK1), DharmaFECT 3 siRNA transfection reagent, negative control siRNA (siCONTROL Non-Targeting siRNA), 5× siRNA buffer, and transfection medium were obtained from Dharmacon Inc. (Chicago, IL). AK1 antibody, LKB1 siRNA, and AMPD siRNA were from Santa Cruz Biotechnology. All other antibodies including AMPKα antibody and P-AMPKα antibody (phosphor-Thr172 specific) were from Cell Signaling Technology (Danvers, MA).
Cell Culture
L6 rat skeletal muscle cells were cultured in DMEM supplemented with 10% FBS. Cells were converted to myotubes by switching to α-MEM with 2% horse serum for 1 day, and then to α-MEM with 1% horse serum for 5–8 days prior to use for experiments. Details of the cell preparation are provided in a prior publication (25).
Lactate Formation
For lactate formation, cells were incubated for 4 h, after which 125 μl of incubation medium was taken for enzymatic end point assay (26) using the HTS 7000 BioPlate Reader.
Glycogen Content Measurement
Glycogen content was assessed by using modified amyloglucosidase assay as previously described (27, 28). After aspiration of the medium, adherent cell monolayers were extracted with 400 μl of 30% (w/v) KOH and boiled for 15 min. Aliquots were spotted onto Whatman 3T paper, which was then immersed in ice-cold 66% (v/v) ethanol. The papers were washed twice with 66% ethanol, and dried papers containing precipitated glycogen were incubated in 2 ml of 0.4 m acetate buffer (pH 4.8) containing 25 units/ml of α-amyloglucosidase for 90 min at 37 °C. Glucose released from glycogen was measured by using an enzymatic end point assay for glucose using hexokinase.
Glucose Uptake Assay
Glucose uptake was determined as the rate of 2-deoxy-d-[2,6-3H]glucose uptake, using a modification of a previous method (29). The cells were first incubated for 15 min with KHB, glucose, and other agents as indicated. At this point, the labeled deoxyglucose (0.6 μCi) was added to each well and the incubation continued for 45 min. The medium was aspirated, and the wells were washed three times with ice-cold KHB to remove exogenous label. The cells were lysed by the addition of 0.1% Triton X-100 (1 ml). Samples of each well were mixed with aqueous scintillation fluid and measured by liquid scintillation counting.
Palmitate Oxidation Assay
Palmitate oxidation was determined by a modification of quantitative measuring the rate of 14CO2 production from 14C-labeled palmitic acid as described previously (30). The KHB for these incubations was supplemented with fatty acid-poor albumin dialyzed against the same buffer (three changes). The final albumin concentration was 1%. After an initial 10 min of incubation, all samples received 2 mm carnitine and [1-14C]palmitic acid (1 μCi/mmol), and other additions as noted, and incubations were continued for 3 h. Aliquots of 0.8 ml were taken from each well to an Eppendorf tube. Each tube had a circular piece of filter paper, produced with a paper punch, attached to the inside of the lid, to which 15 μl of 2 m NaOH was added. 200 μl of 3 m perchloric acid was carefully added to the 0.8 ml to ensure no acid was deposited on the side of the tube, and the lid was quickly closed. The tubes were incubated overnight to allow the [14C]CO2 to be absorbed into the wick. The caps were detached and placed in 10 ml of liquid scintillation fluid for counting.
Glycogen Synthesis
Glycogen synthesis was determined by a modification of the incorporation of d-[U-14C]glucose into glycogen as previously described (31, 32). After incubation, cells were washed with ice-cold KHB and lysed in 0.5 ml of KOH (30%). Aliquots of 0.2 ml were spotted onto Whatman 3T paper, and glycogen was precipitated by immersing the papers in ice-cold 66% (v/v) ethanol overnight. Whatman 3T paper containing precipitated glycogen was transferred to scintillation vials for radioactivity counting.
Transfection of siRNA
L6 cells were transfected with 100 nm AK1/LKB1/AMPD siRNA for 3 days by the following procedure: 104 cells/well were seeded in 12-well plates that were incubated with DMEM with 10% FBS for 2 h before transfection with 2 μm siRNA solution in 1× siRNA buffer or control RNase-free solution. siRNA and transfection reagent were diluted with transfection medium, added to cells in DMEM and 10% FBS, and incubated at 37 °C in 5% CO2 for 2 days. The medium was changed to α-MEM with 1% horse serum with transfection solution for 1 day. Finally, the medium was switched to α-MEM with 1% horse serum without transfection solution for another 4 days. For experiments, cells were incubated with serum-free medium for 2 h, treated with or without 10 mm metformin in the presence of 5 mm glucose for 2 h. Expressed protein content (AK1, LKB1, and AMPD) was visualized by Western blot.
Western Blot
To extract total protein, cells were lysed with 100 μl of buffer containing 2% (w/v) SDS, 62.5 mm Tris (pH 6.8), 10% glycerol, 50 mm DTT, and 0.01% (w/v) bromphenol blue. The procedure of the commercial source of the antibody (Cell Signaling Technology) was essentially followed. The lysates were heated at 95–100 °C for 5 min and cooled on ice. Aliquots of 20 μg of protein were loaded onto a 10% SDS-PAGE gel, and subsequently electroblotted onto nitrocellulose membranes. Membranes were incubated at room temperature for 1 h in blocking buffer containing Tris-buffered saline, 0.1% Tween 20, and 5% nonfat dry milk. Membranes were then incubated with 1:1000 dilution of primary antibody in 10 ml of blocking buffer overnight at 4 °C. Then membranes were incubated with horseradish peroxidase-conjugated secondary antibody (1:2000) and horseradish peroxidase-conjugated anti-biotin antibody (1:1000) to detect biotinylated protein markers in 10 ml of blocking buffer for 1 h at room temperature. Immunoreactive proteins were revealed using enhanced chemiluminescence detection (LumiGLOTM, Cell Signaling).
AMP Deaminase Purification
Rabbit skeletal muscle AMP deaminase was purified by using cellulose phosphate as described by Smiley et al. (33). Briefly, frozen rabbit muscle was ground, mixed with 3.3 times its weight of extraction buffer (0.18 m KCl, 0.054 m KH2PO4, 0.035 m K2HPO4, pH 6.5), and homogenized for 15 s in a Waring Blender. The slurry was stirred at room temperature for 1 h and centrifuged at 14,000 × g for 15 min. The supernatant fraction was poured through two layers of cheesecloth, after which dry cellulose phosphate, which was previously washed and equilibrated with the extraction buffer, was added. After stirring at least 10 min, the cellulose phosphate was allowed to settle. The cellulose phosphate slurry was transferred to a sintered glass filter, and washed repeatedly with extraction buffer followed by a solution containing 0.45 m KCl adjusted to pH 7 with 1 m K2HPO4. When no more protein was detected in the wash, the cellulose phosphate was eluted with 1 m KCl (pH 7). The A280:A260 ratio for the final elute was 1.8 or higher showing little or no contamination by nucleic acids. The enzyme was precipitated by the addition of 0.26 g of solid K2HPO4 for each milliliter of solution. After centrifugation, the precipitate was dissolved in a minimal volume of 0.45 m KC1 at pH 7 to form a near saturated solution at room temperature.
Enzyme Assay
AMP deaminase activity was measured as described by Ashby and Frieden (34). The assay monitored the absorbance change at 285 nm as a result of AMP conversion to IMP in a reaction volume of 2 ml containing 50 mm imidazole-HCl (pH 7.0), 2 mm AMP, and 150 mm KCl. The enzyme activity is expressed as micromoles of IMP produced per min per mg of soluble protein.
Ammonia Assay
Ammonia was measured as described by Kun (35). An end point analysis was performed measuring α-ketoglutaric acid-dependent NADH oxidation at 340 nm, driven by glutamate dehydrogenase.
Statistical Analysis
Statistical evaluation was performed using Student's t test or one-way analysis of variance followed by the Student-Newman-Keuls post hoc test as appropriate. Data are expressed as mean ± S.E. (error bars), and the level of significance was set at p < 0.05.
RESULTS
Metabolic Characterization of Metformin in L6 Skeletal Muscle Cell Cultures
To demonstrate characteristic metformin action in our model, we measured a number of parameters linked to metformin. These included: glucose uptake, fatty acid oxidation, lactate formation, and the phosphorylation of AMPK. For the key processes of glucose uptake and fatty acid oxidation, we additionally incubated cells with substrate concentrations representing submaximal and maximal concentrations to assess this variable in metformin action.
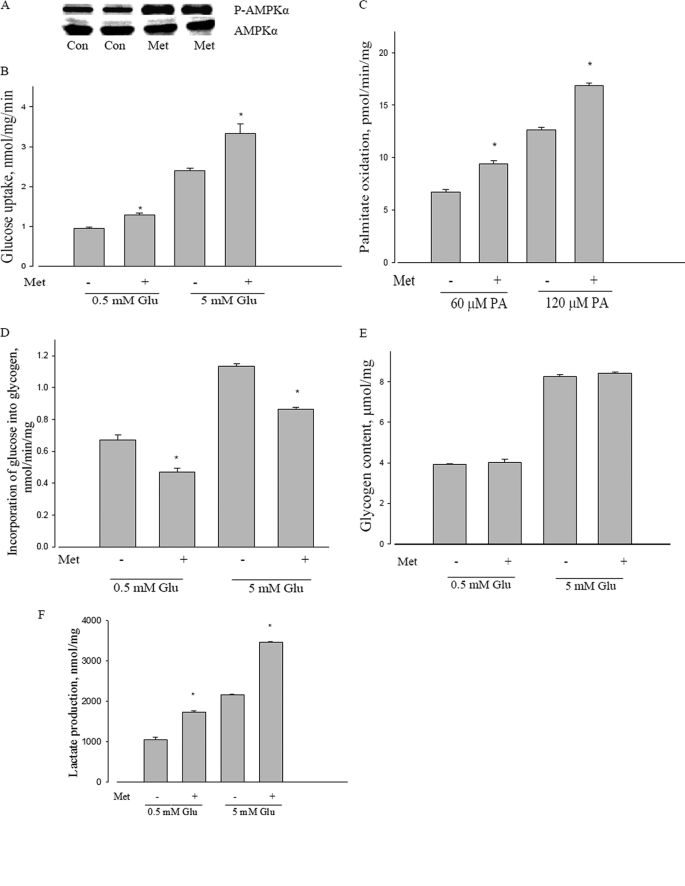
The known ability of metformin to cause phosphorylation of AMPK was confirmed (Fig. 2A). We have confirmed and extended metformin stimulation of glucose transport for L6 cells, using two separate concentrations of medium glucose (Fig. 2B). Metformin also stimulated palmitate oxidation at two levels of this substrate: submaximal (60 μm) and near saturating (120 μm) palmitate concentration, as evident in Fig. 2C. We also explored the metabolic consequences of the known glycogen synthase inhibition by AMPK activation (36, 37). As evident from Fig. 2D, metformin inhibited glycogen synthesis, although no change in total glycogen content was observed (Fig. 2E). We also confirmed an increase in lactate production by metformin (Fig. 2F), once again at different concentrations of medium glucose.
FIGURE 2.
Metabolic effects of metformin in L6 myotubes. A, effect of metformin on AMPKα phosphorylation in L6 myotubes. L6 cells were incubated with or without 10 mm metformin for 2 h, and then AMPKα phosphorylation at Thr172 was measured by Western blot; AMPKα was used as a control. P-AMPKα, phosphorylated AMPKα. AMPKα and P-AMPKα were probed with separate selective antibodies. Con, control; Met, metformin. B, effect of metformin on glucose uptake in L6 myotubes. L6 cells were incubated with low (0.5 mm) or high (5 mm) glucose with or without 10 mm metformin for 2 h, and then glucose uptake was measured as described under “Experimental Procedures.” *, p < 0.05 versus 5 mm glucose (5 mm Glu); *, p < 0.05 versus 0.5 mm glucose (0.5 mm Glu); Met, metformin. C, effect of metformin on palmitate oxidation in L6 myotubes. L6 cells were incubated with 60 or 120 μm palmitic acid with or without 10 mm metformin for 3 h, and then palmitate oxidation was measured as described under “Experimental Procedures.” *, p < 0.05 versus 60 μm palmitic acid (60 μm PA) and 120 μm palmitic acid (120 μm PA), respectively; Met, metformin. D, effect of metformin on glycogen synthesis in L6 myotubes. L6 cells were incubated with 0.5 or 5 mm glucose with or without 10 mm metformin for 2 h, and then glycogen synthesis was measured as described under “Experimental Procedures.” *, p < 0.05 versus 0.5 mm glucose (0.5 mm Glu) and 5 mm glucose (5 mm Glu), respectively; Met, metformin. E, effect of metformin on glycogen content in L6 myotubes. L6 cells were incubated with 0.5 or 5 mm glucose with or without 10 mm metformin for 4 h, and then total glycogen content was measured as described under “Experimental Procedures.” Glu, glucose; Met, metformin. F, effect of metformin on lactate formation in L6 myotubes. L6 cells were incubated with 0.5 or 5 mm glucose with or without 10 mm metformin for 4 h, and then lactate formation was measured as described under “Experimental Procedures.” *, p < 0.05 versus 0.5 mm glucose (0.5 mm Glu) and 5 mm glucose (5 mm Glu), respectively. Data are expressed as per mg of cellular protein.
The percent stimulation of both glucose transport and fatty acid oxidation in this study was usually between 30 and 50%; lactate formation was stimulated somewhat more (about 60%). The changes were unaffected by substrate concentrations (glucose, palmitate).
Comparison of Metformin to Rotenone
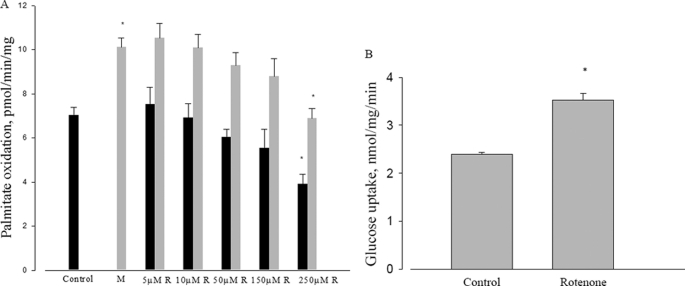
Several reports suggest that metformin acts through inhibition of mitochondrial respiration by inhibiting complex I of the electron transport chain (38–40). To investigate this mechanism we used rotenone, a mitochondrial respiration inhibitor known to act at Complex I. It is well known that rotenone can stimulate both glucose transport and AMPK phosphorylation (41). However, rotenone did not replicate metformin actions on fatty acid oxidation. Whereas metformin stimulated fatty acid oxidation, rotenone inhibited this process, at any concentration up to 250 μm (Fig. 3A). Although the stimulation of fatty acid oxidation by metformin is well established, and the inhibition of mitochondrial respiration by rotenone is also well known, this is the first report to demonstrate both within the context of metformin action. This strongly brings into question the possibility that metformin acts as an inhibitor of mitochondrial respiration. We confirmed the rotenone stimulation of glucose transport at the highest level of rotenone used for fatty acid oxidation (Fig. 3B). The percent stimulation of palmitate oxidation by metformin was about 30% in this series of experiments, and was unaffected by the various concentrations of rotenone.
FIGURE 3.
Effect of rotenone on fatty acid oxidation and glucose uptake. A, effect of different concentrations of rotenone on metformin-induced palmitate oxidation in L6 myotubes. L6 cells were incubated with 120 μm palmitic acid with or without different concentrations of rotenone and 10 mm metformin for 3 h, then palmitate oxidation was measured as described under “Experimental Procedures.” Control (dark bar) or with metformin (light bar); *, p < 0.05. B, effect of rotenone on glucose uptake in L6 cells. L6 cells were incubated with 5 mm glucose with or without 250 μm rotenone. Data are expressed as per mg of cellular protein.
Possible Role of Reactive Nitrogen Species in Metformin Mechanism
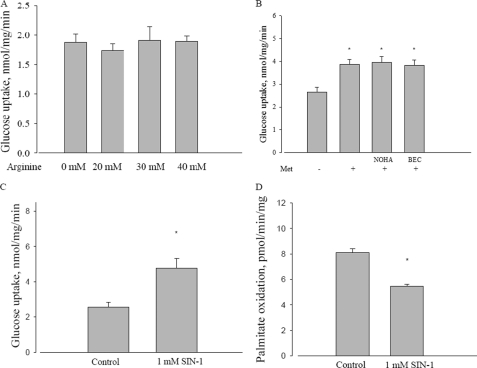
An alternative proposal for the mechanism of metformin is the involvement of nitric oxide (42). As one test of this possibility, we incubated L6 cells with arginine, a precursor of nitric oxide and measured effects on glucose transport. However, even at levels up to 40 mm, arginine had no effect on glucose transport (Fig. 4A). As a converse experiment, we determined if metformin stimulation could be antagonized by inhibition of arginase. However, as shown in Fig. 4B, addition of two different selective arginase inhibitors did not affect metformin stimulation of glucose transport.
FIGURE 4.
Effect of arginine and reactive nitrogen species on metformin action. A, effect of different concentrations of arginine on glucose uptake in L6 myotubes. L6 cells were incubated with 5 mm glucose with or without different concentrations of arginine for 2 h. B, effect of arginase inhibitors on metformin-induced glucose uptake in L6 myotubes. L6 cells were incubated with 5 mm glucose with or without 10 mm metformin, and combined with 10 μm NOHA or 1 μm BEC for 2 h, and then glucose uptake was measured. Met, metformin; NOHA, Nω-hydroxy-nor-l-arginine; BEC, (S)-(2-boronoethyl)-l-cysteine, HCl. *, p < 0.05 versus control. C, effect of SIN-1 on glucose uptake in L6 myotubes. L6 cells were incubated with 5 mm glucose with or without 1 mm SIN-1 for 2 h, and then glucose uptake was measured as described under “Experimental Procedures.” *, p < 0.05 versus control. D, effect of SIN-1 on palmitate oxidation in L6 myotubes. L6 cells were incubated with 120 μm palmitic acid with or without 1 mm SIN-1 for 3 h, and then palmitate oxidation was measured as described under “Experimental Procedures.” *, p < 0.05 versus control. Data are expressed as per mg of cellular protein.
A related possibility is that the reactive nitrogen species peroxynitrite (ONOO−), the adduct of nitric oxide with superoxide, is the intermediate for metformin activation of AMPK (19). To test this, we used the compound SIN-1, known as a generator of ONOO− (43). Although SIN-1 did in fact stimulate glucose transport (Fig. 4C), it inhibited fatty acid oxidation (Fig. 4D). Thus, its behavior mimicked rotenone, rather than metformin.
Exploration of a Role for LKB1
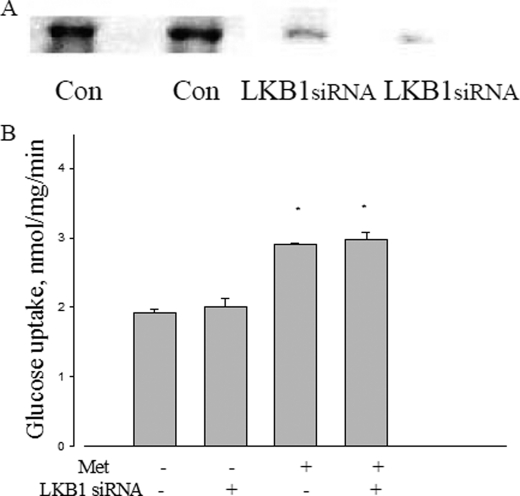
LKB1 is an upstream kinase of AMPK, proposed as the mediator of metformin action in liver (9) and established as the principal kinase for converting AMPK to the active form in muscle (10). To determine its possible role in metformin action in L6 cells, a knockdown of LKB1 protein was performed using a selective siRNA. As shown in Fig. 5A, the siRNA for LKB1, but not the control siRNA substantially reduced LKB1 protein levels. As shown in Fig. 5B, ablation of LKB1 had no effect on the ability of metformin to stimulate glucose uptake.
FIGURE 5.
Effect of LKB1 on metformin action. A, LKB1 protein expression treated with LKB1 siRNA. B, effect of LKB1 siRNA on metformin-induced glucose uptake in L6 myotubes. After LKB1 siRNA transfection, L6 cells were incubated with 5 mm glucose with or without 10 mm metformin for 2 h, and then glucose uptake was measured as described under “Experimental Procedures.” Data are expressed as per mg of cellular protein. *, p < 0.05 versus no metformin.
Possible Involvement of Adenylate Kinase in Metformin Action
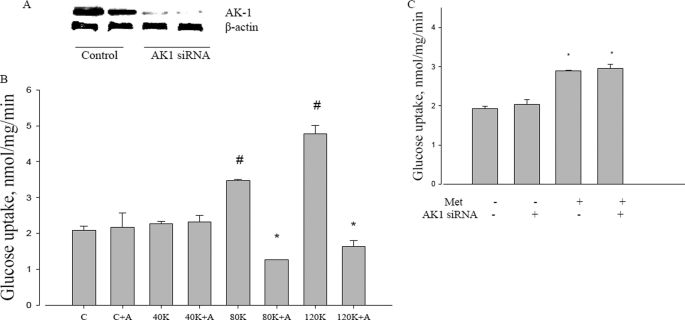
Adenylate kinase catalyzes the near equilibrium reaction of ADP with ATP and AMP; the principal muscle isoform is AK1 (45). If metformin action causes increased ATP turnover by any means, adenylate kinase flux would be required for the increased AMP to activate AMPK. To test this possible role, a knockdown of AK1 was performed with a selective siRNA. Fig. 6A shows that the siRNA for AK1 reduced protein expression to very low levels. As adenylate kinase is in very high concentrations in muscle, we performed a further control to assess the functional knockdown of AK1, shown in Fig. 6B. We used potassium depolarization as a means to increase ATP turnover, which should then increase AMP by flux through adenylate kinase. Fig. 6B shows that the knockdown itself did not affect glucose uptake, nor did sub-threshold levels of potassium. However, 80 mm or higher levels of potassium did increase glucose transport, and under these circumstances, concomitant knockdown of adenylate kinase led to inhibition of glucose transport below control levels. This established the validity of depolarization as a control for adenylate kinase involvement.
FIGURE 6.
Effect of adenylate kinase on metformin action. A, AK1 protein expression after ablation with AK1 siRNA. B, effect of adenylate kinase knockdown on potassium gluconate actions on glucose uptake. Potassium gluconate was present at 40 mm (40K), 80 mm (80K), and 120 mm (120K). C, control; A, AK1 siRNA; K, potassium gluconate. #, p < 0.05 compared with control. *, p < 0.05 compare with 80 and 120 K without AK1 siRNA. C, metformin-induced glucose uptake in L6 myotubes. After transfected by AK1 siRNA, L6 cells were incubated with 5 mm glucose with or without 10 mm metformin for 2 h, and then glucose uptake was measured as described under “Experimental Procedures.” Met, metformin. *, p < 0.05 compared with no metformin. Data are expressed as per mg of cellular protein.
We then examined the effect of the AK1 knockdown on metformin stimulation of glucose transport. We found that, unlike K depolarization, metformin stimulation of glucose uptake was unaffected by the ablation of adenylate kinase (Fig. 6C).
AMP Deaminase Inhibition as a Locus of Metformin Action
Having ruled out existing proposals for the action of metformin, we considered a new possibility: rather than metformin increasing the formation of AMP, perhaps it attenuates its removal. Because the first step of AMP removal is deamination to IMP, we examined the possibility that AMP deaminase (AMPD) might be inhibited by metformin.
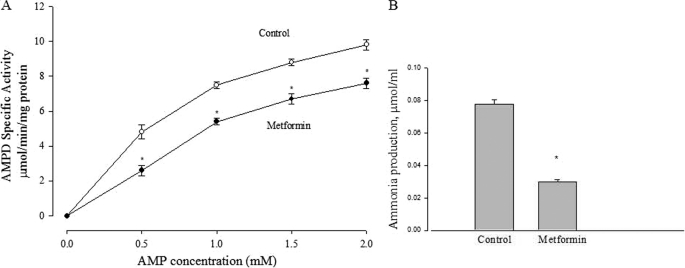
Fig. 7A shows that metformin inhibited the activity of purified AMPD, obtained from rabbit muscle. We have found indistinguishable results using commercially obtained adenosine deaminase (data not shown). This is probably due to the fact that the enzyme mechanisms are extremely similar; in fact both enzymes are equally sensitive to the same inhibitors (46).
FIGURE 7.
Effect of metformin on AMP deaminase activity. A, the effect of 10 mm metformin on enzyme activity of isolated AMP deaminase at various substrate (AMP) concentrations. *, p < 0.05 versus control at different concentration of AMP, respectively. Data are expressed as per mg of soluble protein. B, effect of metformin on ammonia production in L6 myotubes. L6 cells were incubated with 5 mm glucose with or without 10 mm metformin for 2 h, and ammonia production was measured as described under “Experimental Procedures.” *, p < 0.05 versus control. Data are expressed as per mg of cellular protein.
A further prediction based on the hypothesis that metformin acts through AMPD inhibition is that ammonia formation should be reduced when cells are incubated with metformin. In agreement with this expectation, we found (Fig. 7B) that metformin decreased ammonia accumulation in the medium.
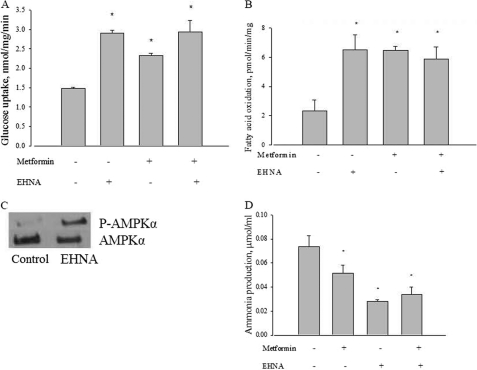
As a separate test, we compared the action of a known AMPD inhibitor erythro-9-(2-hydroxy-3-nonyl)-adenine (EHNA) with metformin. As shown in Fig. 8, A and B, EHNA did in fact stimulate both glucose transport and fatty acid oxidation like metformin, and that the actions of the two agents were not additive. Fig. 8C shows that, like metformin, EHNA also led to an increased phosphorylation of AMPK. EHNA also replicated the metformin-induced inhibition of ammonia formation by L6 cells, and this action was not additive to that of metformin (Fig. 8D).
FIGURE 8.
Effect of EHNA, metformin, or both on glucose uptake in L6 myotubes. A, L6 cells were incubated with 5 mm glucose with or without 10 mm metformin, 100 μm EHNA, or both for 2 h, and then glucose uptake was measured as described under “Experimental Procedures.” *, p < 0.05 versus control. B, effect of EHNA, metformin, or both on palmitate oxidation in L6 myotubes. L6 cells were incubated with 120 μm palmitic acid with or without 10 mm metformin, 100 μm EHNA, or both for 3 h, and then palmitate oxidation was measured as described under “Experimental Procedures.” *, p < 0.05 versus control. C, effect of EHNA on AMPKα phosphorylation in L6 myotubes. L6 cells were incubated with or without 100 μm EHNA for 2 h, and then AMPKα phosphorylation at Thr172 was measured by Western blot; AMPKα was used as a control. P-AMPKα, phosphorylated AMPKα. AMPKα and P-AMPKα were probed with separate selective antibodies. D, effect of EHNA on ammonia production in L6 myotubes. L6 cells were incubated with 5 mm glucose with or without 100 μm EHNA for 2 h, and then ammonia production was measured as described under “Experimental Procedures.” *, p < 0.05 versus control. Data are expressed as per mg of cellular protein.
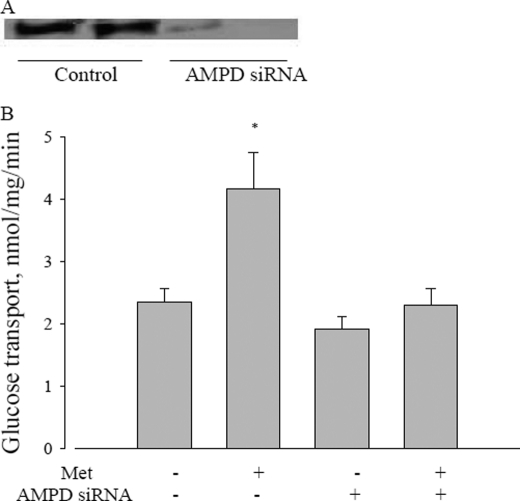
Finally, we conducted knockdown of AMPD1 using siRNA in L6 cells. If our hypothesis is correct, this treatment should prevent metformin stimulation of glucose transport. As is evident in Fig. 9, the knockdown experiment greatly reduced AMPD protein, and obviated the metformin stimulation of glucose uptake by the cells.
FIGURE 9.
Effect of AMPD on metformin action. A, AMP deaminase protein expression treated with AMPD siRNA. B, effect of AMPD siRNA on metformin-induced glucose uptake in L6 myotubes. After AMPD siRNA transfection, L6 cells were incubated with 5 mm glucose with or without 10 mm metformin for 2 h, and then glucose uptake was measured as described under “Experimental Procedures.” Data are expressed as per mg of cellular protein. *, p < 0.05 versus no metformin.
DISCUSSION
Both the interruption of mitochondrial energy formation and the presence of metformin lead to the same end point: the activation of AMPK (3, 20). It is therefore not surprising that the hypothesis emerged that metformin causes respiratory inhibition, and thereby activates AMPK (40). All three events: mitochondrial inhibition, the presence of metformin, and the activation of AMPK, also correlate with a stimulation of glucose uptake (7, 48).
If we consider only glucose uptake and mitochondrial alterations, the effects seem consistent with fundamental cell regulatory properties. The notion that a decreased mitochondrial activity increases glycolysis is known as the Crabtree effect (49, 50), the opposite of the Pasteur effect (decreased glucose utilization upon admission of oxygen to cells). However, the wider consideration of fatty acid oxidation developed in this study underscores the complication of drawing the conclusion that metformin acts by mitochondrial respiratory inhibition. It is likely that the response of the cell to energy interruption is a distinct means of AMPK activation from the response to metformin.
A recent debate highlighted the positions for (11) and against (51) the notion that metformin inhibits mitochondrial energy production. A key argument against an in vivo role for metformin acting as a mitochondrial inhibitor is the fact that the extent of inhibition is modest. A further complication is the fact that insulin resistance of diabetes can be ameliorated by suppressing the oxidative damage that arises from mitochondrial inhibition (52). This makes mitochondrial inhibition an unlikely site of action for metformin, a drug that improves rather than exacerbates insulin sensitivity.
The stimulation of fatty acid oxidation is an established action of metformin (24). By using this pathway in addition to glucose transport, we found that none of the currently proposed hypotheses for metformin were metabolically consistent. Moreover, the finding that ablation of adenylate kinase does not affect metformin action suggests that any mechanism that involves increased AMP formation driven by ATP turnover (and hence, increased ADP formation) is unlikely.
A functional control for the adenylate kinase knockdown is important because this enzyme is abundant in skeletal muscle. In fact, it was first discovered in this tissue, as is evident from its original name, myokinase (53). It is of interest to note also that depolarizing concentrations of potassium that stimulate glucose uptake caused an inhibition of this process when adenylate kinase was attenuated. This implies that adenylate kinase is needed to maintain the phosphorylation potential of the cell to support glucose uptake.
In one study (16) it was suggested that methylsuccinate could antagonize metformin in cultured islet cells. This implies that metformin indeed inhibits respiration at complex I, and that once succinate could be introduced, it overcomes the inhibition by providing electrons to ubiquinone. However, the actual evidence in that study was indirect. The investigators used a tetrazolium dye (3-(4,5-dimethylthiazol-2-yl)-2,5-diphenyltetrazolium bromide), commonly known as MTT. Prior studies did suggest that increased (MTT) reduction correlates to glucose availability (54). However, there are some difficulties in accepting the conclusions of the methylsuccinate study (16). First, the dye accepts electrons from ubiquinone, but is not a steady state measure of respiration. Moreover, in the actual data of that study, MTT reduction was inhibited by metformin whether methylsuccinate was present or not. In fact, there was merely more reduction in the presence of methylsuccinate.
As it is well known that AMPK can in fact be activated by an inhibition of respiration (18), it may seem irresistible to conclude that metformin must work in the same way. However, the known stimulation of fatty acid oxidation by metformin in this study and others (21–24) is incommensurate with mitochondrial respiratory inhibition. Add to that the current finding that direct inhibition by rotenone did not stimulate respiration at any level, and the fact that adenylate kinase knockdown prevents stimulation by depolarization but not metformin, and it becomes clear that a separate mechanism for metformin action is needed.
We conclude that there are two distinct means of activating AMPK. One of these is represented by interruption of mitochondria, and physiologically represented by anaerobic metabolism. Because fatty acid oxidation is not possible in this condition, the only energy pathway available, glycolysis, is enhanced by the AMPK-directed stimulation of glucose transport. Metformin also stimulates glucose uptake but additionally stimulates fatty acid oxidation and can therefore operate aerobically. The ability to inhibit AMPD presents a separate means of increasing AMPK, leading to increased utilization of both major energy fuels, glucose and fat.
We were unable to find evidence that reactive nitrogen species were involved in the mechanism of metformin action. Nitric oxide itself appeared to have no effect on either glucose uptake or fatty acid oxidation. The peroxynitrate generator SIN-1 was able to stimulate glucose uptake, but inhibited fatty acid oxidation, suggesting that it too may act in a manner similar to rotenone, that is, inhibition of respiration. This would imply that any agent, which suppresses mitochondrial respiration, might also stimulate glucose uptake and activate AMPK, but they are not replicating the action of metformin, but rather mitochondrial energy supply interruption. One recent study (55) did find that SIN-1 could increase insulin sensitivity and fatty acid oxidation, using the C2C12 muscle cell culture. However, those findings were not comparable, as the SIN-1 was not an acute treatment, but incubated several hours.
A separate site of AMPK action proposed recently is the pyruvate dehydrogenase complex (56). This would be consistent with the metabolic alterations observed here for metformin; in particular, an increase in fatty acid oxidation would be expected to depress PDC activity. Future experiments examining more metabolic targets will add weight to the connections between metformin, AMPD, and AMPK.
The possibility that metformin acts through LKB1, the upstream kinase and a separate activator of AMPK, was raised for liver by (9). However, it has subsequently been shown that metformin does not act through LKB1 (10, 11); we have confirmed in this study that siRNA knockdown of LKB1 had no effect on metformin stimulation of glucose uptake.
It is established that activation of AMPK requires phosphorylation (13), and LKB1 is a major AMPK kinase (57). Thus our finding that ablation of LKB1 did not prevent the action of metformin is surprising. However, there are other upstream AMPK kinases, such as the Ca2+-calmodulin protein kinase (58). Moreover, it is known that elevation in AMP concentrations alone can activate and phosphorylate AMPK, even without alterations in the upstream kinases, as AMP binding to AMPK makes it both a better phosphorylation substrate and a poorer protein phosphatase substrate (59).
The notion that AMPD inhibition could increase AMP and activate AMPK was raised previously by Borkowski et al. (60) in the context of the known correlation between AMPD deficiency and cardioprotection (see also Ref. 61). Although the authors raise the notion based largely on the protective function of deaminase inhibitors, it is consistent with the proposal advanced in this study. Moreover, the authors suggest that inhibition of AMPD could be a pharmacologically useful tool. Our results suggest that, as the mechanism of metformin action, it is already widely employed, and our findings supply an explanation.
Our results do not preclude any connection between metformin and nitric oxide, particularly in the in vivo case where an action as central to metabolism as increasing AMPK is involved. However, they do make less likely the notion that nitric oxide is directly involved in the ability of metformin to activate AMPK. It is also possible that nitric oxide can independently lead to AMPK activation, just as anoxia can do so, again in a separate way from metformin. The data showing stimulation of glucose uptake, but inhibition of fatty acid oxidation with SIN-1 resemble rotenone action.
In conclusion, our present evidence in favor of the new hypothesis of AMP deaminase inhibition by metformin includes: direct inhibition by metformin of the isolated enzyme, and an AMP deaminase inhibitor leading to the stimulation of glucose transport, the stimulation of fatty acid oxidation, the inhibition of ammonia accumulation, and the elimination of metformin action following knockdown of AMPD. It is not clear how an inhibition of AMP deaminase would affect other aspects of cellular metabolism. However, it has been suggested that genetic deficiencies in this enzyme have little if any detrimental effects on muscle metabolism (62), which may explain how this enzyme could be inhibited and yet have few other complications.
AMPD is part of the purine nucleotide cycle (63), a proposed route that, in deaminating and reaminating AMP, converts aspartate to fumarate and can thereby serve an anapleuoric role in the Krebs cycle. If this is operating in the muscle cells, it would explain the large (over 70%) inhibition of ammonia formation in Fig. 7B exerted by metformin, because ammonia is a product of the cycle. Further experiments will be necessary to test this mechanism.
Previously, we have presented an abstract of this work (47). More recently, we have conducted studies to synthesize more selective inhibitors of AMPD to determine their abilities to mimic metformin. A manuscript of that work is in preparation, and a patent application was submitted for the use of the compounds as agents for the treatment of diabetes and related disorders.3
Ochs, R. S., and Talele, T. (November 25, 2009) U. S. Patent 61,264,321, patent pending.
- AMPK
- AMP-activated protein kinase
- ACC
- acetyl-CoA carboxylase
- AK1
- adenylate kinase 1
- AMPD
- AMP deaminase
- EHNA
- erythro-9-(2-hydroxy-3-nonyl)-adenine
- KHB
- Krebs-Henseleit buffer
- MCD
- malonyl-CoA decarboxylase
- α-MEM
- α-minimum essential medium
- MTT
- 3-(4,5-dimethylthiazol-2-yl)-2,5-diphenyltetrazolium bromide
- SIN-1
- 3-morpholinosydnonimine
- BisTris
- 2-[bis(2-hydroxyethyl)amino]-2-(hydroxymethyl)propane-1,3-diol.
REFERENCES
- 1. Hardie D. G. (2008) FEBS Lett. 582, 81–89 [DOI] [PubMed] [Google Scholar]
- 2. Halimi S. (2006) Diabetes Metab. 32, 555–556 [DOI] [PubMed] [Google Scholar]
- 3. Zhou G., Myers R., Li Y., Chen Y., Shen X., Fenyk-Melody J., Wu M., Ventre J., Doebber T., Fujii N., Musi N., Hirshman M. F., Goodyear L. J., Moller D. E. (2001) J. Clin. Invest. 108, 1167–1174 [DOI] [PMC free article] [PubMed] [Google Scholar]
- 4. Bertrand L., Ginion A., Beauloye C., Hebert A. D., Guigas B., Hue L., Vanoverschelde J. L. (2006) Am. J. Physiol. Heart Circ. Physiol. [DOI] [PubMed] [Google Scholar]
- 5. Hardie D. G., Sakamoto K. (2006) Physiology 21, 48–60 [DOI] [PubMed] [Google Scholar]
- 6. Sakoda H., Ogihara T., Anai M., Fujishiro M., Ono H., Onishi Y., Katagiri H., Abe M., Fukushima Y., Shojima N., Inukai K., Kikuchi M., Oka Y., Asano T. (2002) Am. J. Physiol. Endocrinol. Metab. 282, E1239–E1244 [DOI] [PubMed] [Google Scholar]
- 7. Towler M. C., Hardie D. G. (2007) Circ. Res. 100, 328–341 [DOI] [PubMed] [Google Scholar]
- 8. Sakamoto K., McCarthy A., Smith D., Green K. A., Grahame H. D., Hardie D., Ashworth A., Alessi D. R. (2005) EMBO J. 24, 1810–1820 [DOI] [PMC free article] [PubMed] [Google Scholar]
- 9. Shaw R. J., Lamia K. A., Vasquez D., Koo S. H., Bardeesy N., Depinho R. A., Montminy M., Cantley L. C. (2005) Science 310, 1642–1646 [DOI] [PMC free article] [PubMed] [Google Scholar]
- 10. Sakamoto K., Göransson O., Hardie D. G., Alessi D. R. (2004) Am. J. Physiol. Endocrinol. Metab. 287, E310–E317 [DOI] [PubMed] [Google Scholar]
- 11. Hardie D. G. (2006) Gastroenterology 131, 973–975 [DOI] [PubMed] [Google Scholar]
- 12. Veech R. L., Lawson J. W., Cornell N. W., Krebs H. A. (1979) J. Biol. Chem. 254, 6538–6547 [PubMed] [Google Scholar]
- 13. Davies S. P., Helps N. R., Cohen P. T., Hardie D. G. (1995) FEBS Lett. 377, 421–425 [DOI] [PubMed] [Google Scholar]
- 14. Brunmair B., Staniek K., Gras F., Scharf N., Althaym A., Clara R., Roden M., Gnaiger E., Nohl H., Waldhäusl W., Fürnsinn C. (2004) Diabetes 53, 1052–1059 [DOI] [PubMed] [Google Scholar]
- 15. El-Mir M. Y., Nogueira V., Fontaine E., Avéret N., Rigoulet M., Leverve X. (2000) J. Biol. Chem. 275, 223–228 [DOI] [PubMed] [Google Scholar]
- 16. Hinke S. A., Martens G. A., Cai Y., Finsi J., Heimberg H., Pipeleers D., Van de Casteele M. (2007) Br. J. Pharmacol. 150, 1031–1043 [DOI] [PMC free article] [PubMed] [Google Scholar]
- 17. Owen M. R., Doran E., Halestrap A. P. (2000) Biochem. J. 348, 607–614 [PMC free article] [PubMed] [Google Scholar]
- 18. Kang J., Heart E., Sung C. K. (2001) Am. J. Physiol. Endocrinol. Metab. 280, E428–E435 [DOI] [PubMed] [Google Scholar]
- 19. Zou M. H., Kirkpatrick S. S., Davis B. J., Nelson J. S., Wiles W. G., 4th, Schlattner U., Neumann D., Brownlee M., Freeman M. B., Goldman M. H. (2004) J. Biol. Chem. 279, 43940–43951 [DOI] [PubMed] [Google Scholar]
- 20. Kim W. H., Lee J. W., Suh Y. H., Lee H. J., Lee S. H., Oh Y. K., Gao B., Jung M. H. (2007) Cell. Signal. 19, 791–805 [DOI] [PubMed] [Google Scholar]
- 21. Misra P. (2008) Expert Opin. Ther. Targets 12, 91–100 [DOI] [PubMed] [Google Scholar]
- 22. Musi N. (2006) Curr. Med. Chem. 13, 583–589 [DOI] [PubMed] [Google Scholar]
- 23. Misra P., Chakrabarti R. (2007) Indian J. Med. Res. 125, 389–398 [PubMed] [Google Scholar]
- 24. Collier C. A., Bruce C. R., Smith A. C., Lopaschuk G., Dyck D. J. (2006) Am. J. Physiol. Endocrinol. Metab. 291, E182–E189 [DOI] [PubMed] [Google Scholar]
- 25. Wingertzahn M. A., Ochs R. S. (1999) Proc. Soc. Exp. Biol. Med. 221, 234–241 [DOI] [PubMed] [Google Scholar]
- 26. Bergmeyer H. U. (1974) Methods of Enzymatic Analysis, 2 Ed., Verlag, New York [Google Scholar]
- 27. Ceddia R. B., Somwar R., Maida A., Fang X., Bikopoulos G., Sweeney G. (2005) Diabetologia 48, 132–139 [DOI] [PubMed] [Google Scholar]
- 28. Passonneau J. V., Lauderdale V. R. (1974) Anal. Biochem. 60, 405–412 [DOI] [PubMed] [Google Scholar]
- 29. Sarabia V., Lam L., Burdett E., Leiter L. A., Klip A. (1992) J. Clin. Invest. 90, 1386–1395 [DOI] [PMC free article] [PubMed] [Google Scholar]
- 30. Saddik M., Lopaschuk G. D. (1991) J. Biol. Chem. 266, 8162–8170 [PubMed] [Google Scholar]
- 31. Cuendet G. S., Loten E. G., Jeanrenaud B., Renold A. E. (1976) J. Clin. Invest. 58, 1078–1088 [DOI] [PMC free article] [PubMed] [Google Scholar]
- 32. Blair A. S., Hajduch E., Litherland G. J., Hundal H. S. (1999) J. Biol. Chem. 274, 36293–36299 [DOI] [PubMed] [Google Scholar]
- 33. Smiley K. L., Jr., Berry A. J., Suelter C. H. (1967) J. Biol. Chem. 242, 2502–2506 [PubMed] [Google Scholar]
- 34. Ashby B., Frieden C. (1978) J. Biol. Chem. 253, 8728–8735 [PubMed] [Google Scholar]
- 35. Kun E., Loh H. H., El-Fiky S. B. (1966) Mol. Pharmacol. 2, 481–490 [PubMed] [Google Scholar]
- 36. Jørgensen S. B., Nielsen J. N., Birk J. B., Olsen G. S., Viollet B., Andreelli F., Schjerling P., Vaulont S., Hardie D. G., Hansen B. F., Richter E. A., Wojtaszewski J. F. (2004) Diabetes 53, 3074–3081 [DOI] [PubMed] [Google Scholar]
- 37. Halse R., Fryer L. G., McCormack J. G., Carling D., Yeaman S. J. (2003) Diabetes 52, 9–15 [DOI] [PubMed] [Google Scholar]
- 38. Batandier C., Guigas B., Detaille D., El-Mir M. Y., Fontaine E., Rigoulet M., Leverve X. M. (2006) J. Bioenerg. Biomembr. 38, 33–42 [DOI] [PubMed] [Google Scholar]
- 39. Fryer L. G., Parbu-Patel A., Carling D. (2002) J. Biol. Chem. 277, 25226–25232 [DOI] [PubMed] [Google Scholar]
- 40. Ota S., Horigome K., Ishii T., Nakai M., Hayashi K., Kawamura T., Kishino A., Taiji M., Kimura T. (2009) Biochem. Biophys. Res. Commun. 388, 311–316 [DOI] [PubMed] [Google Scholar]
- 41. Hayashi T., Hirshman M. F., Fujii N., Habinowski S. A., Witters L. A., Goodyear L. J. (2000) Diabetes 49, 527–531 [DOI] [PubMed] [Google Scholar]
- 42. Davis B. J., Xie Z., Viollet B., Zou M. H. (2006) Diabetes 55, 496–505 [DOI] [PubMed] [Google Scholar]
- 43. Daiber A., Schildknecht S., Müller J., Kamuf J., Bachschmid M. M., Ullrich V. (2009) Free Radic. Biol. Med. 47, 458–467 [DOI] [PMC free article] [PubMed] [Google Scholar]
- 44. Deleted in proof.
- 45. Hancock C. R., Janssen E., Terjung R. L. (2005) Am. J. Physiol. Cell Physiol. 288, C1287–C1297 [DOI] [PubMed] [Google Scholar]
- 46. Erion M. D., Kasibhatla S. R., Bookser B. C., van Poelje P. D., Reddy M. R., Gruber H. E., Appleman J. R. (1998) J. Am. Chem. Soc. 121, 308–319 [Google Scholar]
- 47. Parakhia R. A., Ouyang J., Ochs R. S. (2009) FASEB J. 23, 856 [Google Scholar]
- 48. Schimmack G., Defronzo R. A., Musi N. (2006) Diabetes Obes. Metab. 8, 591–602 [DOI] [PubMed] [Google Scholar]
- 49. Ibsen K. H. (1961) Cancer Res. 21, 829–841 [PubMed] [Google Scholar]
- 50. Sussman I., Erecińska M., Wilson D. F. (1980) Biochim. Biophys. Acta 591, 209–223 [DOI] [PubMed] [Google Scholar]
- 51. Hoek J. B. (2006) Gastroenterology 131, 974–975 [Google Scholar]
- 52. Liu J. K., Shen W. L., Zhao B. L., Wang Y., Wertz K., Weber P., Zhang P. F. (2009) Adv. Drug Deliv. Rev. 1343–1352 [DOI] [PubMed] [Google Scholar]
- 53. Kotelnikova A. V. (2001) Biochemistry 66, 816–817 [Google Scholar]
- 54. Segu V. B., Li G., Metz S. A. (1998) Metabolism 47, 824–830 [DOI] [PubMed] [Google Scholar]
- 55. Lee W. J., Kim H. S., Park H. S., Kim M. O., Kim M., Jun J. Y., Kim E. H., Lee S. A., Lee S. H., Koh E. H., Park J. Y., Lee K. U. (2009) Korean Diabetes J. 33, 198–205 [Google Scholar]
- 56. Fediuc S., Pimenta A. S., Gaidhu M. P., Ceddia R. B. (2008) J. Cell. Physiol. 215, 392–400 [DOI] [PubMed] [Google Scholar]
- 57. Imai K., Inukai K., Ikegami Y., Awata T., Katayama S. (2006) Biochem. Biophys. Res. Commun. 351, 595–601 [DOI] [PubMed] [Google Scholar]
- 58. Jensen T. E., Rose A. J., Jørgensen S. B., Brandt N., Schjerling P., Wojtaszewski J. F., Richter E. A. (2007) Am. J. Physiol. Endocrinol. Metab. 292, E1308–E1317 [DOI] [PubMed] [Google Scholar]
- 59. Richter E. A., Ruderman N. B. (2009) Biochem. J. 418, 261–275 [DOI] [PMC free article] [PubMed] [Google Scholar]
- 60. Borkowski T., Orlewska C., Slominska E. M., Yuen A., Lipinski M., Rybakowska I., Foks H., Kaletha K. K., Yacoub M. H., Smolenski R. T. (2008) Nucleosides Nucleotides Nucleic Acids 27, 867–871 [DOI] [PubMed] [Google Scholar]
- 61. Kalsi K. K., Yuen A. H., Rybakowska I. M., Johnson P. H., Slominska E., Birks E. J., Kaletha K., Yacoub M. H., Smolenski R. T. (2003) Cardiovasc. Res. 59, 678–684 [DOI] [PubMed] [Google Scholar]
- 62. Hanisch F., Joshi P., Zierz S. (2008) J. Neurol. 255, 318–322 [DOI] [PubMed] [Google Scholar]
- 63. Lowenstein J. M. (1990) Int. J. Sports Med. 11, Suppl. 2, S37–S46 [DOI] [PubMed] [Google Scholar]


