Abstract
Actin requires the chaperonin containing TCP1 (CCT), a hexadecameric ATPase essential for cell viability in eukaryotes, to fold to its native state. Following binding of unfolded actin to CCT, the cavity of the chaperone closes and actin is folded and released in an ATP-dependent folding cycle. In yeast, CCT forms a ternary complex with the phosducin-like protein PLP2p to fold actin, and together they can return nascent or chemically denatured actin to its native state in a pure in vitro folding assay. The complexity of the CCT-actin system makes the study of the actin folding mechanism technically challenging. We have established a novel spectroscopic assay through selectively labeling the C terminus of yeast actin with acrylodan and observe significant changes in the acrylodan fluorescence emission spectrum as actin is chemically unfolded and then refolded by the chaperonin. The variation in the polarity of the environment surrounding the fluorescent probe during the unfolding/folding processes has allowed us to monitor actin as it folds on CCT. The rate of actin folding at a range of temperatures and ATP concentrations has been determined for both wild type CCT and a mutant CCT, CCT4anc2, defective in folding actin in vivo. Binding of the non-hydrolysable ATP analog adenosine 5′-(β,γ-imino)triphosphate to the ternary complex leads to 3-fold faster release of actin from CCT following addition of ATP, suggesting a two-step folding process with a conformational change occurring upon closure of the cavity and a subsequent final folding step involving packing of the C terminus to the native-like state.
Keywords: Actin, Chaperone Chaperonin, Protein Folding, Spectroscopy, Yeast, AMP-PNP, Acrylodan, Phosducin-like Protein
Introduction
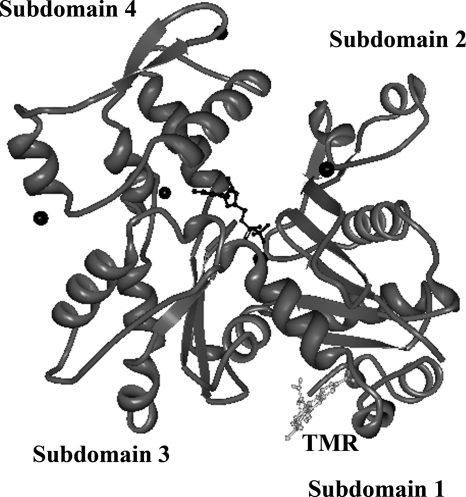
The cytoskeletal protein actin is one of the most highly conserved in all eukaryotes and is involved in many essential cellular processes such as cell motility and cytokinesis. It exists in two forms: at low ionic concentrations, the G-actin monomer is stable, whereas in the presence of KCl, MgCl2, or CaCl2, and ATP, the F-actin polymer predominates. The actin monomer consists of two domains, the so-called large domain and the small domain, which surround a nucleotide binding cleft and a high affinity divalent cation binding site (1). Actin can be further divided into subdomains, with the N and C termini co-located at the base of subdomain 1 (Fig. 1). G-actin can be unfolded thermally or chemically in the presence of denaturant or EDTA. Studies of the unfolding kinetics of rabbit skeletal muscle α-actin (ActA) with EDTA have shown that following loss of the cation and nucleotide from native actin, the actin then unfolds to an intermediate I3, which cannot refold spontaneously (2) (Equation 1). Unfolding actin by EDTA treatment allows folding studies to be performed under physiological conditions.
In eukaryotic cells, nascent actin is folded by the cytosolic chaperonin containing TCP1 (CCT or TRiC for TCP1-ring complex). CCT is a 1-MDa protein complex made up of two rings, each of which consists of 8 different subunits, known as CCTα– CCTθ in mammals and CCT1–CCT8 in yeast. Recent studies of the CCT interactome have revealed a wide number of interacting proteins within the cell (3, 4), although only a limited number of obligate substrates have been characterized, including actin and tubulin, as well as a number of WD40 repeat containing proteins (5). Actin folding by CCT in vivo in yeast requires the phosducin-like protein PLP2p3 (6), which contains a thioredoxin fold and forms a stable ternary structure with actin and CCT in vitro (7). The precise manner by which PLP2p assists actin folding is as yet unknown; PLP2p may be involved in the initial loading of actin onto CCT and ensuring that the correct engagement is reached, and/or it could have a role during folding or release. Although both EDTA-unfolded ActA and Saccharomyces cerevisiae actin (Act1) can be bound by yeast CCT only Act1 can be productively refolded, indicating species-specific differences in actin folding behavior and providing compelling evidence for the absolute dependence of actin on CCT for its folding to the native state (8).
FIGURE 1.
The crystal structure of G-actin (1), with ADP and Ca2+ bound. Actin is labeled at Cys374 with tetramethylrhodamine (TMR). Cys374 is the dye labeling site used in the studies in this paper.
Here, we discuss the development of a spectroscopic actin folding assay that allows actin folding by CCT to be monitored in real time through labeling with the environmentally sensitive dye acrylodan. This approach allows greater sensitivity in the measurement of actin folding kinetics than gel electrophoresis-based assays, and has been used to observe the effects of ATP concentration and temperature on the rate of actin folding. Actin folding by CCT4anc2, a mutated form of CCT found in the temperature-sensitive yeast strain anc2-1 (9), has also been investigated. We present evidence for an actin folding intermediate within a functional folding cycle.
EXPERIMENTAL PROCEDURES
Purification and Labeling of Act1
Act1 was purified from S. cerevisiae lysate by affinity chromatography using a DNase I-Affi-Gel column followed by ion exchange chromatography (10). The purified protein was eluted with ∼220 mm KCl, and polymerized by addition of 1 mm ATP and 2 mm MgCl2 and incubation on ice for 30 min. A 5-fold molar excess of Alexa Fluor 488-C5-maleimide (Invitrogen) or a 20-fold molar excess of acrylodan (Anaspec) was added to the polymerized actin and incubated on ice overnight. The labeled actin was centrifuged (2 h, 4 °C, 100,000 × g) then the pellet was resuspended in 10 mm Tris, pH 7.5, 0.5 mm β-mercaptoethanol, 0.2 mm CaCl2, 50 μm ATP and dialyzed against the same buffer for 70 h at 4 °C. After centrifugation, the supernatant was collected and the actin concentration and degree of labeling were calculated using the extinction coefficient 26,600 m−1 cm−1 for actin at 290 nm (2), 18,500 m−1 cm−1 for acrylodan at 385 nm (11), and 71,000 m−1 cm−1 for Alexa Fluor 488 at 494 nm (2). Labeling efficiencies of 60–80 and 92% were obtained for AcrylAct1 and 488Act1, respectively.
Purification of CCT
CCT and CCT4anc2 were purified through a calmodulin-binding peptide tag inserted into subunit CCT3 (12). S. cerevisiae lysate expressing the tagged CCT was bound to calmodulin resin (Stratagene) and washed first with 20 mm HEPES, pH 8, 1 m NaCl, 2 mm CaCl2, 1 mm TCEP, 0.01% (v/v) lauryldimethylamine oxide (LDAO), 20% (v/v) glycerol, 5 mm ATP, 0.5 mm ADP, 15 mm MgCl2, followed by two washes with 20 mm HEPES, pH 8, 150 mm KCl, 0.1 mm CaCl2, 1 mm TCEP, 0.01% (v/v) LDAO, 20% (v/v) glycerol, 5 mm ATP, 0.5 mm ADP, 15 mm MgCl2, and a final wash with 20 mm HEPES, pH 8, 150 mm KCl, 0.1 mm CaCl2, 1 mm TCEP, 0.01% (v/v) LDAO, 20% (v/v) glycerol. CCT was eluted with 20 mm HEPES, pH 8, 150 mm KCl, 2 mm EGTA, 1 mm TCEP, 0.01% (v/v) LDAO, 20% (v/v) glycerol. To ensure that only the intact complex was isolated, CCT was further purified by sucrose gradient (20 mm HEPES, pH 8, 150 mm KCl, 1 mm TCEP, 0.01% (v/v) LDAO, 15% (v/v) glycerol, 10–37.5% (w/v) sucrose). The CCT containing fractions were concentrated, and the concentration was determined using extinction coefficient, 320,240 m−1 cm−1 at 280 nm (7).
Purification of PLP2p
Polyhistidine (His6)-tagged PLP2p was expressed in BL21(DE3) Escherichia coli cells and purified by affinity chromatography using His-Spin Protein Miniprep columns (Zymo Research). After washing with His-Binding Buffer (50 mm sodium phosphate, pH 7.8, 300 mm NaCl, 10 mm imidazole, 0.03% Triton X-100), PLP2p was eluted from the column with His-Elution buffer (50 mm sodium phosphate, pH 7.8, 300 mm NaCl, 250 mm imidazole) and dialyzed into 20 mm HEPES, pH 8, 75 mm KCl.
Polymerization of AcrylAct1
AcrylAct1 (8.5 μm, 0.35 mg/ml) was incubated at room temperature in the presence of 100 mm KCl, 2 mm MgCl2, 1 mm ATP.
Unfolding of AcrylAct1
AcrylAct1 was diluted in 20 mm HEPES, pH 8, 75 mm KCl, 1 mm TCEP, 2 μm ATP to concentrations of no more than 18 μg/ml (440 nm). Unfolding was carried out at 24 °C by addition of 1.5 mm EDTA.
488Act1 Folding Assay
488Act1 (6.5 μg/ml, 160 nm) was unfolded in the presence of CCT (460 μg/ml, 460 nm) and PLP2p (15 μg/ml, 450 nm) in 20 mm HEPES, pH 8, 75 mm KCl, 1 mm TCEP, 1.5 mm EDTA, 10% (v/v) glycerol. Samples were protected from light and incubated at room temperature for 3 h. For release from CCT, 2 mm ATP and 10 mm MgCl2 were added and the mixture was incubated at 30 °C. Samples for gels were added to 20 mm HEPES, pH 8, 10% (v/v) glycerol, 1 mm CaCl2 and kept on ice until loading onto a 6% native polyacrylamide gel containing 1 mm ATP (7).
AcrylAct Folding Assay
AcrylAct1 or AcrylActA (14.4 μg/ml, 350 nm) were unfolded for 3 h in the presence of CCT or CCT4anc2 (400 μg/ml, 400 nm) and PLP2p (13.5 μg/ml, 400 nm) as for 488Act1. ATP and MgCl2 were added so that the final concentrations were 1, 2, or 4 mm ATP, and 5, 10, or 20 mm MgCl2, respectively, with the final glycerol concentration at 8% (v/v). Folding was monitored spectroscopically, either by repeatedly scanning the fluorescence emission of the sample or by monitoring emission at 470 nm for the duration of the reaction.
Co-polymerization of 488Act1 and AcrylAct1 with Unlabeled Act1
Refolded AcrylAct1 or 488Act1 was incubated overnight on ice with Act1 to a final Act1 concentration of 250 μg/ml (6 μm) in the presence of 115 mm KCl, 1.7 mm ATP, and 6 mm MgCl2. After centrifugation (2 h, 4 °C, 100,000 × g), the pellet was analyzed by SDS-PAGE.
AMP-PNP Actin Folding Assay
AcrylAct1 or 488Act1 were unfolded as described previously. AMP-PNP and MgCl2 were added to final concentrations of 10 and 50 mm, respectively, and samples were incubated at 30 °C for 10 min. After this time, ATP or ADP and MgCl2 were added so that the final concentrations were 8 mm AMP-PNP, 2 mm ATP or ADP, 50 mm MgCl2, 70 mm KCl, 8% (v/v) glycerol, 0.64 mm TCEP and folding was monitored either spectroscopically for AcrylAct1 or by native PAGE for 488Act1.
Fluorescence Measurements
Fluorescence emission was measured with the PTI QuantaMaster 40 spectrofluorometer with a Haake DC10-K15 refrigerated circulator attached. The excitation wavelength used was 380 nm, and the excitation slits were set to 2 nm. Emission spectra were collected from 425 to 525 nm, and time-based emission was monitored at 470 nm with the emission slits set to 4 nm.
Data Analysis
The change in the intensity of acrylodan fluorescence emission at 470 nm over time was fitted to a single exponential using GraphPad Prism 5 (GraphPad Software), with the first 50 s of time-based scans being excluded because a mixing phase could be seen. Rate constants were calculated as the mean of at least three independent experiments with error bars representing the standard deviation.
RESULTS
Acrylodan Labeling and Chemical Unfolding of Act1
Dye labeling of Act1 at Cys374 has a large impact on the kinetics of chemical unfolding with EDTA, resulting in much more rapid unfolding of the labeled protein to the I3 state in comparison to unlabeled Act1. This is a useful experimental property because yeast actin unfolds on a much slower time scale than ActA, taking several hours to denature completely (2, 7). Actin was selectively labeled at Cys374 by polymerization followed by incubation with Alexa Fluor 488 or acrylodan, a thiol-reactive derivative of Prodan. Cys374 is located in a flexible stretch of residues at the C terminus of actin, which packs against subdomain 1 in the crystal structure of the actin-rhodamine dye complex (1) (Fig. 1).
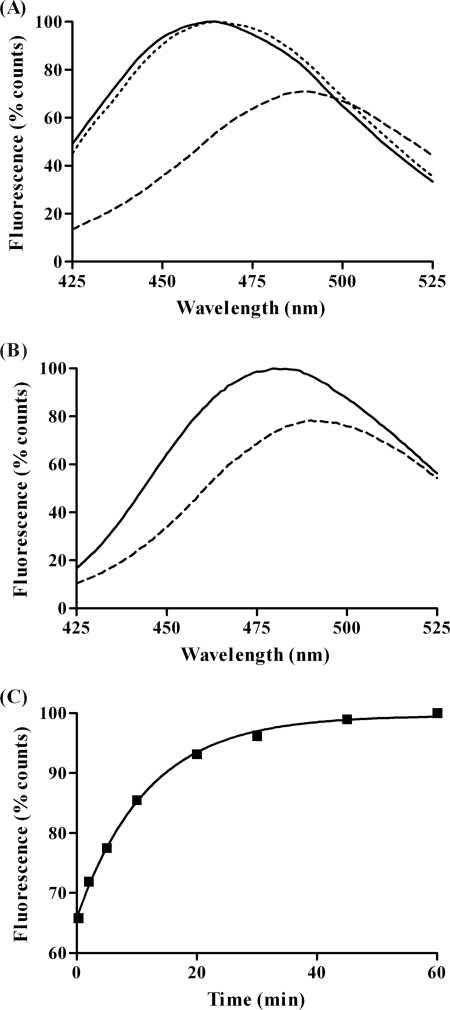
Prodan, which has an emission maximum of 531 nm in water (13), is highly sensitive to changes in its environment. In less polar solvents than water a blue shift in emission, accompanied by a large increase in the fluorescence intensity, occurs and this allows changes in the environment of the probe to be monitored spectroscopically. The emission of native acrylodan-labeled Act1 (AcrylAct1NAT) is dramatically different than that of EDTA-unfolded AcrylAct1 (AcrylAct1I3), which has a very similar emission spectrum to CCT-bound AcrylAct1 (Fig. 2A). The maximum emission wavelength for AcrylAct1NAT is at 489 nm, and the Stokes shift of this form is 98 nm, in contrast to the EDTA-unfolded protein that exhibits maximum fluorescence emission at 463 nm and has a Stokes shift of 81 nm. Interestingly, the maximum emission wavelength of the unfolded AcrylAct1 is very similar to the value of 465 nm reported for acrylodan-labeled rabbit skeletal muscle F-actin (14), indicating that the environment in which the dye is found in F-actin is similar to that of the CCT-bound AcrylAct1. Within acrylodan-labeled yeast F-actin, fluorescence emission is also observed to be blue-shifted (Fig. 2B), although not to the same extent as that of the acrylodan-labeled rabbit F-actin (14). This could reflect only partial incorporation of AcrylAct1 into the filaments, however, it is known that actin labeled in this manner is capable of polymerization because that is how it is purified. This blue shift in fluorescence emission in the unfolded, CCT-bound and polymerized AcrylAct1 indicates that the probe is in a less polar environment in these three states compared with the native G-actin monomer.
FIGURE 2.
A, fluorescence emission spectra of AcrylAct1NAT (- - -), AcrylAct1I3 (—), and AcrylAct1-CCT (···) exciting at 380 nm; B, polymerization of AcrylAct1: fluorescence emission spectra of AcrylAct1 immediately after addition of MgCl2 and ATP (- - -) and after a 10-min polymerization (—); C, representative scan showing the change in acrylodan emission at 470 nm as AcrylAct1 is unfolded in the presence of 10% (v/v) glycerol.
The rate of EDTA unfolding of AcrylAct1NAT was determined by fitting a single exponential to the fluorescence emission at 470 nm (Fig. 2C). This gives the observed rate constant for the unfolding reaction as 1.48 × 10⁻³ ± 0.09 × 10⁻³ s−1 in the presence of the 10% (v/v) glycerol required to stabilize CCT. Stopped-flow analysis of the unfolding kinetics of rabbit skeletal muscle actin revealed a transition through intermediates (2), such as the calcium-free, ATP-bound intermediate I1, which is not visible in this analysis of yeast actin unfolding. This could be due to the short time scale over which this transition takes place relative to the mixing time. Alternatively, it is also possible that the calcium-unbinding transition does not affect the local environment surrounding the fluorescent probe at the C terminus to the same degree as the four tryptophan residues in subdomain 1 that constitute the entire intrinsic fluorescence signal of actin (2).
Release of Fluorescently Labeled Act1 from CCT
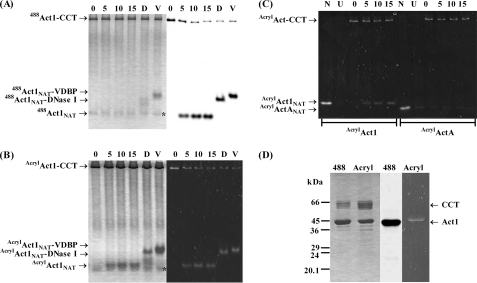
It has been shown that CCT can form a stable ternary complex with 488Act1 and PLP2p following chemical unfolding of 488Act1NAT with EDTA, and that upon addition of ATP and MgCl2 native 488Act1 can be released in the pure in vitro folding assay system (7) (Fig. 3A). We then experimented with various environmentally sensitive probes but found that some labeled actins behaved differently with respect to release from CCT; for example, Act1, fluorescently labeled with 5-((2-((iodoacetyl)amino)ethyl)amino)naphthalene-1-sulfonic acid (IAEDANS), AEDANSAct1, could be loaded onto CCT, but native AEDANSAct1 could not be released from the complex (data not shown). In contrast, AcrylAct1 could be loaded onto CCT and released in the same manner as 488Act1 (Fig. 3B). It can be seen by native PAGE that the folding reaction is complete within ∼10 min, and around 90% of actin is released. The refolded AcrylAct1 can be bound by DNase I and vitamin D-binding protein (Fig. 3B), and copolymerized with unlabeled actin (Fig. 3D), demonstrating that native G-actin is formed (7). Further support for the natural behavior of the folding system used here is that it is unable to fold AcrylActA to the native state (Fig. 3C). This had only previously been shown in the coupled in vitro transcription/translation system (8) but is a property of this pure component system as well.
FIGURE 3.
A and B, time course of ATP-dependent release of (A) 488Act1 and (B) AcrylAct1 from CCT. Act1 is unfolded onto CCT in the presence of EDTA and released by addition of 2 mm ATP and 10 mm MgCl2. The time is shown in minutes following addition of ATP. In the final lane the formation of native actin is confirmed by binding to DNase I (D) and vitamin D-binding protein (V) as shown by a shift on the native gel. Coomassie-stained native gels are shown on the left-hand side as well as in-gel fluorescence of (A) 488Act1 (imaged on Typhoon 9410) and (B) AcrylAct1 (imaged by UV lamp) of the same gel on the right-hand side. Unlabeled PLP2p is visible as marked by star; C, in-gel fluorescence by UV lamp of the release of AcrylAct1 and AcrylActA from CCT, showing native actin (N), EDTA unfolded actin (U), and the time in minutes after addition of 2 mm ATP and 10 mm MgCl2 to CCT-bound actin. AcrylActANAT is not released from CCT; D, refolded 488Act1 and AcrylAct1 can be co-polymerized with unlabeled Act1, as can be shown by centrifugation at 100,000 × g of these filaments. The Coomassie-stained SDS gel is shown on the left-hand side, followed by in-gel fluorescence of 488Act1 and AcrylAct1. A small amount of aggregated CCT, formed overnight during the actin polymerization step, pellets.
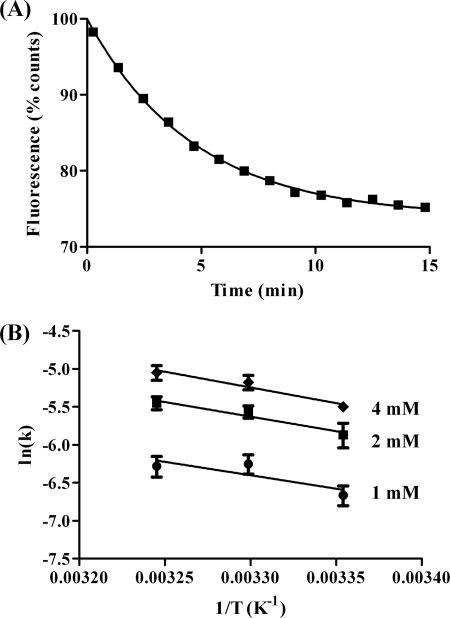
Upon addition of ATP and MgCl2 to the AcrylAct1-CCT-PLP2p complex, a decrease in acrylodan emission accompanied by a shift in the maximum emission wavelength was observed (Figs. 2A and 4A), thereby allowing the folding reaction to be monitored spectroscopically. This shift occurs over a similar time period to the release of native actin from CCT as observed by native PAGE, and as such can be used to make more accurate measurements of the rate of release from the chaperonin. A single exponential can be fitted to the decrease in emission as AcrylAct1 is released from CCT (Fig. 4A). The observed rate constant of release (k) of AcrylAct1 from CCT over a range of temperatures was determined based on fluorescence emission at 470 nm. By fitting these rate constants to the Arrhenius equation (Fig. 4B), the activation energy of actin release by CCT was found to be 34 ± 8, 32 ± 8, and 29 ± 19 kJ mol−1 for 4, 2, and 1 mm ATP, respectively. It can be seen that although both temperature and the concentration of ATP have an effect on the rate of release of AcrylAct1, the temperature dependence appears similar over the different ATP concentrations indicating that the reaction is proceeding by the same mechanism. The spectroscopic folding assay was not performed using 488Act1 as only a very small change in the fluorescence emission is observed upon unfolding (2) and because a mixture of states exist during the folding process, the changes in intensity would be too small to accurately measure.
FIGURE 4.
A, representative scan of fluorescence emission of AcrylAct1 at 470 nm following release from CCT with 2 mm ATP, 10 mm MgCl2, fitted to a single exponential to allow the rate constant k to be determined; B, Arrhenius plot of the rate constants for release of AcrylAct1 from CCT with 1 mm ATP, 5 mm MgCl2 (circles), 2 mm ATP, 10 mm MgCl2 (squares), or 4 mm ATP, 20 mm MgCl2 (diamonds). Error bars show the standard deviation.
Release of Act1 from CCT4anc2
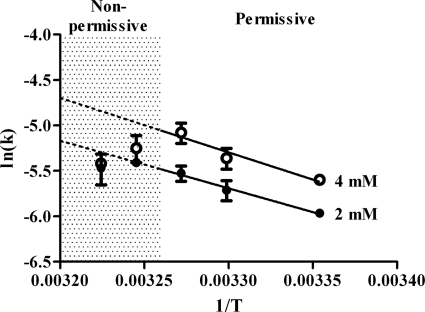
CCT4anc2 contains the G345D mutation in subunit CCT4, located in the external region of the apical domain, and causes actin defects in the temperature-sensitive yeast strain anc2-1 (9, 15). Using the spectroscopic folding assay, the rate of release of AcrylAct1 by CCT4anc2 was found to be essentially the same as for CCT at 2 mm ATP; however, a different behavior was observed at the higher ATP concentration. At 4 mm ATP the rate of release of AcrylAct1, whereas faster than from the mutant at 2 mm ATP, was slower than that from wild type CCT. Furthermore, the rate of release increased with temperature up to 32.5 °C, but at temperatures above this there was a subsequent decrease in the rate of release (Fig. 5), consistent with the heat-sensitive behavior in vivo of CCT4anc2 mutant cells (9, 15).
FIGURE 5.
Arrhenius plot of the rate constants for release of AcrylAct1 from CCT4anc2 in the presence of 4 mm ATP (open circles) or 2 mm ATP (solid circles). Temperatures of 35 °C and higher are non-permissive in vivo in CCT4anc2 (9, 15). Error bars show the standard deviation.
Release of Act1 from CCT following Addition of AMP-PNP
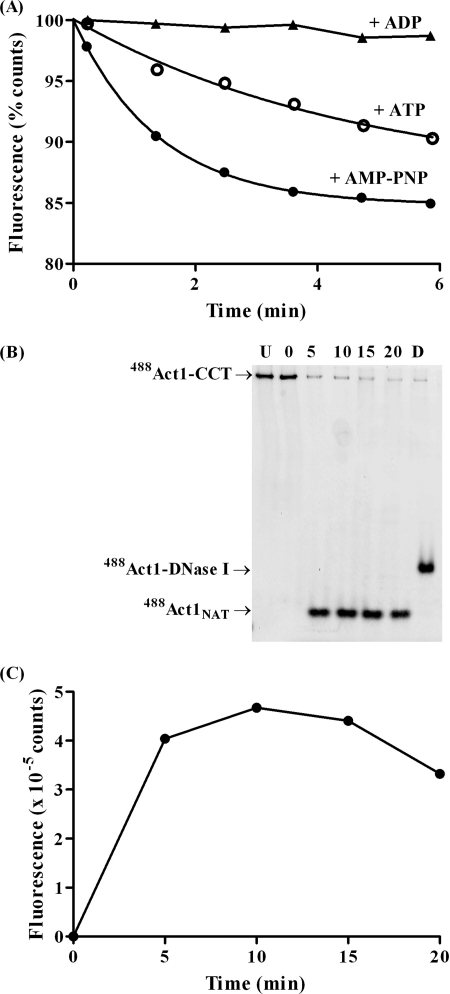
Addition of the non-hydrolysable ATP analog AMP-PNP to CCT-bound AcrylAct1 had no significant effect on the acrylodan emission spectrum. However, upon addition of ATP to a final concentration of 2 mm, actin release could be seen to occur at a faster rate than observed when ATP was added directly to the AcrylAct1-CCT complex in the absence of AMP-PNP (Fig. 6A). Fitting of a single exponential to the decrease in fluorescence gave an observed rate constant k of 11.8 × 10⁻³ ± 0.7 × 10⁻³ s−1, which is an ∼3-fold increase relative to the release of AcrylAct1 from CCT without the preincubation step (3.8 × 10⁻³ ± 0.3 × 10⁻³ s−1). Following addition of ADP in place of ATP, no release was observed (Fig. 6A). The same effect of preincubation of the loaded CCT complex with AMP-PNP was exhibited for release of 488Act1 as demonstrated by native PAGE analysis (Fig. 6, B and C), with virtually all 488Act1 released from CCT and returned to its native state within 5 min of addition of ATP compared with 10 to 15 min with ATP alone.
FIGURE 6.
A, representative scans of the fluorescence emission at 470 nm for incubation of AcrylAct1-CCT with AMP-PNP followed by addition of ADP (triangles), and release of AcrylAct1 from CCT by addition of ATP following preincubation in the presence (solid circles) or absence (open circles) of AMP-PNP; B, in-gel fluorescence of a native gel showing release of 488Act1 from CCT, showing 488Act1 unfolded onto CCT (U), then incubation of this complex for 10 min with AMP-PNP and time points following addition of ATP to allow release of 488Act1NAT; C, quantification of the 488Act1NAT band from the gel (B).
DISCUSSION
Conformational Changes at the C Terminus of Actin during Folding
The selective labeling of actin at its C-terminal cysteine is useful for observing changes in conformation of this flexible region of the protein. Labeling of Cys374 with bulky fluorophores has an effect on the local structure of the amino acid within the actin molecule (16), with the label acting as a mutation that destabilizes the actin molecule sufficiently to allow chemical unfolding over a shorter time scale. It should be noted that chemically unfolded actin, not nascent actin, has been used in these assays, and the solution structures of these two denatured actin states, which are unknown, may well differ (12). Nonetheless, binding of the fluorescently labeled actin to DNase I and vitamin D-binding protein and its ability to polymerize demonstrates that neither the introduction of the fluorophore, nor the manner of unfolding of actin, prevents folding of actin to a functional monomer.
The proximity of the probe to the hinge region in the actin monomer makes it ideal for monitoring folding because EM structures demonstrate that actin bound to CCT takes on a more open structure, with the large and small domains binding in a 1,4-conformation across the cavity connected only by this hinge (17). It has also been hypothesized that reconfiguration of the C terminus is an important step in the chaperone-mediated folding of actin (18). The contribution of the C terminus to the stability of Act1 is clearly reflected in the variability of folding and unfolding behaviors depending on the nature of modification at Cys374. The inability of CCT to refold AEDANSAct1, whereas 488Act1 and AcrylAct1 can be refolded, demonstrates that the nature of the probe attached to the surface is very important and provides further evidence toward the role of the C terminus both in the folding and stability of native actin.
Interestingly, the acrylodan moiety is located in a less polar environment in both the unfolded I3 intermediate and in F-actin relative to G-actin. This demonstrates the differences in conformation between the monomeric and polymeric actin states, but also similarities between unfolded actin and F-actin. Perhaps F-actin re-explores the unfolding landscape of actin during its functional cycles as proposed by Altschuler and Willison (19). CCT subunits have been shown to associate with the F-actin filaments, which may indicate exposure of similar aggregation-prone, CCT-binding regions in both the unfolded and polymerized actin (20).
Actin Folding by CCT4anc2
The G345D mutation in CCT4anc2 affects the inter-ring allostery of the chaperonin, and results in a slower rate of ATP hydrolysis (15). Actin folding by CCT4anc2 is defective in vivo above the permissive temperature of 30 °C, with actin aggregates being observed in cells (9). Folding assays with radiolabeled human β-actin demonstrated that whereas the rate of actin folding by CCT4anc2 is similar to that of wild type CCT, there is an ∼2-fold reduction in the yield of native actin (15). The data obtained from the spectroscopic folding assay in general agrees with this, with the rate of actin release by the mutant affected by both changes in ATP concentration and temperature. A drop in the rate of actin release by CCT4anc2 is observed above the permissive temperature (highlighted in Fig. 5) and is more pronounced in the presence of 4 mm ATP compared with 2 mm ATP. We note that the intracellular concentrations of ATP in S. cerevisiae range from 1.1 to 4.5 mm (21) and therefore the maximum attainable level of activity of the enzyme may be reached at 37 °C in 4 mm ATP and hence the maximum effect of the anc2 mutation should be observed at these extremes (Fig. 5). Nevertheless, it is striking that the range of activity varies only 2-fold over this physiological relevant range of both nucleotide concentration and temperature. A lower yield of native actin is observed in the presence of CCT4anc2 compared with CCT (data not shown), but it is unclear whether this is due to a decrease in loading of the unfolded actin, less effective release from the chaperonin, or a combination of the two.
Mechanism of Actin Folding by CCT
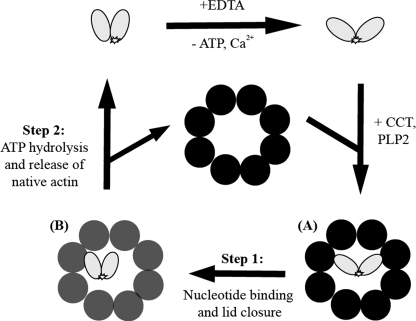
The C terminus of Act1 appears to be in a very similar environment in both the unfolded AcrylAct1I3 and AcrylAct1-CCT based on the acrylodan emission spectra. This is the case for both the nucleotide-free and AMP-PNP-bound AcrylAct1-CCT complexes, so it seems probable that no significant conformational rearrangement at the C terminus of actin occurs upon binding of AMP-PNP and closure of the lid of the chaperonin (22). The differing kinetics of ATP-dependent release of native AcrylAct1 from CCT when preincubated with AMP-PNP relative to direct release from the complex indicates that a conformational change in actin does occur upon lid closure, which corresponds to an initial folding step that is independent of the C terminus of actin.
Neirynck et al. (18) developed a multistep model for the CCT-mediated folding of human β-actin based on their analysis of mutants from an alanine scan of the entire actin polypeptide chain and previous structural electron microscopy models of CCT-actin complexes (17, 22). Their model proposes two major transitions. During transition 1, the CCT-captured, extended form of actin rotates about the interdomain hinge region formed by Gly146 and Gly150 (23) and rebinds as a more compact actin mass, as observed after closure of the CCT cavity by AMP-PNP (22). During transition 2, the actin C terminus, which is still in direct contact with a CCT-subunit binding site, is released from CCT to establish its correct contacts with subdomain 1 of actin and this step completes folding. The kinetic behavior of AcrylAct1 folding on CCT in the presence of AMP-PNP followed by ATP supports a sequential model of actin folding (Fig. 7). First, incubation of the pre-assembled CCT-actin-PLP2p ternary complex in AMP-PNP allows actin to progress along its folding trajectory to a more closed state, consistent with both the structural (22) and Förster resonance energy transfer studies (24), and second the addition of ATP permits the correct packing of the actin C terminus and thus release. We suggest that an ATP hydrolysis step by a particular CCT subunit(s) is required for C-terminal release, which is why AMP-PNP does not facilitate this process.
FIGURE 7.
Schematic representation of the proposed model of AcrylAct1 unfolding and binding to CCT. The fluorescent probe is in a more polar environment in native actin than in the EDTA-unfolded intermediate I3 and in the complex with CCT. A, actin binds in a 1,4-conformation across the cavity of the open CCT complex (black) as shown by EM (17). B, binding of ATP or AMP-PNP closes the lid of CCT (gray). Step 1, nucleotide binding induces a conformational change within the actin molecule (24), but does not facilitate release and the environment of the C terminus remains unaffected. Step 2, hydrolysis of ATP is required for the final packing of the actin C terminus and release of native actin from CCT.
The reduced polarity of the environment surrounding the probe in the AcrylAct1-CCT complex and the similarity of the emission spectra to that of acrylodan-labeled rabbit F-actin (14) suggests that the C terminus is unlikely to be “free” in solution. Instead, it is likely to be fixed somewhere, probably on a particular CCT subunit binding site, and as such the acrylodan fluorescence remains unaffected by the preliminary folding step induced by binding of AMP-PNP. The acrylodan moiety could be tethered to CCT in this preliminary folding step, or bound to the actin molecule itself. This CCT-actin folding intermediate complex can convert actin into its native form through rearrangement at the C terminus of actin, perhaps locking the molecule into the correct conformation. This native or native-like conformation would be released from the post-ATP hydrolysis, ADP state of CCT, which could no longer bind it as it was no longer in a non-native conformation.
Based on the relative rates with or without preincubation with AMP-PNP, it appears that a slow rearrangement takes place upon binding of the nucleotide to CCT. This rearrangement does not include the labeled C terminus, and most likely would be observed as a lag phase in the initial stages of the folding reaction that could well be masked in this analysis by the mixing period observed initially. Development of the spectroscopic folding assay for analysis by stopped-flow might allow further insight into this stage of the reaction. This is followed by a more rapid rearrangement of the C terminus as ATP is hydrolyzed.
The mechanism by which ATP displaces AMP-PNP in the chaperone complex is as yet unknown. Due to the variation in ATP binding sites across the subunits of CCT, it is possible that AMP-PNP is not bound at all to the potential ATP binding sites within the chaperone. Binding and hydrolysis of ATP at an unoccupied site could then bring about the allosteric rearrangement required to instigate the final folding step and release of actin. Alternatively, the release process could be dependent on the dissociation rate of AMP-PNP and subsequent binding of ATP.
The folding of actin by CCT is undoubtedly an intricate process and is likely to be composed of many further rearrangements before the native actin monomer can be released, and more work is required to characterize the elaborate folding pathway of actin and the contribution of cofactors such as PLP2p. Here we have shown evidence that an actin folding intermediate can be trapped within a functional folding cycle, elucidating the importance of the packing of the C-terminal of actin as a final step in the folding process to ensure release of native actin from CCT.
Footnotes
- PLP2p
- phosducin-like protein 2
- Acryl
- acrylodan
- 488Act1
- yeast actin with Alexa Fluor 488
- ActA
- rabbit skeletal muscle α-actin
- AMP-PNP
- adenylyl imidodiphosphate
- CCT
- chaperonin containing TCP1
- LDAO
- lauryldimethylamine oxide
- TCEP
- Tris(2-carboxyethyl)phosphine hydrochloride.
REFERENCES
- 1. Otterbein L. R., Graceffa P., Dominguez R. (2001) Science 293, 708–711 [DOI] [PubMed] [Google Scholar]
- 2. Altschuler G. M., Klug D. R., Willison K. R. (2005) J. Mol. Biol. 353, 385–396 [DOI] [PubMed] [Google Scholar]
- 3. Dekker C., Stirling P. C., McCormack E. A., Filmore H., Paul A., Brost R. L., Costanzo M., Boone C., Leroux M. R., Willison K. R. (2008) EMBO J. 27, 1827–1839 [DOI] [PMC free article] [PubMed] [Google Scholar]
- 4. Yam A. Y., Xia Y., Lin H. T., Burlingame A., Gerstein M., Frydman J. (2008) Nat. Struct. Mol. Biol. 15, 1255–1262 [DOI] [PMC free article] [PubMed] [Google Scholar]
- 5. Valpuesta J. M., Martín-Benito J., Gómez-Puertas P., Carrascosa J. L., Willison K. R. (2002) FEBS Lett. 529, 11–16 [DOI] [PubMed] [Google Scholar]
- 6. Stirling P. C., Srayko M., Takhar K. S., Pozniakovsky A., Hyman A. A., Leroux M. R. (2007) Mol. Biol. Cell 18, 2336–2345 [DOI] [PMC free article] [PubMed] [Google Scholar]
- 7. McCormack E. A., Altschuler G. M., Dekker C., Filmore H., Willison K. R. (2009) J. Mol. Biol. 391, 192–206 [DOI] [PubMed] [Google Scholar]
- 8. Altschuler G. M., Dekker C., McCormack E. A., Morris E. P., Klug D. R., Willison K. R. (2009) FEBS Lett. 583, 782–786 [DOI] [PubMed] [Google Scholar]
- 9. Vinh D. B., Drubin D. G. (1994) Proc. Natl. Acad. Sci. U.S.A. 91, 9116–9120 [DOI] [PMC free article] [PubMed] [Google Scholar]
- 10. Goode B. L. (2002) in Methods in Enzymology (Guthrie C., Fink G. R. eds) Vol. 351, pp. 433–441, Academic Press, San Diego, CA: [DOI] [PubMed] [Google Scholar]
- 11. Roy P., Rajfur Z., Jones D., Marriott G., Loew L., Jacobson K. (2001) J. Cell Biol. 153, 1035–1048 [DOI] [PMC free article] [PubMed] [Google Scholar]
- 12. Pappenberger G., McCormack E. A., Willison K. R. (2006) J. Mol. Biol. 360, 484–496 [DOI] [PubMed] [Google Scholar]
- 13. Weber G., Farris F. J. (1979) Biochemistry 18, 3075–3078 [DOI] [PubMed] [Google Scholar]
- 14. Marriott G., Zechel K., Jovin T. M. (1988) Biochemistry 27, 6214–6220 [DOI] [PubMed] [Google Scholar]
- 15. Shimon L., Hynes G. M., McCormack E. A., Willison K. R., Horovitz A. (2008) J. Mol. Biol. 377, 469–477 [DOI] [PubMed] [Google Scholar]
- 16. Yasunaga T., Wakabayashi T. (2001) J. Biochem. 129, 201–204 [DOI] [PubMed] [Google Scholar]
- 17. Llorca O., McCormack E. A., Hynes G., Grantham J., Cordell J., Carrascosa J. L., Willison K. R., Fernandez J. J., Valpuesta J. M. (1999) Nature 402, 693–696 [DOI] [PubMed] [Google Scholar]
- 18. Neirynck K., Waterschoot D., Vandekerckhove J., Ampe C., Rommelaere H. (2006) J. Mol. Biol. 355, 124–138 [DOI] [PubMed] [Google Scholar]
- 19. Altschuler G. M., Willison K. R. (2008) J. R. Soc. Interface 5, 1391–1408 [DOI] [PMC free article] [PubMed] [Google Scholar]
- 20. Grantham J., Ruddock L. W., Roobol A., Carden M. J. (2002) Cell Stress Chaperones 7, 235–242 [DOI] [PMC free article] [PubMed] [Google Scholar]
- 21. Larsson C., Nilsson A., Blomberg A., Gustafsson L. (1997) J. Bacteriol. 179, 7243–7250 [DOI] [PMC free article] [PubMed] [Google Scholar]
- 22. Llorca O., Martín-Benito J., Grantham J., Ritco-Vonsovici M., Willison K. R., Carrascosa J. L., Valpuesta J. M. (2001) EMBO J. 20, 4065–4075 [DOI] [PMC free article] [PubMed] [Google Scholar]
- 23. McCormack E. A., Llorca O., Carrascosa J. L., Valpuesta J. M., Willison K. R. (2001) J. Struct. Biol. 135, 198–204 [DOI] [PubMed] [Google Scholar]
- 24. Villebeck L., Persson M., Luan S. L., Hammarström P., Lindgren M., Jonsson B. H. (2007) Biochemistry 46, 5083–5093 [DOI] [PubMed] [Google Scholar]


