Abstract
The organic anion transporters OAT1 (SLC22A6, originally identified by us as NKT) and OAT3 (SLC22A8) are critical for handling many toxins, metabolites, and drugs, including antivirals (Truong, D. M., Kaler, G., Khandelwal, A., Swaan, P. W., and Nigam, S. K. (2008) J. Biol. Chem. 283, 8654–8663). Although microinjected Xenopus oocytes and/or transfected cells indicate overlapping specificities, the individual contributions of these transporters in the three-dimensional context of the tissues in which they normally function remain unclear. Here, handling of HIV antivirals (stavudine, tenofovir, lamivudine, acyclovir, and zidovudine) was analyzed with three-dimensional ex vivo functional assays using knock-out tissue. To investigate the contribution of OAT1 and OAT3 in various nephron segments, the OAT-selective fluorescent tracer substrates 5-carboxyfluorescein and 6-carboxyfluorescein were used. Although OAT1 function (uptake in oat3−/− tissue) was confined to portions of the cortex, consistent with a proximal tubular localization, OAT3 function (uptake in oat1−/− tissue) was apparent throughout the cortex, indicating localization in the distal as well as proximal nephron. This functional localization indicates a complex three-dimensional context, which needs to be considered for metabolites, toxins, and drugs (e.g. antivirals) handled by both transporters. These results also raise the possibility of functional differences in the relative importance of OAT1 and OAT3 in antiviral handling in developing and mature tissue. Because the HIV antivirals are used in pregnant women, the results may also help in understanding how these drugs are handled by developing organs.
Keywords: Anion Transport, Confocal Microscopy, Development, Mouse, Xenobiotics, Fluorescent Tracers, Function Localization, Knock-out Tissues, OAT1/OAT3
Introduction
Organic anion transporters (OATs)2 are widely distributed across epithelia of multiple organs and are responsible for the handling and excretion of a diverse array of xenobiotics as well as endogenous metabolites. Among the former are commonly used drugs such as penicillins, nonsteroidal anti-inflammatory drugs, diuretics, and various antivirals (1–3). oat1, initially identified by us as nkt (novel kidney transporter) (1–4), and oat3, initially identified as roct (5, 6), are two major transporters belonging to the SLC22 family of solute carriers, and along with other SLC transporter families (e.g. organic anion-transporting polypeptides and SLC21) as well as members of the ATP-binding cassette (ABC) transporter family, they are implicated in the renal secretion of drugs. However, it is OAT1 and OAT3, which are both located on the basolateral membrane of the proximal renal tubule, that are primarily responsible for renal uptake and are therefore likely to play rate-limiting roles in regulating the distribution of drugs, toxins, and metabolites between blood and urine. However, most studies have been performed using simple in vitro systems, and many unanswered questions remain about the function at the level of the whole organ. Moreover, it has been suggested that “remote sensing and signaling” occur between oat homologs in multiple tissues/organs and fluid compartments (e.g. blood and urine) via organic anion metabolites and/or signaling molecules (1, 7, 8).
OAT-mediated tubular accumulation of some drugs, including certain antivirals, can result in nephrotoxicity (9). Detailed functional information concerning kidney transporters present at the blood-urine barrier is crucial for understanding the nephrotoxicity of these antivirals and would help advance the development of new therapeutics. Data on compartmentalization of antivirals between blood and urine could also help provide a systemic view of antiviral distribution, elimination, and toxicity. This type of analysis has not been attempted due to a paucity of techniques to address the role of specific genes in three-dimensional contexts.
Previous studies on antivirals have concluded that OAT1 and, to a lesser extent, OAT3 play a major role in transport of antiviral drugs such as adefovir, cidofovir, and tenofovir. For example, OAT1 has been shown to be the major transporter for adefovir (10, 11), whereas an equal contribution to the transport of tenofovir by OAT1 and OAT3 was reported by another group (12). The interaction of OAT1 and OAT3 with a larger set of antivirals has also been investigated in vitro (3, 13).
Analyses of specific OATs in the three-dimensional context of the adult and developing kidneys are critical for understanding the distribution of antivirals between blood and urine. We therefore studied the interaction of the OATs with stavudine, tenofovir, lamivudine, acyclovir, and zidovudine in three-dimensional systems for adult and embryonic kidneys from oat1 and oat3 knock-outs (13–15). This enabled us to isolate the contribution of each transporter. Moreover, a novel visualization approach for fluorescent organic anion uptake in adult renal slices provided information on the functional localization of the OATs that functionally establishes the likely contributions of particular nephron segments to drug and toxin transport. The results also raise the possibility of different OATs being important in antiviral handling at different developmental stages.
EXPERIMENTAL PROCEDURES
Materials
Water-soluble probenecid was purchased from Molecular Probes. The fluorescent tracers 5-carboxyfluorescein (5CF) and 6-carboxyfluorescein (6CF) and tetramethylrhodamine isothiocyanate (TRITC)-conjugated lectins (Dolichos biflorus lectin and Lotus lectin) were obtained from Sigma. Antivirals (stavudine, lamivudine, tenofovir, zidovudine, and acyclovir) were purchased from either Moravek Biochemicals (Brea, CA) or Sigma.
Adult Renal Slice Uptake Assay and Imaging
Kidneys from adult wild type and oat1 and oat3 knock-outs were dissected and maintained in 4 °C L-15 medium until coronal 0.2-mm slices were cut with a Stadie-Riggs microtome (14). Slices were maintained in PBS at 4 °C, and symmetrical pieces were then selected and placed in 24-well plates containing minimal saline with either 1 μm 5CF or 1 μm 6CF along with either TRITC-conjugated D. biflorus or Lotus lectin and in the presence of either PBS or an inhibitor (probenecid (2 mm), stavudine (1 mm), acyclovir (200 μm), tenofovir (100 μm), zidovudine (100 μm), or lamivudine (200 μm)). Slices were incubated at 25 °C for 1 h and then washed three times with PBS before being placed on a slide with Fluoromount and imaged with a Nikon D-Eclipse C1 confocal microscope (A. G. Heinze, Lake Forest, CA).
Organ Culture Uptake Assay and Imaging
Embryonic kidneys from embryonic day 13.5 oat1 and oat3 knock-outs were cultured for 4 days at 37 °C in DMEM/F-12 with 10% FBS and 1% penicillin/streptomycin as described previously (3).On day 4 of culture, the cultures (n = 3) were washed once with PBS containing CaCl2 (0.1 mm) and MgCl2 (1 mm) at room temperature. 1 μm 6CF was added to each well, and cultures were incubated (in the dark) with or without probenecid (2 mm), stavudine (1 mm), acyclovir (200 μm), tenofovir (100 μm), zidovudine (100 μm), and lamivudine (200 μm). Cultured kidneys were washed four to five times with PBS (containing CaCl2 and MgCl2) and imaged. Images were obtained by confocal microscopy. Knock-outs and wild types were generated as described previously (14, 15). Knock-outs were back-crossed to C57BL/6J for seven generations for oat1 (Deltagen, Inc., Redwood City, CA) and for four generations for oat3.
Embryonic day 13.5 (oat1 and oat3 knock-out (KO)) tissue was used for embryonic kidney culture, followed by the assays described below (13). Experiments on adult renal slices were performed on tissue from age-matched adult non-pregnant female oat1 and oat3 knock-outs between 12 and 20 weeks of age.
Quantitative Image Analysis
Images were taken at ×4 magnification. The kidney was outlined, and pixel intensities were measured with NIH Image J software as described previously (3).
Microarray Data: Expression of Transporters in oat3 Knock-outs
As described previously (16), gene expression profiling in oat3 KO kidney was carried out using Affymetrix mouse GeneChip 230 according to the manufacturer's specification.
RESULTS
To begin to understand the relative contribution of OAT1 and OAT3 to antiviral handling in different tissues regulating the blood-urine interface, we employed three-dimensional assays utilizing wild-type and knock-out kidneys. Two kinds of three-dimensional ex vivo kidney assays were used: adult kidney slices and cultured whole embryonic kidney (which is allowed to differentiate in vitro). The latter has the considerable advantage of being a “live” assay in that the tissue continues to grow for ∼2–3 weeks.
Functional Localization of OAT1 (in oat3 KOs) and OAT3 (in oat1 KOs) in Adult Kidney Using Fluorescent Tracers
A “classic” assay for analyzing transport in the adult kidney is the use of renal tissue slices, but this assay is not well validated for the determination of OAT1- and OAT3-specific transport. In fact, current data are contradictory. Although some studies suggest that this process occurs primarily in the proximal tubule, other immunolocalization data suggest that oat expression beyond this part of the nephron includes even the collecting ducts, a notion that does not have much physiological support (17). The functional consequence of the localization of OAT1 and OAT3 transport has not been previously established. This is obviously important for designing combination therapies, like those employing multiple antivirals as in HIV therapy, where competition at the transport step may be an important consideration. In addition, the increasing problem of drug-induced nephrotoxicity further illustrates the importance of understanding the molecular interaction between the transporters in the kidney and antivirals.
To functionally define the relative contribution of OAT1 (in oat3 KOs) and OAT3 (in oat1 KOs) transporters to antiviral handling, as well as which nephron segments are involved, we determined the uptake patterns of the fluorescent OAT substrates 6CF and 5CF (3) in adult kidney slices from the wild type and oat1 and oat3 KOs. The use of these fluorescent substrates to study OAT1 and OAT3 uptake is well established (3, 8). This method allows for the direct visualization of transport and the anatomical localization of OAT function.
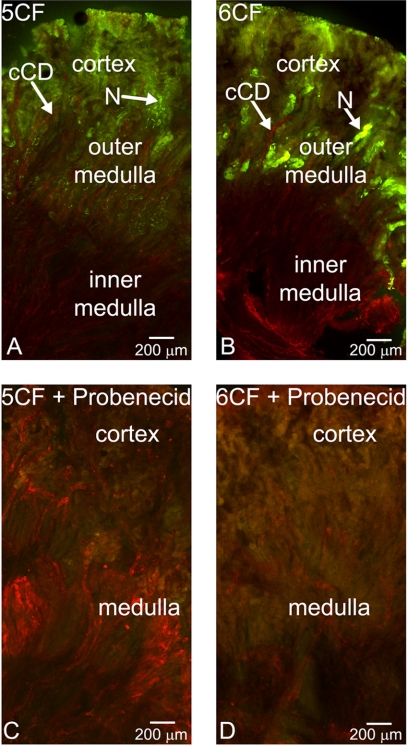
Initially, we assessed CF uptake in fresh renal slices (coronal sections) from WT adults. These assays revealed discrete fluorescence throughout the cortex of the kidney (Fig. 1, A and B), with only background fluorescence in the outer medullary stripe for both 5CF and 6CF. Co-staining with D. biflorus lectin, a lectin that binds to collecting ducts (18, 19), demonstrated, importantly, a lack of CF uptake in collecting duct rays of the inner medulla as well those of the cortical collecting ducts. Inhibition of CF uptake by 2 mm probenecid confirmed OAT-mediated transport (Fig. 1, C and D). Interestingly, the cortical fluorescence patterns of 5CF and 6CF uptake were distinct. 5CF showed uptake throughout the cortical tubule, whereas 6CF manifested discrete areas of uptake in the juxtamedullary portion of the cortex, consistent with proximal tubule localization (Fig. 1, A and B). Given the differences in the kinetics of these tracers with respect to OAT1 and OAT3 (3), the different fluorescence patterns observed are likely to reflect true differences in the functional transport by OAT1 and OAT3.
FIGURE 1.
Fluorescent organic anion tracer uptake in adult WT kidney slices. A–D, photomicrographs of coronal sections of WT adult kidney stained with D. biflorus lectin (red). Shown are the results from the examination of the OAT-mediated uptake of the fluorescent tracers (green) 5CF (1 μm) (A and C) and 6CF (1 μm) (B and D) in the absence (A and B) and presence (C and D) of 2 mm probenecid. cCD, cortical collecting duct; N, nephron. Scale bar = 200 μm.
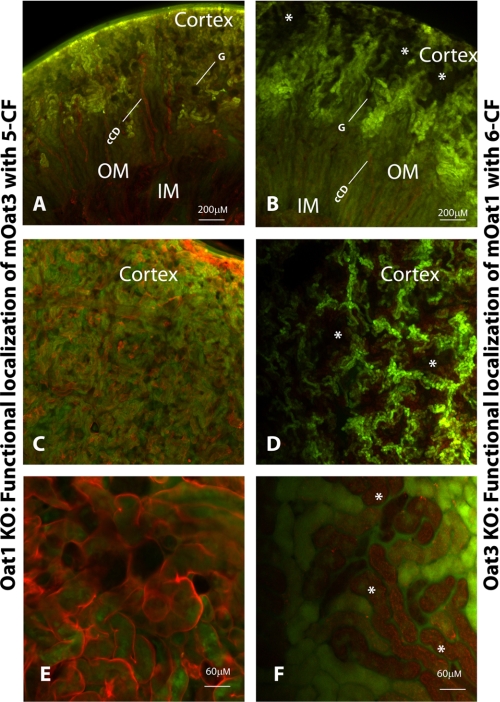
To directly determine the intrarenal location of OAT3 function, we used renal slices from oat1 knock-outs. As we show below, these knock-outs do not exhibit significant gene expression changes in ABC and SLC transporters other than the oat knock-outs studied here. Because we are studying probenecid-inhibitable uptake, it is unlikely that the effects were OAT-independent. Two types of slices were generated: first, a coronal cut to delineate the uptake differences between the cortex, outer medulla, inner medulla, and pelvis; and second, a shallow coronal cut through just the cortex to determine the intracortical location of CF accumulation. As expected, loss of OAT1 eliminated the differences between 5CF and 6CF uptake (data not shown), indicating that either could be used to assess OAT3-mediated transport. The results of 5CF uptake in oat1 KOs (function of OAT3) are summarized in Fig. 2 (A, C, and E). No probenecid-sensitive uptake was seen in either the inner or outer medulla or renal pelvis; furthermore, D. biflorus lectin co-staining (Fig. 2A) showed that cortical collecting ducts also did not accumulate CF. However, as revealed by co-staining with Lotus lectin (Fig. 2, C and E), which preferentially binds to the mesenchymally derived nephron, proximal and distal tubules throughout the cortex accumulated significant cellular levels of CF, which was competed by probenecid. Circular gaps in the uptake pattern in the cortex resembled glomeruli in shape and location. These results suggest that OAT3 function is present in distal as well as proximal tubules (but not in glomeruli or collecting ducts).
FIGURE 2.
Localization of fluorescent tracer 5CF in oat1 knock-out and fluorescent tracer 6CF in oat3 knock-out as a function of OAT3 and OAT1, respectively. Photomicrographs show coronal sections of adult kidney from oat1 KOs (A, C, and E) and OAT3 KOs (B, D, and F). A, C, and E, examination of 5CF uptake (green) in adult oat1 KOs co-stained with either D. biflorus lectin (red) (A) or Lotus lectin (red) (C and E). B, D, and F, examination of 6CF uptake (green) in adult oat3 KOs co-stained with either D. biflorus lectin (red) (B) or Lotus lectin (red) (D and F). cCD, cortical collecting duct; G, glomerulus; OM, outer medulla; IM, inner medulla. The asterisks indicate occlusions in the pattern of tracer uptake. mOat, mouse OAT. Scale bars = 200 μm in A–D and 60 μm in E and F.
Similarly, the location of OAT1 function was determined using renal slices from the oat3 knock-outs. As in oat1 KOs, both 5CF and 6CF exhibited similar patterns. Both coronal and shallow cortex sections were exposed to 6CF (the preferred OAT1 substrate (3)) (Fig. 2, B, D, and F). No probenecid-sensitive accumulation was seen in the medulla, renal pelvis, cortical collecting ducts, or presumptive glomeruli. Notably, probenecid-inhibitable uptake was seen in distinct patches in the cortex, similar to the pattern seen in wild-type slices incubated with 6CF (Fig. 2D).
In the shallow coronal slice, uptake was seen in a grid-like pattern (Fig. 2D), with rectangular regions (“occlusions”) lacking uptake. Higher magnification revealed distinct tubules with or without OAT function (Fig. 2F). These results suggest that OAT1 is functionally sequestered into a distinct tubule type, consistent with proximal tubule localization. Importantly, this implies that OAT1- and OAT3-mediated transport is anatomically and functionally distinct. These results appear to be the first demonstration of the distribution of transport within the context of the whole organ and have broad implications for understanding system-wide drug, toxin, and metabolite handling. These considerations are particularly important for the design of combination antiviral therapies because in vitro oocyte transport data show that antivirals can be transported by OAT1, OAT3, or both (3).
Interaction of Antivirals with OAT3 (in oat1 KOs) and OAT1 (in oat3 KOs) in Adult Kidney Slices
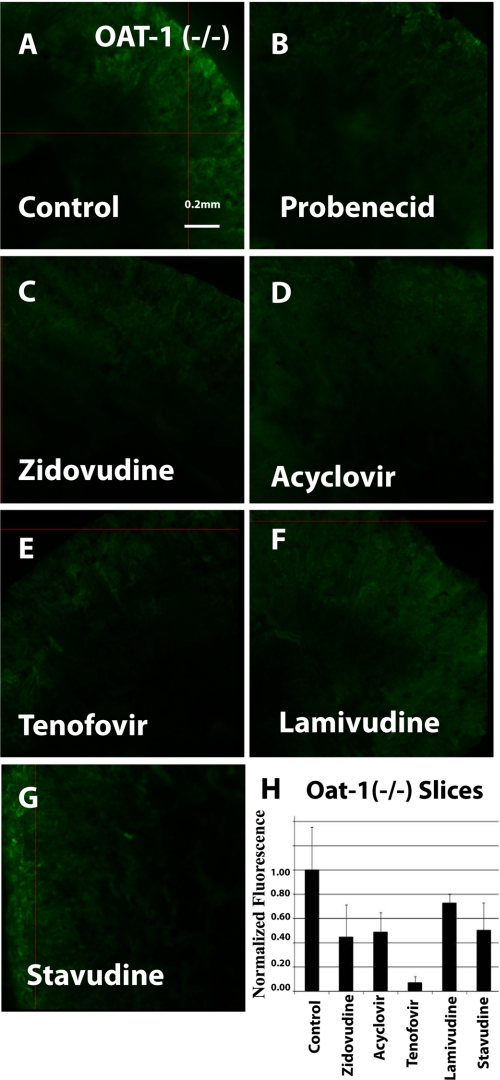
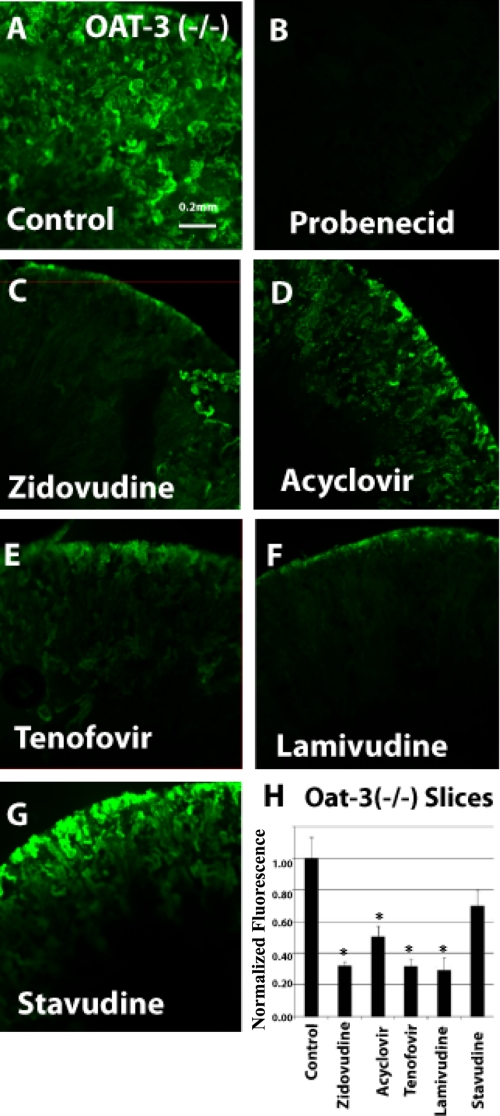
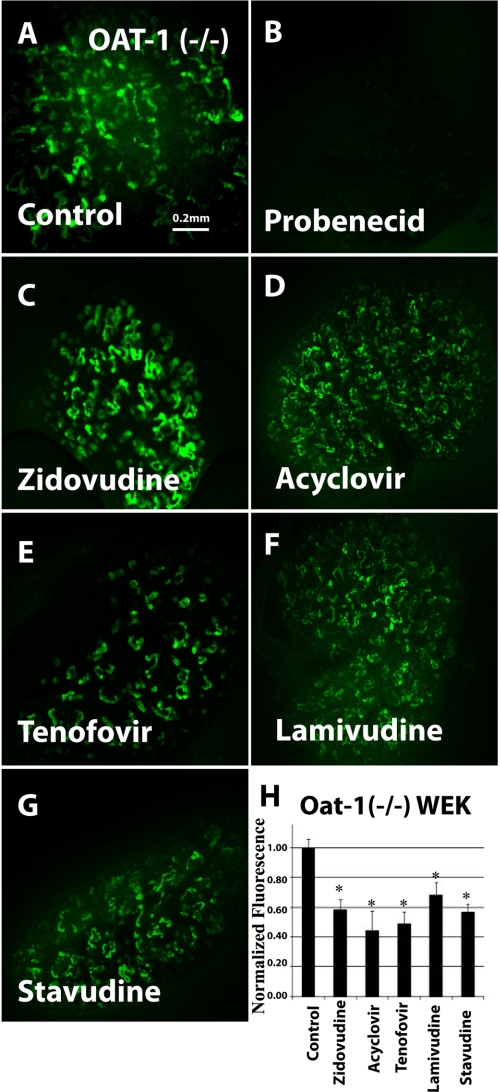
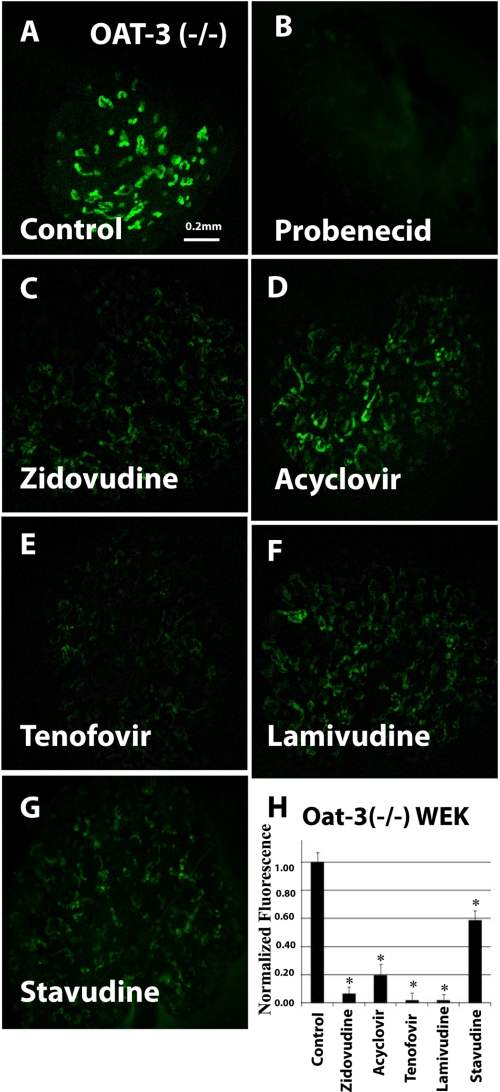
Having established 5CF and 6CF uptake in renal slices as a novel ex vivo method of examining OAT-mediated transport, we developed the method further by utilizing a competitive assay between antivirals and 6CF. The reductions in signal were normalized against CF uptake alone and probenecid inhibition. As described above, tissues from the oat KO animals were used to distinguish OAT1- and OAT3-mediated transport. OAT3-specific (in oat1 KOs) and OAT1-specific (in oat3 KOs) uptake of 6CF (1 μm) was tested in adult renal slices (Figs. 3 and 4).
FIGURE 3.
Inhibition of 6CF uptake by antivirals in oat1 knock-out adult kidney slices (function of the OAT3 transporter). Fluorescent photomicrographs show 6CF (1 μm) uptake (green) in adult oat1 KO kidney slices in the presence of a vehicle control (A), 2 mm probenecid (B), 100 μm zidovudine (C), 200 μm acyclovir (D), 100 μm tenofovir (E), 200 μm lamivudine (F), and 1 mm stavudine (G). Images are representative of triplicate slices from the same experiment. The bar graph (H) shows relative fluorescent signal strength derived from quantitative image analysis of 6CF in adult oat1 KO kidney slices. Scale bar = 0.2 mm.
FIGURE 4.
Inhibition of 6CF uptake by antivirals in oat3 knock-out adult kidney slices (function of the OAT1 transporter). Fluorescent photomicrographs show 6CF (1 μm) uptake (green) in adult oat3 KO kidney slices in the presence of a vehicle control (A), 2 mm probenecid (B), 100 μm zidovudine (C), 200 μm acyclovir (D), 100 μm tenofovir (E), 200 μm lamivudine (F), and 1 mm stavudine (G). The bar graph (H) shows relative fluorescent signal strength derived from quantitative image analysis of 6CF absorption in adult oat3 KO kidney slices. Scale bar = 0.2 mm. *, p < 0.05.
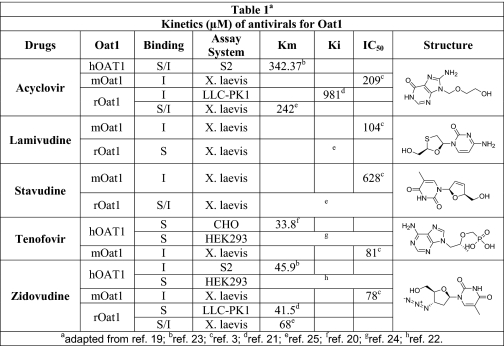
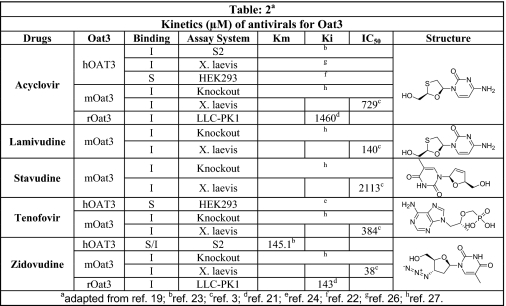
Binding was demonstrated in oat1 knock-out kidneys (function of the OAT3 transporter) in the presence of zidovudine (100 μm) (Fig. 3, C and H), acyclovir (200 μm) (Fig. 3, D and H), tenofovir (100 μm) (Fig. 3, E and H), lamivudine (200 μm) (Fig. 3, F and H), and stavudine (1 mm) (Fig. 3, G and H). Similarly, blocking of fluorescence uptake in oat3 knock-out slices (function of the OAT1 transporter) (Fig. 4, C–H) was tested and compared in the presence of the antivirals at the same concentrations as for oat1 knock-out slices (function of the OAT3 transporter). The antivirals were tested in adult and embryonic kidneys at concentrations similar to IC50 values gathered from the Xenopus oocyte data (Table 1 (3, 20–26) and Table 2 (3, 16, 21–25)).
TABLE 1.
Kinetics (μm) of antiviral drugs for OAT1 (literature-based compilation of data)
Kinetic parameters (Km, Ki, and IC50) for antiviral drugs in mouse (m), rat (r), and human (h) OAT1 were analyzed in different in vitro assay systems. The individual structures of antiviral drugs are also shown. I, inhibition; S, substrate; S2, cell line from the second segment of the proximal tubule; LLC-PK1, pig renal epithelial cell; CHO, Chinese hamster ovary cells; HEK293, human embryonic kidney cell line; X. laevis, Xenopus laevis oocytes. See references below for details.
TABLE 2.
Kinetics (μm) of antiviral drugs for OAT3 (literature-based compilation of data)
Kinetic parameters (Km, Ki, and IC50) for antiviral drugs in mouse (m), rat (r), and human (h) OAT3 were analyzed in different in vitro assay systems. The individual structures of antiviral drugs are also shown. I, inhibition; S, substrate; S2, cell line from the second segment of the proximal tubule; LLC-PK1, pig renal epithelial cell; CHO, Chinese hamster ovary cells; HEK293, human embryonic kidney cell line; X. laevis, X. laevis oocytes. See references below for details.
Inhibition of 6CF tracer uptake by the antivirals was similar in oat1 and oat3 KO renal slices (Figs. 3 and 4). Except for tenofovir (Fig. 3E), which inhibited uptake by >90% in oat1 KO slices (function of the OAT3 transporter) (Fig. 3), all of the antivirals in oat1 (function of OAT3) and oat3 (function of OAT1) knock-out slices (Figs. 3 and 4, respectively) manifested moderate inhibition of 6CF tracer uptake in the 30–70% range.
Interaction of Antivirals with OAT1 and OAT3 in Organ Culture
We previously established organ culture of whole embryonic kidney as a novel model for the analysis of organic anion transporter function (3, 13). These cultures, which alter with period of differentiation, express both OAT1 and OAT3 and manifest significant uptake of OAT substrates, including the fluorescent organic anions 5CF and 6CF, with this uptake being inhibitable by the classic OAT inhibitor probenecid. Moreover, the individual contribution of either OAT (OAT1 or OAT3) in isolation has also been studied by performing experiments in kidney organ cultures derived from mice null for the other OAT (transport of OAT substrates in oat1 knock-out tissue should be largely due to OAT3 and vice versa) (3). In this study, we used the oat knock-out kidney organ culture assay to analyze antiviral interactions with OAT1 and OAT3. When tested in oat1 KO-derived tissues (function of OAT3), the uptake of 1 μm 6CF (Fig. 5A) was blocked by 2 mm probenecid (Fig. 5, B and H) and, to a varying degree, by the five antivirals: zidovudine (100 μm) (Fig. 5, C and H), acyclovir (200 μm) (Fig. 5, D and H), 100 μm tenofovir (100 μm) (Fig. 5, E and H), lamivudine (200 μm) (Fig. 5, F and H), and stavudine (1 mm) (Fig. 5, G and H). Similarly, tracer uptake by cultured kidneys derived from oat3 knock-outs (function of OAT1) was also inhibited by the antivirals (Fig. 6, A–H). Thus, our results suggest that these antivirals interact with OAT1 and OAT3 transporters in the cultured embryonic kidneys from the knock-out tissues.
FIGURE 5.
Inhibition of 6CF uptake by antivirals in cultured oat1 knock-out embryonic kidneys in organ culture (function of OAT3). Fluorescent photomicrographs show 6CF (1 μm) uptake in cultured oat1 knock-out embryonic kidneys in the presence of a vehicle control (A), 2 mm probenecid (B), 100 μm zidovudine (C), 200 μm acyclovir (D), 100 μm tenofovir (E), 200 μm lamivudine (F), and 1 mm stavudine (G). Images are representative of triplicate embryonic kidney cultures. The bar graph (H) shows relative fluorescent signal strength of 6CF in cultured embryonic kidneys derived from quantitative image analysis. WEK, whole embryonic kidney. Scale bar = 0.2 mm. *, p < 0.05.
FIGURE 6.
Inhibition of 6CF uptake by antivirals in cultured oat3 knock-out embryonic kidneys in organ culture (function of OAT1). Fluorescent photomicrographs show 6CF (1 μm) uptake in cultured oat3 knock-out embryonic kidneys in the presence of a vehicle control (A), 2 mm probenecid (B), 100 μm zidovudine (C), 200 μm acyclovir (D), 100 μm tenofovir (E), 200 μm lamivudine (F), and 1 mm stavudine (G). The bar graph (H) shows relative fluorescent signal strength of 6CF absorption in cultured embryonic kidneys derived from quantitative image analysis. WEK, whole embryonic kidney. Scale bar = 0.2 mm. *, p < 0.05.
However, the degree of antiviral inhibition was much greater for 6CF tracer uptake in oat3 KO (function of the OAT1 transporter) kidney organ cultures (Fig. 6) than for that in oat1 KO kidney organ cultures (Fig. 5), representing OAT3-mediated interaction. Although all five antivirals could inhibit OAT3-mediated 6CF interaction (oat1 KO cultures) by ∼50%, tenofovir, lamivudine, and zidovudine inhibited OAT1-mediated transport (oat3 KO kidney organ cultures) by >90% (Fig. 5, E, F, and C, respectively), whereas acyclovir inhibited it by >80% (Fig. 5D). Stavudine was the only compound for which inhibition of transport was comparable in oat1 and oat3 KO kidney organ cultures (Figs. 5G and 6G). These findings suggest a greater affinity of antivirals for OAT1 than for OAT3 in the embryonic kidney. Additionally, it is clear that there are significant differences between the adult and embryonic kidney three-dimensional assays. These differences, which may be clinically important, could be due to variations in post-translational modifications and might also represent tissue- and/or developmental stage-specific modulation of OAT function.
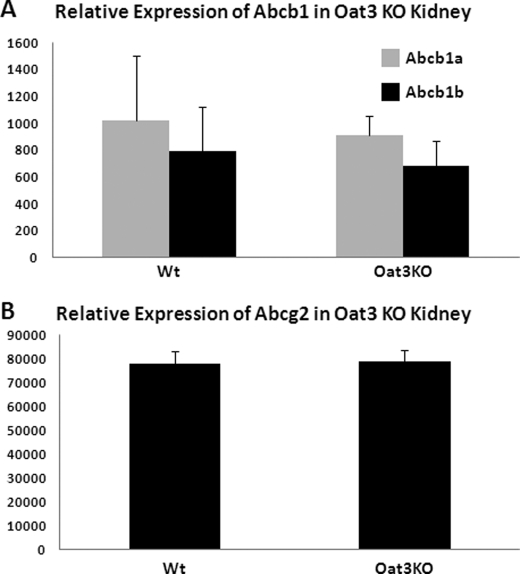
Although the fluorescent substrate 5CF could also be handled by other transporters (including ABCC2 (MRP2), ABCC4 (MRP4), MRP5, ABCG2, and ABCB1 (P-glycoprotein)), these proteins are expressed, however, on the luminal (apical) surface of renal tubular cells. Although they could possibly have an effect on the overall handling of the drug, they would not be expected to be probenecid-sensitive, and furthermore, we have supported our findings in knock-out tissue. The basolateral import transporters (OAT1 and OAT3) seem to determine the rate-limiting step in the clearance of organic anionic drugs from the blood, across the tubule, and into the urine. Additionally, we previously published a study reporting the expression profiles of abcc2 (mrp2) and abcc4 (mrp4) in oat1 and oat3 knock-out mice in comparison with wild-type mice (16). The expression of these transporters was not significantly altered by the deletion of either oat1 or oat3. We have extended these results to include abcb1 and abcg2 in oat3 knock-outs (Fig. 7). The renal expression of these transporters was also not significantly altered in oat3 knock-outs in the same microarray analysis. However, it is evident from the expression data reported (16) that the expression of oat1 was reduced by 40% in the oat3 knock-out, and conversely, oat3 expression was reduced by 40% in the oat1 knock-out. This is perhaps a consequence of the oat1 and oat3 genes being located adjacent to each other. It is important to note that, despite the observed change in transcription, the renal transport of OAT1 substrate in the oat3 knock-out and the renal transport of OAT3 substrate in the oat1 knock-out were unaffected. Therefore, the change in RNA levels did not appear to be reflected in a functional difference in transport in the intact animal.
FIGURE 7.
Expression data in oat3 knock-out mice showing renal expression of ABCB1 and ABCG2. Gene expression profiling in oat3 knock-out kidney using Affymetrix mouse GeneChip 230 was performed (16), and the expression levels of ABCB1 (A) and ABCG2 (B) were determined.
DISCUSSION
OAT1 (initially identified by us as NKT (4)) is the prototypical organic anion transporter and, along with OAT3, is considered a primary component of the classic renal excretion pathway. OAT1 was initially proposed to be either an organic anion transporter or an organic cation transporter (4), and it is now clear that OAT1 and OAT3 can be both, although organic anions remain the preferred substrates. Both of these major transporters are located on the basolateral membrane of the renal epithelial tubule and account for the rate-limiting step in the excretion of many drugs from the blood into urine. Together, these two OATs initiate the vectorial movement of organic anions across the proximal tubular cell by taking them up from the blood. Meanwhile, MRP, ABCG2, and other transporters, located on the luminal (apical) side of the cell, are responsible for excretion. Thus, the overall distribution of substrates between blood and urine is the result of the coordinated activities of both apical and basolateral localized transporters. However, it is generally accepted that uptake via OAT1 and OAT3 is the rate-limiting step for most organic anion drugs transversing this pathway (1).
Most of the current data come from in vitro transport experiments in microinjected frog oocytes. How drugs, toxins, and metabolites distribute into different body compartments and the rate-limiting pathways involved are a major biochemical, physiological, and pharmacological problem. Moreover, little is known about the interplay between multiple fluid compartments, such as blood and urine, and the role of OAT isoforms, given overlapping substrate specificities, in the distribution and elimination of drugs, toxic compounds, and metabolites (7). Indeed, it has been proposed that OATs and other drug transporters are part of a systemic remote sensing and signaling network (1, 7, 8).
Here, we have used novel approaches employing oat1 and oat3 knock-out tissues (to assess OAT3 and OAT1 function, respectively) (14, 15) to analyze, in a three-dimensional context, the rate-limiting pathways involved in the handling of antivirals used in cases of HIV infection and proposed for use for small pox prophylaxis. As discussed below, the results not only define the transporter (OAT1 or OAT3) preferences in a three-dimensional context, they provide the first functional evidence that although OAT1 and OAT3 overlap in the proximal tubule, there is major OAT3 activity distally. These pathways govern the distribution of antivirals between blood and urine. The issue is important not only from the perspective of treatment but also toxicity. For example, drug-induced nephrotoxicity is a significant problem in hospitalized patients. In the case of HIV patients, low-level antiviral drug-induced nephrotoxicity is increasingly reported (27). Most of the nucleoside reverse transcriptase inhibitor antivirals have nephrotoxic side effects, which can be potentiated in patient groups (such as HIV patients) who are treated with a combination of these antiviral therapies.
Because renal excretion plays a major role in the elimination of these drugs, the kidney is routinely exposed to high concentrations of these antivirals and their metabolites. Accumulation and toxicity of drugs and metabolites are influenced by specific transport pathways that lead to site-specific toxicity in the nephron. Thus, the identification of the key transporters for individual antivirals could be crucial to understanding the pathophysiology of the nephrotoxicity due to these compounds when used alone or in combination. Furthermore, the use of fluorescent tracers as described here allows for spatial/anatomical demarcation of the domains of OAT function (as proximal for OAT1 and both proximal and distal for OAT3), enabling one to examine patterns of organic anion transport in the context of the native intrarenal environment. This functional knowledge is crucial for devising combination therapies so that they do not compete for OAT-mediated transport during renal elimination or for avoiding further toxicity to the same segment of the renal tubule.
Previous immunolocalization studies have been somewhat discrepant. For example, it was shown that human OAT1 and OAT3 expression is concentrated in the proximal tubules of the adult kidney (28). On the other hand, although localization of rat OAT1 has been reported in a manner consistent with proximal tubules (4), rat OAT3 has also been localized to connecting tubules and cortical and medullary collecting ducts (17). However, the differential expression pattern of the two oat isoforms, not to mention differential functional expression, has been far from clear. This study provides the first clear functional evidence. We determined uptake of the fluorescent OAT substrates 6CF and 5CF in adult kidneys from the wild type and oat1 (function of OAT3 transport) and oat3 (function of OAT1 transport) KOs as a novel method for the direct visualization of the anatomical domains of OAT function. D. biflorus and Lotus lectins were used to differentiate the collecting duct system (D. biflorus lectin-positive) from the tubular structures (Lotus lectin-positive) to identify the functional localization of OAT1 (in oat3 KOs) and OAT3 (in oat1 KOs). The results indicate that although localization of both OATs was specific to the tubular portions of the nephron, the patterns of OAT1 function appeared distinct from those of OAT3 function. The latter (OAT3) was localized in both proximal and distal tubules, whereas the former (OAT1) was more proximal tubule-specific. No uptake of 6CF or 5CF was detected in the glomeruli or the collecting duct system, indicating that, in contrast to what was suggested by certain immunolocalization studies (17), functional localization is restricted to the tubular portions of the nephron. Although the generation of an oat1/oat3 double knock-out would be useful in further evaluating the function of transporters, this has so far been difficult because these two genes are separated by only 8 kb on chromosome 19.
It is well established that oat expression dramatically increases during late renal development and then again after birth (13), and although oat1 and oat3 are expressed primarily in the kidney, they are also expressed in other barrier epithelial tissues. Because the perinatal period represents a critical environmental transition, the marked up-regulation of renal oat genes after birth seems consistent with the need to adjust the homeostasis. Perhaps this reflects shifting transport and elimination, which were handled prenatally by the placenta, to the kidney, postnatally. In addition, the immature organs of the premature infant are often exposed to drugs in intensive care units and other settings.
Because antiviral therapy in pregnancy (e.g. maternal HIV) is also a potential issue (29), we investigated the interaction of the aforementioned antivirals with OATs in embryonic kidney organ cultures from oat1 and oat3 knock-outs. An interesting finding is that the developing and adult kidneys may utilize different OATs for antiviral handling: the data suggest a predominant role for OAT1 (as compared with OAT3) in interaction with antivirals (with the exception of stavudine) in the developing kidney, but this difference may not be present in the adult kidney. This possibly reflects developmental stage-specific regulation of oat-mediated transport (4, 13). These data also suggest that use of oat-transported antivirals should be further evaluated in pregnant women because of the theoretical possibility of fetal nephrotoxicity.
Acknowledgments
We thank Dr. Sharon Tracy and Megan Bettilyon for manuscript assistance. We also gratefully acknowledge the expert assistance and helpful discussions with Dr. Kevin Bush.
This work was supported, in whole or in part, by National Institutes of Health Grants AI057695, DK079784, and GM88824 (to S. K. N.) and HL094728 (to S. A. E.). This work was also supported by a postdoctoral fellowship from the Society of Toxicology and Colgate Palmolive (to A. V. D.).
- OAT
- organic anion transporter
- ABC
- ATP-binding cassette
- 5CF
- 5-carboxyfluorescein
- 6CF
- 6-carboxyfluorescein
- TRITC
- tetramethylrhodamine isothiocyanate
- KO
- knock-out.
REFERENCES
- 1. Nigam S. K., Bush K. T., Bhatnagar V. (2007) Nat. Clin. Pract. Nephrol. 3, 443–448 [DOI] [PubMed] [Google Scholar]
- 2. Sweet D. H. (2005) Toxicol. Appl. Pharmacol. 204, 198–215 [DOI] [PubMed] [Google Scholar]
- 3. Truong D. M., Kaler G., Khandelwal A., Swaan P. W., Nigam S. K. (2008) J. Biol. Chem. 283, 8654–8663 [DOI] [PMC free article] [PubMed] [Google Scholar]
- 4. Lopez-Nieto C. E., You G., Bush K. T., Barros E. J., Beier D. R., Nigam S. K. (1997) J. Biol. Chem. 272, 6471–6478 [DOI] [PubMed] [Google Scholar]
- 5. Pavlova A., Sakurai H., Leclercq B., Beier D. R., Yu A. S., Nigam S. K. (2000) Am. J. Physiol. Renal Physiol. 278, F635–F643 [DOI] [PubMed] [Google Scholar]
- 6. Sweet D. H., Chan L. M., Walden R., Yang X. P., Miller D. S., Pritchard J. B. (2003) Am. J. Physiol. Renal Physiol. 284, F763–F769 [DOI] [PubMed] [Google Scholar]
- 7. Ahn S. Y., Nigam S. K. (2009) Mol. Pharmacol. 76, 481–490 [DOI] [PMC free article] [PubMed] [Google Scholar]
- 8. Kaler G., Truong D. M., Khandelwal A., Nagle M., Eraly S. A., Swaan P. W., Nigam S. K. (2007) J. Biol. Chem. 282, 23841–23853 [DOI] [PMC free article] [PubMed] [Google Scholar]
- 9. Eraly S. A., Blantz R. C., Bhatnagar V., Nigam S. K. (2003) Curr. Opin. Nephrol. Hypertens. 12, 551–558 [DOI] [PubMed] [Google Scholar]
- 10. Servais A., Lechat P., Zahr N., Urien S., Aymard G., Jaudon M. C., Deray G., Isnard Bagnis C. (2005) Nephrol. Ther. 1, 296–300 [DOI] [PubMed] [Google Scholar]
- 11. Servais A., Lechat P., Zahr N., Urien S., Aymard G., Jaudon M. C., Deray G., Isnard Bagnis C. (2006) Eur. J. Pharmacol 540, 168–174 [DOI] [PubMed] [Google Scholar]
- 12. Ray A. S., Cihlar T., Robinson K. L., Tong L., Vela J. E., Fuller M. D., Wieman L. M., Eisenberg E. J., Rhodes G. R. (2006) Antimicrob. Agents Chemother. 50, 3297–3304 [DOI] [PMC free article] [PubMed] [Google Scholar]
- 13. Sweet D. H., Eraly S. A., Vaughn D. A., Bush K. T., Nigam S. K. (2006) Kidney Int. 69, 837–845 [DOI] [PMC free article] [PubMed] [Google Scholar]
- 14. Eraly S. A., Vallon V., Vaughn D. A., Gangoiti J. A., Richter K., Nagle M., Monte J. C., Rieg T., Truong D. M., Long J. M., Barshop B. A., Kaler G., Nigam S. K. (2006) J. Biol. Chem. 281, 5072–5083 [DOI] [PubMed] [Google Scholar]
- 15. Sykes D., Sweet D. H., Lowes S., Nigam S. K., Pritchard J. B., Miller D. S. (2004) Am. J. Physiol. Renal Physiol. 286, F972–F978 [DOI] [PubMed] [Google Scholar]
- 16. Vallon V., Eraly S. A., Wikoff W. R., Rieg T., Kaler G., Truong D. M., Ahn S. Y., Mahapatra N. R., Mahata S. K., Gangoiti J. A., Wu W., Barshop B. A., Siuzdak G., Nigam S. K. (2008) J. Am. Soc. Nephrol. 19, 1732–1740 [DOI] [PMC free article] [PubMed] [Google Scholar]
- 17. Kojima R., Sekine T., Kawachi M., Cha S. H., Suzuki Y., Endou H. (2002) J. Am. Soc. Nephrol. 13, 848–857 [DOI] [PubMed] [Google Scholar]
- 18. Laitinen L., Virtanen I., Saxén L. (1987) J. Histochem. Cytochem. 35, 55–65 [DOI] [PubMed] [Google Scholar]
- 19. Trifillis A. L. (1999) Exp. Nephrol. 7, 353–359 [DOI] [PubMed] [Google Scholar]
- 20. Cihlar T., Ho E. S., Lin D. C., Mulato A. S. (2001) Nucleosides Nucleotides Nucleic Acids 20, 641–648 [DOI] [PubMed] [Google Scholar]
- 21. Hasegawa M., Kusuhara H., Endou H., Sugiyama Y. (2003) J. Pharmacol. Exp. Ther. 305, 1087–1097 [DOI] [PubMed] [Google Scholar]
- 22. Tahara H., Shono M., Kusuhara H., Kinoshita H., Fuse E., Takadate A., Otagiri M., Sugiyama Y. (2005) Pharm. Res. 22, 647–660 [DOI] [PubMed] [Google Scholar]
- 23. Takeda M., Khamdang S., Narikawa S., Kimura H., Kobayashi Y., Yamamoto T., Cha S. H., Sekine T., Endou H. (2002) J. Pharmacol. Exp. Ther. 300, 918–924 [DOI] [PubMed] [Google Scholar]
- 24. Uwai Y., Ida H., Tsuji Y., Katsura T., Inui K. (2007) Pharm. Res. 24, 811–815 [DOI] [PubMed] [Google Scholar]
- 25. VanWert A. L., Gionfriddo M. R., Sweet D. H. (2010) Biopharm. Drug Dispos. 31, 1–71 [DOI] [PubMed] [Google Scholar]
- 26. Wada S., Tsuda M., Sekine T., Cha S. H., Kimura M., Kanai Y., Endou H. (2000) J. Pharmacol. Exp. Ther. 294, 844–849 [PubMed] [Google Scholar]
- 27. Izzedine H., Launay-Vacher V., Deray G. (2005) Am. J. Kidney Dis. 45, 804–817 [DOI] [PubMed] [Google Scholar]
- 28. Motohashi H., Sakurai Y., Saito H., Masuda S., Urakami Y., Goto M., Fukatsu A., Ogawa O., Inui Ki K. (2002) J. Am. Soc. Nephrol. 13, 866–874 [DOI] [PubMed] [Google Scholar]
- 29. Hussain S., Khayat A., Tolaymat A., Rathore M. H. (2006) Pediatr. Nephrol. 21, 1034–1036 [DOI] [PubMed] [Google Scholar]


