Abstract
Activated by the RAS-MAPK signaling pathway, MSK1 is recruited to immediate-early gene (IEG) regulatory regions, where it phosphorylates histone H3 at Ser-10 or Ser-28. Chromatin remodelers and modifiers are then recruited by 14-3-3 proteins, readers of phosphoserine marks, leading to the occupancy of IEG promoters by the initiation-engaged form of RNA polymerase II and the onset of transcription. In this study, we show that this mechanism of IEG induction, initially elucidated in parental 10T1/2 murine fibroblast cells, applies to metastatic Hras1-transformed Ciras-3 cells. As the RAS-MAPK pathway is constitutively activated in Ciras-3 cells, MSK1 activity and phosphorylated H3 steady-state levels are elevated. We found that steady-state levels of the IEG products AP-1 and COX-2 were also elevated in Ciras-3 cells. When MSK1 activity was inhibited or MSK1 expression was knocked down in Ciras-3 cells, the induction of IEG expression and the steady-state levels of COX-2, FRA-1, and JUN were greatly reduced. Furthermore, MSK1 knockdown Ciras-3 cells lost their malignant phenotype, as reflected by the absence of anchorage-independent growth.
Keywords: Chromatin Immunoprecipitation (ChIP), Chromatin Remodeling, Epigenetics, Gene Expression, Ras, 14-3-3, H3 Phosphorylation, Anchorage-independent Growth, Immediate-early Gene Expression, Mitogen- and Stress-activated Protein Kinase 1
Introduction
MSK1 (mitogen- and stress-activated protein kinase 1) is activated by the RAS-MAPK (RAS-RAF-MEK-ERK) and p38 MAPK pathways and mediates the primary response by connecting mitogenic and stress extracellular stimuli with immediate-early gene (IEG)4 expression (1, 2). IEGs are identified by their rapid and transient transcriptional induction, requiring no new protein synthesis. MSK1 substrates include histone H3, the nucleosome-binding protein HMGN1, and transcription factors such as the p65 subunit of NF-κB, ATF1 (activating transcription factor 1), ER81, and CREB (cAMP-responsive element-binding protein) (3). Stimulation of mouse fibroblasts with phorbol esters such as the tumor promoter 12-O-tetradecanoylphorbol-13-acetate (TPA) and EGF results in the phosphorylation of H3 at Ser-10 and Ser-28 and of HMGN1 at Ser-6, events termed the “nucleosomal response” (2). In a recent study (4), we showed that MSK1 is a component of a multiprotein complex including BRG1, the ATPase subunit of the SWI/SNF remodeler, and phosphoserine adaptor 14-3-3 proteins. This complex is recruited to the upstream promoter elements of target genes by transcription factors, resulting in MSK1-mediated H3 phosphorylation at Ser-10 or Ser-28. We proposed a model in which 14-3-3 proteins bind to H3 phosphorylated at Ser-10 (H3S10ph) or Ser-28 (H3S28ph) and, acting as scaffolds, stabilize the SWI/SNF complex at the IEG upstream promoter elements, possibly increasing the residence time of the chromatin remodelers and transcription factors. The recruited SWI/SNF remodels nucleosomes around the promoter, enabling the binding of transcription factors and the onset of transcription (4).
The RAS-MAPK pathway is abnormally active in ∼30% of human cancers (e.g. colon, pancreatic, thyroid, lung, and aggressive breast cancers) (5–7). Hence, we aimed to elucidate the physiological role of MSK1 and to explore the relevance of MSK1 activity to the malignant potential of cells with an overactive RAS-MAPK signaling pathway. As a model system, we used Ciras-3, an Hras1-transformed 10T1/2 mouse fibroblast cell line that is tumorigenic and metastatic and has a constitutively activated RAS-MAPK pathway (8). Ciras-3 cells also exhibit a less condensed chromatin structure and a higher incidence of chromosomal instability than the non-tumorigenic parental 10T1/2 cells (9). It was demonstrated that Ciras-3 cells have elevated levels of phosphorylated ERK1/2 (the hallmark of an activated RAS-MAPK pathway), increased MSK1 activity (but not MSK1 protein), and elevated steady-state levels of H3S10ph, H3S28ph, and HMGN1S6ph compared with the parental 10T1/2 cell line (9, 10). The histone H3 phosphatase PP1 activity is similar in both cell lines. As is the case for parental 10T1/2 cells, TPA stimulation of serum-starved Ciras-3 cells results in the phosphorylation of H3 Ser-10 or Ser-28 and HMGN1 Ser-6, as well as IEG induction (9, 11). However, it is unknown whether the mechanism by which MSK1-induced chromatin remodeling of IEG regulatory regions is altered in Ciras-3 cells as a consequence of a deregulated RAS-MAPK pathway.
In this study, we provide evidence that the mechanism of MSK1-induced chromatin remodeling at IEG regulatory elements in Ciras-3 cells is similar to that in parental 10T1/2 cells. Furthermore, we demonstrate that the increased activity of MSK1 in Hras1-transformed cells results in higher steady-state levels of IEG products than in parental cells and confers to the cells their malignant properties.
EXPERIMENTAL PROCEDURES
Cell Culture
Ciras-3 mouse fibroblast cells were grown at 37 °C in a humidified atmosphere containing 5% CO2 in α-minimal essential medium (α-MEM) supplemented with 10% (v/v) FBS, 100 units/ml penicillin G, 100 μg/ml streptomycin sulfate, and 250 ng/ml amphotericin B. To specifically induce the RAS-MAPK signaling pathway, Ciras-3 cells were grown to 90–100% confluence and serum-starved for 72 h in α-MEM supplemented with 0.5% FBS. Cells were treated with 100 nm TPA (Sigma) from 30–240 min for protein level analyses and for 15 and 30 min for gene expression and chromatin immunoprecipitation experiments. Pretreatment with 10 μm H-89 (EMD Chemicals, Gibbstown, NJ) for 30 min prior to TPA treatment was included when necessary.
Soft Agar Colony Assay
Anchorage-independent growth of cells was assayed by estimating cell growth on soft agar (8). 1 × 10⁴ cells were seeded into 1.5 ml of 10% FBS/α-MEM containing 0.35% agarose in triplicate. For chemical MSK blockage, 10 μm H-89 was added to the medium. The cell suspension in semisolid medium was placed directly onto a layer of solid base 0.5% agarose-containing 10% FBS/α-MEM in a 6-well plate. The plates were allowed to set, and 1 ml of 10% FBS/α-MEM and penicillin G (100 units/ml), streptomycin sulfate (100 μg/ml), amphotericin B (250 ng/ml), and 10 μm H-89 when required were added and exchanged every 24 h. The plates were incubated at 37 °C in a 5% CO2 incubator for 14 or 21 days prior to scoring and documentation. After incubation, the colonies were stained with 0.5 ml of 0.005% crystal violet for at least 1 h for visualization and imaged using Olympus SZX12 dissecting microscope 8× SPOT advanced camera version 4.0.9 software. Colonies were scored using Bio-Rad VersaDoc Model 1000 Quantity One Version 4.6.0 software.
Cell Proliferation Assay
Ciras-3 monolayer cell growth on plastic was evaluated using the CellTiter 96® AQueous One Solution cell proliferation assay (Promega, Madison, WI), a colorimetric method for determining the number of viable cells. Cells were counted using a hemocytometer with trypan blue exclusion. 1 × 10³ cells were seeded in triplicate, using 96-well plates, in 100 μl of medium. Cells, placed at 37 °C in a humidified atmosphere containing 5% CO2, were allowed to adhere for 4 h and incubated for up to 96 h. At 4 h and every 24 h thereafter, 20 μl/well CellTiter 96® AQueous One Solution was added. The MTS tetrazolium compound (3-(4,5-dimethylthiazol-2-yl)-5-(3-carboxymethoxyphenyl)-2-(4-sulfophenyl)-2H-tetrazolium, inner salt) in the reagent is bioreduced by cells into a colored formazan product. Following addition of the reagent, the plate was incubated for 2 h at 37 °C in 5% CO2, and absorbance was measured at 490 nm in a 96-well plate reader. To correct for background absorbance of the medium, wells containing medium alone at each time point were incubated with the solution reagent alongside the cells. The measured values of the time points in each sample were corrected by subtracting the absorbance in medium alone and plotted.
Generation and Maintenance of MSK1 Stable Knockdown Mouse Fibroblasts
Empty GIPZ lentiviral vector and the GIPZ lentiviral shRNAmir clones for mouse MSK1 (clone V2LMM_54318 SENSE 2240 (mm1), clone V2LMM_46372 SENSE 1059 (mm2), and clone V2LMM_57259 SENSE 523 (mm3); Open Biosystems, Huntsville, AL) were obtained from the Biomedical Functionality Resource at the University of Manitoba. MSK1 stable knockdown Ciras-3 cell lines were obtained as described previously (4).
ChIP and Sequential ChIP (Re-ChIP) Assays
ChIP and re-CHIP assays were performed as described (4).
Preparation of Total Cell Protein Extracts
Cells were harvested and lysed in 400 μl of ice-cold Nonidet P-40 buffer (150 mm NaCl, 50 mm Tris-HCl (pH 8.0), 0.5% Nonidet P-40, 1 mm phenylmethylsulfonyl fluoride, 1 mm sodium orthovanadate, 1 mm NaF, 1.0 μg/ml leupeptin, 1.0 μg/ml aprotinin, and 25 mm β-glycerophosphate) and centrifuged at 11,950 × g for 10 min at 4 °C. The protein concentration of the supernatant was measured using Coomassie Plus (Bradford) assay reagent (Thermo Scientific, Rockford, IL). Total cell protein extracts (20 μg) were resolved by 10% SDS-PAGE and transferred to nitrocellulose membrane. Immunochemical staining with anti-JUN (sc-1694, Santa Cruz Biotechnology, Santa Cruz, CA), anti-FRA-1 (sc-183, Santa Cruz Biotechnology), anti-COX-2 (AB5118, Millipore, Billerica, MA), anti-β-actin (A5441, Sigma), anti-ERK1 (sc-93-G, Santa Cruz Biotechnology), and anti-phospho-p44/42 MAPK (ERK1/2) Thr-202/Tyr-204 (4370L, Cell Signaling Technology, Inc., Danvers, MA) antibodies was performed at dilutions of 1:2000, 1:2000, 1:3000, 1:5000, 1:500, and 1:1000, respectively. Enhanced chemiluminescence kits were purchased from PerkinElmer Life Sciences.
RNA Isolation and Real-time RT-PCR Analysis
RNA isolation and real-time RT-PCR analysis were done as described previously (4).
RESULTS
Hras1-transformed Cells Have Increased Steady-state levels of COX-2, FRA-1, and JUN Proteins Compared with Parental Cells
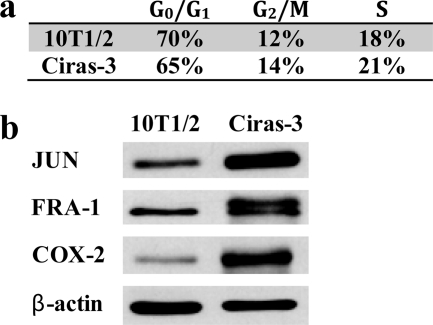
We have previously reported that, in cell cycle-matched 10T1/2 and Ciras-3 cells, the levels of phosphorylated ERK1/2 isoforms, MSK1 activity, and levels of phosphorylated histone H3 and HMGN1 were elevated in Ciras-3 cells compared with 10T1/2 cells (9–11). It was proposed that these circumstances may contribute to the aberrant gene expression observed in the oncogene-transformed cells (11). Thus, we analyzed the steady-state levels of some IEG-encoded proteins, specifically FRA-1 (FOS-related antigen 1 encoded by Fosl1, the FOS-like antigen 1 gene) and JUN, which are components of the activator protein AP-1, a homodimer or heterodimer consisting of proteins of the JUN, FOS, and ATF families, and COX-2 (cyclooxygenase-2). In comparing the steady-state levels of these three proteins, we studied parental 10T1/2 and Ciras-3 cells with equal proportions of cells in each phase of the cell cycle (Fig. 1a). 10T1/2 and Ciras-3 cell extracts were resolved by SDS-PAGE and transferred to nitrocellulose for immunoblot analysis. Fig. 1b shows that IEG product levels were higher in Ciras-3 cells than in 10T1/2 cells: six times higher for COX-2, four times for FRA-1, and eight times for JUN. The levels of the β-actin control were equivalent in both cell lines. Thus, elevated ERK1/2 and MSK1 activities in cycling Ciras-3 cells are correlated with elevated steady-state levels of IEG-encoded proteins.
FIGURE 1.
Protein levels of COX-2, FRA-1, and JUN in parental and Hras1-transformed mouse fibroblasts. a, the cell cycle distribution of 10T1/2 and Ciras-3 cells was determined by FACS analysis. b, 20 μg of cell cycle-matched 10T1/2 and Ciras-3 cell lysates were resolved by 10% SDS-PAGE. Membranes were immunochemically stained with anti-COX-2, anti-FRA-1, anti-JUN, and anti-β-actin antibodies.
TPA Stimulation of Hras1-transformed Cells Promotes MSK1-mediated Histone H3 Phosphorylation, Followed by Recruitment of 14-3-3 Proteins and Chromatin Remodelers/Modifiers to IEG Regulatory Regions
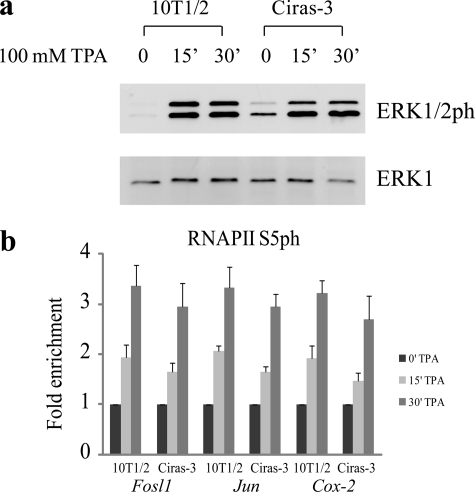
We previously reported that MSK1 activity was required for the establishment of the chromatin environment observed at IEG regulatory regions upon TPA stimulation of 10T1/2 parental cells (4). However, it is possible that the chain of events initiated by MSK1 could be altered in a background of chromatin decondensation and increased levels of AP-1 transcription factors. First, we analyzed the effects of TPA stimulation following serum starvation on the RAS-MAPK pathway in Ciras-3 cells by examining the levels of phosphorylated ERK1/2. Fig. 2a shows that phosphorylated ERK1/2 levels were very low in serum-starved 10T1/2 and Ciras-3 cells, with Ciras-3 cells having slightly higher levels of phosphorylated ERK1/2 compared with 10T1/2 cells. When TPA was added, ERK1/2 became phosphorylated to comparable levels in both cell lines, with the phosphorylation plateau being reached within 15 min of TPA induction (Fig. 2a). To identify the onset of transcription of the Fosl1, Jun, and Cox-2 genes upon TPA induction, we determined the state of occupancy at their promoter region of the initiation-engaged form of RNA polymerase II (RNAPII) phosphorylated at Ser-5 (RNAPIIS5ph) by ChIP assays on serum-starved 10T1/2 and Ciras-3 cells treated with TPA for 0, 15, or 30 min. Fig. 2b shows that the presence of RNAPIIS5ph at the promoter region of each of the three genes increased similarly in both cell lines upon TPA stimulation.
FIGURE 2.
TPA-induced ERK1/2 phosphorylation and transcription initiation of Fosl1, Jun, and Cox-2 genes in parental and Hras1-transformed mouse fibroblasts. Serum-starved 10T1/2 and Ciras-3 cells were treated with TPA for 0, 15, or 30 min. a, cell lysates were resolved by 10% SDS-PAGE. Membranes were immunochemically stained with anti-ERK1 or anti-phosphorylated ERK1/2 antibody. b, ChIP experiments were performed using antibodies against RNAPIIS5ph on formaldehyde-cross-linked mononucleosomes. Equal amounts of input and immunoprecipitated DNA were quantified by real-time quantitative PCR. Enrichment values are the mean of three independent experiments, and error bars represent S.D.
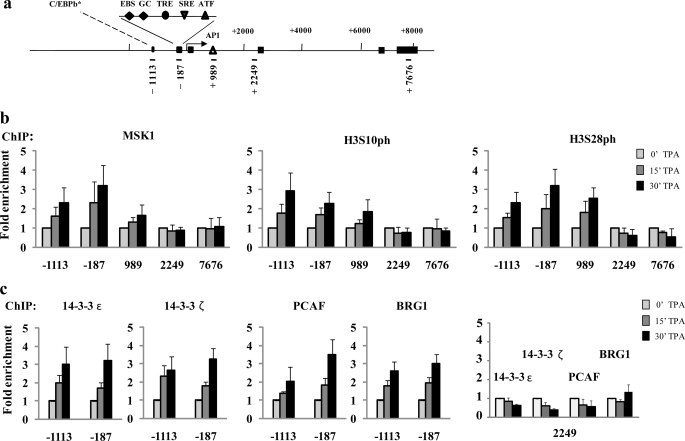
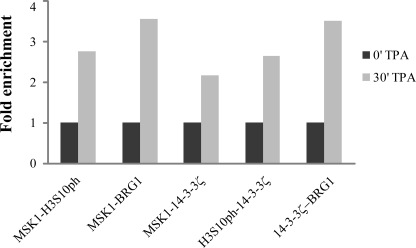
To compare the mechanism of TPA induction in Ciras-3 cells with that in 10T1/2 cells, we then performed a series of ChIP assays on serum-starved Ciras-3 cells treated with TPA for 0, 15, or 30 min. The genomic structure and regulatory sites of the murine Fosl1, Jun, and Cox-2 genes and the regions chosen for analysis are displayed in Fig. 3a (Fosl1) and supplemental Figs. 1a (Jun) and 2a (Cox-2). The distribution of MSK1, H3S10ph, and H3S28ph along the regulatory and coding regions of these genes was determined using high resolution ChIP assays in which nuclei isolated from formaldehyde-treated cells were digested with micrococcal nuclease such that the chromatin was processed down to mononucleosomes. Upon TPA induction, MSK1 associated with the three regulatory regions of the Fosl1 gene, the 5′-distal region (−1113) containing a putative binding site for C/EBPβ (CCAAT/enhancer-binding protein β), the 5′-proximal region (−187) with multiple responsive elements, and the enhancer region (+989) located in intron 1 with an AP-1 site (12). There was no TPA-induced association of MSK1 with the Fosl1 coding region (+2249 and +7676) (Fig. 3, a and b). MSK1 also associated with both upstream regions of the Jun gene, the 5′-distal region (−711) containing a putative binding site for the ELK-1 transcription factor and the 5′-proximal region (−146) with binding sites for several transcription factors, including JUN (supplemental Fig. 1, a and b), and with the 5′-distal (−493) and 5′-proximal (−111) upstream regions of the Cox-2 gene (supplemental Fig. 2, a and b), but not with the coding region of either gene (supplemental Fig. 1, a and b, and Fig. 2, a and b). The distribution of H3S10ph and H3S28ph mirrored that of MSK1 along all three genes (Fig. 3b and supplemental Figs. 1b and 2b). TPA-induced occupancy of all three gene regulatory regions by 14-3-3ϵ and 14-3-3ζ was observed in Ciras-3 cells (Fig. 3c and supplemental Figs. 1c and 2c), indicating that the phospho-marks were “read” by 14-3-3 proteins, as in parental 10T1/2 cells (4). Likewise, the H3 K acetyltransferase PCAF (p300/CBP-associated factor) and BRG1, the ATPase subunit of the chromatin remodeler SWI/SNF, were recruited to the three gene regulatory regions upon TPA stimulation of Ciras-3 cells (Fig. 3c and supplemental Figs. 1c and 2c). On the other hand, no TPA-induced increase in the association of 14-3-3ϵ, 14-3-3ζ, BRG1, or PCAF with the Fosl1 coding region (+2249) was observed (Fig. 3c). To determine whether simultaneous recruitment of MSK1, 14-3-3 proteins, and remodeler occurred at the promoter region of IEGs, re-ChIP assays were performed. Formaldehyde-cross-linked mononucleosomes from serum-starved Ciras-3 cells treated or not for 30 min with TPA were subjected to sequential ChIPs with one antibody and again precipitated using another antibody. Fig. 4 shows that all re-ChIP assays resulted in a marked increase in DNA precipitation of the proximal regulatory region from the Fosl1 gene (−187) when cells were treated with TPA. These data demonstrate that, upon TPA stimulation, MSK1 and H3S10ph, MSK1 and BRG1, MSK1 or H3S10ph and 14-3-3ζ, and 14-3-3ζ and BRG1 were found together on the same proximal regulatory region of the Fosl1 gene. These results show that the mechanism of MSK1-induced remodeling of IEG upstream promoter elements was not altered in Hras1-transformed cells relative to parental 10T1/2 cells.
FIGURE 3.
TPA-induced nucleosomal response and recruitment of 14-3-3 and chromatin modifiers/remodelers to the Fosl1 regulatory regions in Hras1-transformed mouse fibroblasts. a, schematic representation of the Fosl1 gene showing regions amplified in the ChIP assays. Each region is labeled according to the 5′-position of the forward primer relative to the transcription start site. Exons are represented by boxes, and binding sites of relevant transcription factors located in the amplified regions are displayed. EBS, Ets-binding site; GC, GC box, which is a binding site for the Sp family transcription factors; TRE, TPA-responsive element; SRE, serum-responsive element. The asterisk indicates a putative binding site. ChIP experiments were performed using antibodies against MSK1, H3S10ph, and H3S28ph (b) and 14-3-3ϵ/ζ, PCAF, and BRG1 (c) on formaldehyde-cross-linked mononucleosomes prepared from serum-starved Ciras-3 cells treated with TPA for 0, 15, and 30 min. Equal amounts of input and immunoprecipitated DNA were quantified by real-time quantitative PCR. Enrichment values are the mean of three independent experiments, and error bars represent S.D.
FIGURE 4.
TPA-induced co-occupancy of MSK1, 14-3-3 proteins, and chromatin remodeler in the Fosl1 upstream promoter region. Re-ChIP experiments were performed on formaldehyde-cross-linked mononucleosomes prepared from serum-starved Ciras-3 cells treated with TPA for 0 or 30 min. The antibodies used are indicated. Equal amounts of input and immunoprecipitated DNA were quantified by real-time quantitative PCR.
TPA-induced IEG Transcription Initiation in Hras1-transformed Cells Is Abolished by MSK Inhibitor H-89
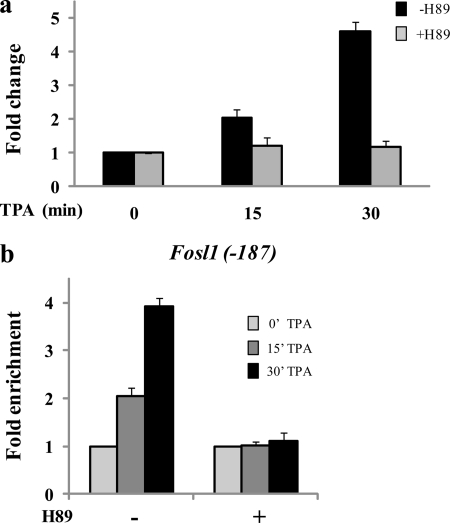
We previously reported that the MSK inhibitor H-89 prevented the TPA-induced transcription initiation of the IEGs Jun, Cox-2, and Fosl1 (4). To investigate whether TPA induction of IEGs in Hras1-transformed cells is dependent on MSK1 activation, we quantified Fosl1, Jun, and Cox-2 mRNA levels at 0, 15, and 30 min of TPA induction of Ciras-3 cells pretreated or not with 10 μm H-89. Fig. 5a shows that Fosl1 transcription was not induced when serum-starved Ciras-3 cells were exposed to H-89 prior to TPA treatment. Conversely, the GAPDH expression levels were not affected by H-89 pretreatment. The TPA-induced transcription of Jun and Cox-2 was also abolished by H-89 pretreatment (data not shown). To test whether inhibition of MSK activity prevents the TPA-induced formation of a transcription initiation complex at the 5′-end of IEGs, we performed high resolution ChIP assays with antibodies raised against RNAPIIS5ph. We found that, upon TPA stimulation of H-89-pretreated Ciras-3 cells, RNAPIIS5ph was not associated with the promoter region of Fosl1 (Fig. 5b) or Jun or Cox-2 (data not shown). These results suggest that MSK activity is required for the formation of an initiation complex at IEG 5′-regulatory regions in Hras1-transformed cells.
FIGURE 5.
TPA induction of Fosl1 in Hras1-transformed cells. a, serum-starved Ciras-3 cells were pretreated or not with H-89 prior to TPA stimulation for 0, 15, or 30 min. Total RNA was isolated and quantified by real-time RT-PCR. -Fold changes were normalized to GAPDH levels and time 0 values. b, Ciras-3 formaldehyde-cross-linked mononucleosomes were prepared and used in ChIP assays with anti-RNAPIIS5ph antibodies. Equal amounts of input and immunoprecipitated DNA were quantified by real-time quantitative PCR. The enrichment values of the upstream promoter region of the Fosl1 gene (−187) are the mean of three independent experiments, and error bars represent S.D.
TPA-induced MSK1 Recruitment, Histone H3 Phosphorylation, and Recruitment of 14-3-3 Proteins and Chromatin Remodelers/Modifiers to IEG Regulatory Regions Are Abolished by MSK Inhibitor H-89 in Hras1-transformed Cells
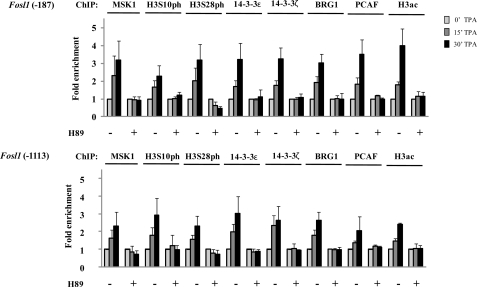
To determine whether the absence of TPA-induced IEG transcription initiation in H-89-pretreated Ciras-3 cells is a consequence of a lack of chromatin modification and remodeling at IEG regulatory regions, we performed the ChIP experiments on H-89-pretreated cells. Fig. 6 shows that H-89 treatment prevented MSK1 recruitment to the three regulatory regions of Fosl1. Consequently, phosphorylation of histone H3 Ser-10 and Ser-28 in response to TPA treatment did not occur. In agreement with the proposed model (4), impairing the setting of the phospho-marks thwarted the recruitment of the phosphohistone H3 effectors 14-3-3ϵ and 14-3-3ζ, the chromatin modifier PCAF, and the component BRG1 of the chromatin remodeler complex. H-89 pretreatment of TPA-stimulated Ciras-3 cells similarly blocked this series of events at the regulatory regions of the Jun and Cox-2 genes (supplemental Figs. 3 and 4).
FIGURE 6.
H-89 inhibition of TPA-induced nucleosomal response and chromatin remodeler/modifier recruitment to Fosl1 regulatory regions in Hras1-transformed mouse fibroblasts. Serum-starved Ciras-3 cells were pretreated or not with H-89 prior to TPA stimulation for 0, 15, or 30 min. Formaldehyde-cross-linked mononucleosomes were prepared and used in ChIP assays with antibodies as indicated. Equal amounts of input and immunoprecipitated DNA were quantified by real-time quantitative PCR. Enrichment values are the mean of three independent experiments, and error bars represent S.D. H3ac, acetylated histone H3.
MSK1 Activity Is Crucial to Malignant Phenotype of Hras1-transformed Cells
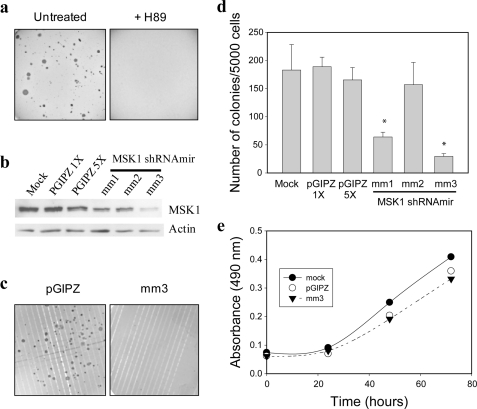
Ciras-3 cells, but not 10T1/2 cells, readily form colonies in soft agar, exhibiting an anchorage-independent growth that is distinctive of neoplastic transformation (8, 9). To ascertain whether MSK activity is important to their metastatic potential, Ciras-3 cells were seeded in soft agar and left untreated or treated with 10 μm H-89 for 3 weeks, after which the number of colonies was evaluated. Fig. 7a shows that the MSK inhibitor H-89 interfered with the ability of Ciras-3 cells to form colonies in soft agar. To ensure that the lack of growth in soft agar was not a consequence of some other effect of H-89 on cell proliferation, we used a lentiviral vector system stably expressing shRNA to generate MSK1 stable knockdown Ciras-3 cell lines. Ciras-3 cells were transfected with three different shRNA vectors (mm1, mm2, and mm3) targeted to different regions of the MSK1 coding sequence. These multiple targeting vectors were used to control for off-target effects (13). Controls consisted of mock-transfected and empty vector pGIPZ-transfected cell lines. Immunoblot analysis demonstrated that MSK1 levels in Ciras-3 cells stably expressing the MSK1 knockdown-targeting vector mm1, mm2, or mm3 were reduced by 60, 24, or 63%, respectively, relative to Ciras-3 cells expressing the pGIPZ control vector (Fig. 7b). When tested for their anchorage-independent growth capabilities in a soft agar assay, Ciras-3 cells expressing the MSK1 knockdown-targeting vector mm1, mm2, or mm3 produced colonies whose numbers represented 34, 83, and 16%, respectively, of the number counted for the empty vector pGIPZ-transfected cell control (Fig. 7, c and d). These numbers show that MSK1 knockdown is associated with the loss of anchorage-independent growth in soft agar. In particular, both the mm1 and mm3 vectors, which resulted in at least a 60% reduction in MSK1 protein levels, led to a statistically significant difference in the cell ability for anchorage-independent growth compared with the pGIPZ empty vector (Fig. 7d). In contrast to the anchorage-independent growth, the monolayer cell growth on plastic of the cell line expressing the mm3 vector was not impacted to a significant extent by the MSK1 knockdown (Fig. 7e). These data demonstrate that the malignant potential of the Ciras-3 cell line, represented by the anchorage-independent cell growth capability, is dependent on MSK1 activity.
FIGURE 7.
MSK1 activity is required for anchorage-independent growth of Ras-transformed mouse fibroblasts. a, Ciras-3 cells were grown in soft agar with or without H-89. b, 20 μg of MSK1 knockdown or control cell lysates were resolved by 10% SDS-PAGE and immunoblotted with anti-MSK1 and anti-β-actin antibodies. c and d, equal numbers of Ciras-3 cells stably expressing the MSK1 knockdown-targeting vector mm1, mm2, or mm3 or the pGIPZ control and mock-transfected cells were grown in soft agar. The numbers of colonies were counted after 14 days and plotted for each cell line. Images of plates are shown for the Ciras-3 cells stably expressing the MSK1 knockdown-targeting vector mm3 and pGIPZ. Data are representative of three individual experiments. *, statistically significant difference as determined by a Student's t test comparison of mm1 and mm3 with the pGIPZ control (p < 0.01). e, Ciras-3 cells stably expressing the MSK1 knockdown-targeting vector mm3 or the pGIPZ control and mock-treated cells were seeded in triplicate in a 96-well plate and evaluated for cell proliferation using CellTiter 96® Aqueous One Solution reagent. The absorbance readings were measured at 490 nm, and measured values were plotted as described under “Experimental Procedures.” Data are representative of three individual experiments.
Levels of MSK1 Activity Regulate Steady-state Levels of IEG Products in Hras1-transformed Fibroblast Cells
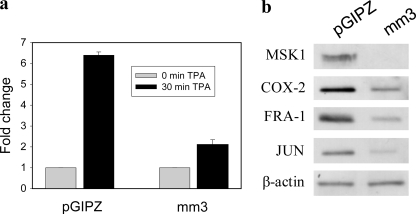
To determine whether the heightened activity of MSK1 is responsible for AP-1 and COX-2 protein levels, we compared the TPA induction of Fosl1, Jun, and Cox-2 in Ciras-3 cells expressing the MSK1 knockdown-targeting vector mm3 or the pGIPZ empty vector. Fig. 8a shows that, in serum-starved Ciras-3 cells expressing mm3, the TPA induction of the Fosl1 gene was reduced by 67% relatively to the control cells. Similar results were obtained with Jun and Cox-2, with their expression being reduced by 58 and 64%, respectively, in MSK1 knockdown cells compared with control cells (data not shown). We showed in Fig. 1 that IEG protein steady-state levels were higher in Ciras-3 cells than in parental 10T1/2 cells, mirroring the increased MSK1 activity. Hence, we compared IEG protein steady-state levels in Ciras-3 cells expressing the MSK1 knockdown-targeting vector mm3 or the pGIPZ empty vector. In knockdown cells with MSK1 steady-state levels reduced by 91% relative to control cells, the steady-state levels of COX-2, FRA-1, and JUN, normalized to β-actin levels, were reduced by 34, 45, and 49%, respectively (Fig. 8b). Thus, the increased MSK1 activity in Hras1-transformed mouse fibroblast cells is critically important to maintaining the steady-state levels of IEG-encoded products.
FIGURE 8.
MSK1 activity is required for increased steady-state levels of IEG proteins in Hras1-transformed fibroblast cells. a, serum-starved Ciras-3 cells stably expressing the MSK1 knockdown-targeting vector mm3 or the pGIPZ empty vector were left untreated or treated with TPA for 30 min. Total RNA was isolated and quantified for Fosl1 mRNA by real-time RT-PCR. -Fold changes were normalized to GAPDH levels and time 0 values. b, 20 μg of cell lysates from Ciras-3 cells expressing the MSK1 knockdown-targeting vector mm3 or the pGIPZ control were resolved by 10%-SDS PAGE and immunoblotted with anti-COX-2, anti-FRA-1, anti-JUN, and anti-β-actin antibodies.
DISCUSSION
The MSK1-mediated nucleosomal response plays a critical role in several physiological processes, including inflammation, neuronal plasticity, and function such as memory formation, learning, and responses to external stimuli (e.g. fear or drug exposure) (3, 14). It is involved in cell cycle regulation and is required for tumor promoter-induced cell transformation (15). MSK1 deregulation may be involved in mechanisms underlying diseases such as Huntington or psoriasis (16, 17). Furthermore, >30% of human cancers have an overactive RAS-MAPK pathway and presumably elevated MSK1 activity (5–7).
Serum-starved 10T1/2 and Ciras-3 cells have low levels of phosphorylated ERK1/2. Upon TPA stimulation, phosphorylated ERK1 and ERK2 increase to comparable levels in both cell lines, leading to the MSK1-mediated nucleosomal response targeting IEG regulatory regions, the binding of the 14-3-3 phosphoserine mark readers, the recruitment of chromatin remodelers and modifiers, and the initiation of transcription. Thus, MSK1 sets off identical mechanistic processes in both parental 10T1/2 and tumorigenic Ciras-3 cells, even though cellular backgrounds differ, with Ciras-3 cells having a more open chromatin structure and elevated AP-1 transcription factor levels.
However, the RAS-MAPK pathway is constitutively activated in Ciras-3 cells, and the steady-state levels of phosphorylated ERK1/2 are elevated, generating increased MSK1 activity and elevated steady-state levels of FRA-1, JUN, and COX-2. This may result in a permanently altered gene expression program that will facilitate the progress of transformed cells toward the next stage of tumor formation or metastasis. AP-1 regulates the expression of genes involved in proliferation, apoptosis, transformation, and cancer cell invasion (18, 19). Specifically, JUN and FRA-1 play a pivotal role in the RAS-induced transformation process (20, 21). In addition, amplification or overexpression of genes coding for JUN and FRA-1 induces transformation in vivo (18, 22–24). COX-2 synthesizes prostaglandin E2, a stimulator of the apoptosis inhibitor BCL-2, and is highly expressed in several human malignancies, including colorectal, gastric, prostate, breast, lung, and endometrial cancers (25, 26). The regulation of each of these three genes, Jun, Fosl1, and Cox-2, is orchestrated by numerous transcription factors, which themselves must be activated. Moreover, transcriptional autoregulation and post-transcriptional stabilization are also involved. Nonetheless, we have shown that MSK1 activity is critical in maintaining high levels of JUN, FRA-1, and COX-2 and in sustaining their ability to drive the cancer process. Chemical or genetic interference with MSK1 activity causes decreased steady-state levels of FRA-1, JUN, and COX-2 and the loss of Ciras-3 cell metastatic properties. Our studies provide mechanistic understanding to previous data showing the importance of MSK1 and the nucleosomal response in the malignant transformation of mouse epidermal cells and v-Src-transformed rat fibroblast cells (15, 27).
Considering that MSK1 is the active link between the signaling cascade and the primary response at the gene expression level, it is an ideal candidate for cancer chemotherapy and has immense potential in the treatment of cancers in which the RAS-MAPK pathway is abnormally active (e.g. colon, pancreatic, and aggressive breast cancers). Because MSK knock-out mice are viable and fertile (28), inhibition of MSK1 activity would likely not have significant adverse effects on normal cells, and due to oncogenic addiction of cancer cells, it might result in differentiation or apoptosis of cancer cells (29).
Supplementary Material
Acknowledgment
We thank Geneviève Delcuve for manuscript preparation.
This work was supported by grants from the Canadian Cancer Society Research Institute, the Canadian Institutes of Health Research, and the Manitoba Health Research Council and by a Canada Research Chair (to J. R. D.), a Canadian Cancer Society Research Institute Terry Fox Foundation studentship (to B. D.), a Manitoba Health Research Council fellowship (to B. P.-C.), and a Canadian Institutes of Health Research Frederick Banting and Charles Best Canada graduate scholarship (to P. S. E.).

The on-line version of this article (available at http://www.jbc.org) contains supplemental Figs. 1–4.
- IEG
- immediate-early gene
- TPA
- 12-O-tetradecanoylphorbol-13-acetate
- α-MEM
- α-minimal essential medium
- RNAPII
- RNA polymerase II.
REFERENCES
- 1. Deak M., Clifton A. D., Lucocq L. M., Alessi D. R. (1998) EMBO J. 17, 4426–4441 [DOI] [PMC free article] [PubMed] [Google Scholar]
- 2. Soloaga A., Thomson S., Wiggin G. R., Rampersaud N., Dyson M. H., Hazzalin C. A., Mahadevan L. C., Arthur J. S. (2003) EMBO J. 22, 2788–2797 [DOI] [PMC free article] [PubMed] [Google Scholar]
- 3. Arthur J. S. (2008) Front. Biosci. 13, 5866–5879 [DOI] [PubMed] [Google Scholar]
- 4. Drobic B., Pérez-Cadahía B., Yu J., Kung S. K., Davie J. R. (2010) Nucleic Acids Res. 38, 3196–3208 [DOI] [PMC free article] [PubMed] [Google Scholar]
- 5. Bos J. L. (1989) Cancer Res. 49, 4682–4689 [PubMed] [Google Scholar]
- 6. Calipel A., Lefevre G., Pouponnot C., Mouriaux F., Eychène A., Mascarelli F. (2003) J. Biol. Chem. 278, 42409–42418 [DOI] [PubMed] [Google Scholar]
- 7. Dunn K. L., Espino P. S., Drobic B., He S., Davie J. R. (2005) Biochem. Cell Biol. 83, 1–14 [DOI] [PubMed] [Google Scholar]
- 8. Egan S. E., McClarty G. A., Jarolim L., Wright J. A., Spiro I., Hager G., Greenberg A. H. (1987) Mol. Cell. Biol. 7, 830–837 [DOI] [PMC free article] [PubMed] [Google Scholar]
- 9. Dunn K. L., He S., Wark L., Delcuve G. P., Sun J. M., Yu Chen H., Mai S., Davie J. R. (2009) Genes Chromosomes Cancer 48, 397–409 [DOI] [PubMed] [Google Scholar]
- 10. Drobic B., Espino P. S., Davie J. R. (2004) Cancer Res. 64, 9076–9079 [DOI] [PubMed] [Google Scholar]
- 11. Strelkov I. S., Davie J. R. (2002) Cancer Res. 62, 75–78 [PubMed] [Google Scholar]
- 12. Bergers G., Graninger P., Braselmann S., Wrighton C., Busslinger M. (1995) Mol. Cell. Biol. 15, 3748–3758 [DOI] [PMC free article] [PubMed] [Google Scholar]
- 13. Echeverri C. J., Beachy P. A., Baum B., Boutros M., Buchholz F., Chanda S. K., Downward J., Ellenberg J., Fraser A. G., Hacohen N., Hahn W. C., Jackson A. L., Kiger A., Linsley P. S., Lum L., Ma Y., Mathey-Prévôt B., Root D. E., Sabatini D. M., Taipale J., Perrimon N., Bernards R. (2006) Nat. Methods 3, 777–779 [DOI] [PubMed] [Google Scholar]
- 14. Brami-Cherrier K., Roze E., Girault J. A., Betuing S., Caboche J. (2009) J. Neurochem. 108, 1323–1335 [DOI] [PubMed] [Google Scholar]
- 15. Kim H. G., Lee K. W., Cho Y. Y., Kang N. J., Oh S. M., Bode A. M., Dong Z. (2008) Cancer Res. 68, 2538–2547 [DOI] [PMC free article] [PubMed] [Google Scholar]
- 16. Roze E., Betuing S., Deyts C., Marcon E., Brami-Cherrier K., Pagès C., Humbert S., Mérienne K., Caboche J. (2008) FASEB J. 22, 1083–1093 [DOI] [PubMed] [Google Scholar]
- 17. Gesser B., Johansen C., Rasmussen M. K., Funding A. T., Otkjaer K., Kjellerup R. B., Kragballe K., Iversen L. (2007) J. Invest. Dermatol. 127, 2129–2137 [DOI] [PubMed] [Google Scholar]
- 18. Mariani O., Brennetot C., Coindre J. M., Gruel N., Ganem C., Delattre O., Stern M. H., Aurias A. (2007) Cancer Cell 11, 361–374 [DOI] [PubMed] [Google Scholar]
- 19. Shen Q., Uray I. P., Li Y., Krisko T. I., Strecker T. E., Kim H. T., Brown P. H. (2008) Oncogene 27, 366–377 [DOI] [PubMed] [Google Scholar]
- 20. Mechta F., Lallemand D., Pfarr C. M., Yaniv M. (1997) Oncogene 14, 837–847 [DOI] [PubMed] [Google Scholar]
- 21. van Dam H., Castellazzi M. (2001) Oncogene 20, 2453–2464 [DOI] [PubMed] [Google Scholar]
- 22. Kustikova O., Kramerov D., Grigorian M., Berezin V., Bock E., Lukanidin E., Tulchinsky E. (1998) Mol. Cell. Biol. 18, 7095–7105 [DOI] [PMC free article] [PubMed] [Google Scholar]
- 23. Shaulian E., Karin M. (2001) Oncogene 20, 2390–2400 [DOI] [PubMed] [Google Scholar]
- 24. Verde P., Casalino L., Talotta F., Yaniv M., Weitzman J. B. (2007) Cell Cycle 6, 2633–2639 [DOI] [PubMed] [Google Scholar]
- 25. Tsatsanis C., Androulidaki A., Venihaki M., Margioris A. N. (2006) Int. J. Biochem. Cell Biol. 38, 1654–1661 [DOI] [PubMed] [Google Scholar]
- 26. Sahin M., Sahin E., Gümüslü S. (2009) Angiology 60, 242–253 [DOI] [PubMed] [Google Scholar]
- 27. Tange S., Ito S., Senga T., Hamaguchi M. (2009) Biochem. Biophys. Res. Commun. 386, 588–592 [DOI] [PubMed] [Google Scholar]
- 28. Wiggin G. R., Soloaga A., Foster J. M., Murray-Tait V., Cohen P., Arthur J. S. (2002) Mol. Cell. Biol. 22, 2871–2881 [DOI] [PMC free article] [PubMed] [Google Scholar]
- 29. Weinstein I. B. (2002) Science 297, 63–64 [DOI] [PubMed] [Google Scholar]
Associated Data
This section collects any data citations, data availability statements, or supplementary materials included in this article.


