Abstract
The importance of microRNAs (miRNAs) in human malignancies has been well recognized. Here, we report that the expression of microRNA-210 (miR-210) is down-regulated in human esophageal squamous cell carcinoma and derived cell lines. Marked decreases in the level of miR-210 were observed especially in poorly differentiated carcinomas. We found that miR-210 inhibits cancer cell survival and proliferation by inducing cell death and cell cycle arrest in G1/G0 and G2/M. Finally, we identified fibroblast growth factor receptor-like 1 (FGFRL1) as a target of miR-210 in esophageal squamous cell carcinoma and demonstrated that FGFRL1 accelerates cancer cell proliferation by preventing cell cycle arrest in G1/G0. Taken together, our findings show an important role for miR-210 as a tumor-suppressive microRNA with effects on cancer cell proliferation.
Keywords: Cell Cycle, Cell Death, MicroRNA, Tumor, Tumor Suppressor, FGFRL1, Esophageal Squamous Cell Carcinoma, miR-210, Tumor Differentiation
Introduction
MicroRNAs (miRNAs)2 are evolutionarily conserved small noncoding RNAs (20–23 nucleotides) that bind to complementary sequences in the 3′-untranslated region (UTR) of target messenger RNAs (mRNAs) and regulate gene expression by the cleavage of target mRNAs and/or translational inhibition (1). Currently, >800 human miRNAs have been identified and registered in the miRNA database, miRBase (2). miRNAs play important roles in the differentiation of various cell types and in the initiation and progression of cancer, and it has been shown that the expression of some miRNAs is altered during cell differentiation and in malignancies (1, 3, 4).
In a recent study, we identified microRNA-210 (miR-210) as one of the miRNAs that is markedly differentially expressed during the process of epithelial differentiation (3). It has been reported that miR-210 expression is down-regulated during epithelial-mesenchymal transition, the aberrant activation of which triggers cancer pathology (5). Carcinomas are derived from epithelial cells, and poor prognosis in patients with carcinoma is associated with the disruption of characteristics of differentiated epithelial cells, such as cell junctions and polarity (6–8). Hence, given that the expression of miR-210 appears to be correlated well with epithelial differentiation, miR-210 might play a suppressive role in carcinomas. In support of this idea, allelic deletions at the miR-210 locus have been observed in 64% of cases of ovarian cancer (9), and ectopic expression of miR-210 represses tumor growth when human cancer cell lines are implanted into immunodeficient mice (10). However, the clinical roles of miR-210 in carcinomas and the mechanisms by which it represses tumor growth remain unknown.
In this study, we investigated the functional role of miR-210 in the growth of carcinomas and the mechanism by which it acts using clinical samples as well as cell lines of esophageal squamous cell carcinoma (ESCC). ESCC is a highly aggressive malignancy with a 5-year survival rate of 10% worldwide. It has been used as a model to study the mechanisms of dysregulated epithelial differentiation and epithelial-mesenchymal transition in carcinomas (11, 12).
EXPERIMENTAL PROCEDURES
Specimens
All tumor samples were confirmed as ESCC by the Clinicopathologic Department at Kyoto University Hospital. All cases were classified according to the sixth edition of the pathologic tumor-node-metastasis (TNM) classification (13). Written informed consent for the research use was obtained from each patient before surgery. The study was approved by the Kyoto University Institutional Review Board.
Cell Culture and Transfection
HE3 cells, which are human primary normal esophageal epithelial cells, were established and cultured in keratinocyte SFM (Invitrogen) containing human recombinant epidermal growth factor (Invitrogen) and bovine pituitary extract (Invitrogen). HEEpiC cells were purchased from ScienCell Research Laboratories (Carlsbad, CA) and were cultured according to the manufacturer's instructions (14). The human ESCC cell lines KYSE-150, -170, -190, and -590 were maintained as described previously (14, 15). KYSE-170 cells were transfected with oligoribonucleotides for miR-210 or negative control RNA (ncRNA) (Ambion, Austin, TX) using HiPerFect transfection reagent (Qiagen, Valencia, CA) according to the manufacturer's protocol for overexpression. KYSE-170 cells were also transfected with FGFRL1 (fibroblast growth factor receptor-like 1) small interfering RNAs (siRNAs) or negative control siRNA (ncsiRNA) (Invitrogen) for knockdown of FGFRL1. The coding region of FGFRL1 was isolated from complementary DNA (cDNA) from KTSE-170 cells, which was reverse transcribed using an oligo(dT) primer (Invitrogen), and ligated into the pcDNA3 expression vector. This FGFRL1 expression construct was transfected into KYSE-170 cells using TransIT-LT1 transfection reagent (Mirus, Madison, WI). For inhibition of miRNAs function, KYSE-590 cells were transfected with a specific microRNA inhibitor for miR-210 (anti-miR-210) or its negative control RNA (anti-ncRNA) (Ambion) using HiPerFect transfection reagent.
RNA Extraction and Quantitative Reverse Transcriptase-PCR
Total RNA was extracted from the normal esophageal squamous tissues (NESTs), ESCCs, and cell lines by the acid guanidinium thiocyanate-phenol-chloroform method and then used for quantitative reverse transcriptase-PCR (qRT-PCR). To quantify mRNA expression levels, total RNA was reverse transcribed to cDNA using random primers and SuperScript II reverse transcriptase (Invitrogen), and quantitative PCR was performed in a 7300 Real-Time PCR System (Applied Biosystems) using Power SYBR Green PCR Master Mix (Applied Biosystems). Gene expression was quantified using standard curves that were generated using serially diluted reference samples and normalized to the expression level of glyceraldehyde-3-phosphate dehydrogenase (GAPDH). The specificity of the PCR products was confirmed by gel electrophoresis and a dissociation curve analysis. Primer sequences are shown in supplemental Table 1. To quantify the levels of miRNAs and RNA U6 small nuclear 2 (RNU6-2), we used TaqMan MicroRNA assays (Applied Biosystems), which detect mature miRNAs specifically, following the manufacturer's protocol. The miRNA expression level was normalized to the expression level of RNU6-2.
Assay of Cell Proliferation, Cell Cycle, and Cell Death
The WST-1 assay to measure cell proliferation and flow cytometric assays to analyze the cell cycle and cell death were performed with KYSE-170 cells at 48 h after transfection as described previously (15). Calculations for the analysis of the cell cycle were performed with ModFit software (BD Biosciences). The bromodeoxyuridine (BrdU) incorporation assay, which measures cell proliferation, was performed using the BrdU Cell Proliferation ELISA kit (Roche Applied Science) according to the manufacturer's instructions.
Microarray Analysis
Total RNA from KYSE-170 cells that had been transfected with either ncRNA or miR-210 was labeled and prepared for hybridization to a human Oligo chip 25k (Toray, Tokyo, Japan) using standard methods. The GEO database accession code of the microarray data obtained is GSE20637.
Immunoblot Analyses
Cells were homogenized and centrifuged. The resultant supernatant was subjected to SDS-PAGE, and the separated proteins were transferred electrophoretically onto a PVDF membrane. An anti-FGFRL1, NDUFA4, GPR177, or LRP5L antibody (Santa Cruz Biotechnology, Santa Cruz, CA) (1:100) was used as the primary antibody, respectively, and a horseradish peroxidase-conjugated IgG antibody (1:5,000) was used as the secondary antibody. The membranes were stained using an ECL kit according to the manufacturer's instructions. An anti-β-actin antibody (Sigma-Aldrich) (1:1,000) was used as a control.
Immunostaining
Sections of ESCC and NEST were stained with an anti-FGFRL1 antibody (Santa Cruz Biotechnology) and ChemMate ENVISION kit (Dako, Glostrup, Denmark).
Luciferase Reporter Assay
The 3′-UTRs of FGFRL1, WSB2, and GDI2 were isolated from cDNA from KTSE-170 cells. These 3′-UTRs and synthetic oligonucleotides of putative miR-210-target sites in the FGFRL1 3′-UTR ligated into the pGL3 basic luciferase expression (pGL3-Luc) vector (Promega, Madison, WI) at the 3′-end of the luciferase coding sequence (Luc), respectively. This pGL3-Luc vector containing 3′-UTR or miR-210 target sites and the pRL-TK internal control vector (Promega) were transfected into KYSE-170 cells using FuGENE HD transfection reagent (Roche Applied Science). Oligoribonucleotides for miR-210 or ncRNA were transfected 24 h after transfection of their vectors, and luciferase activity was measured 38 h after transfection of their vectors using the Dual Luciferase Reporter Assay system (Promega) according to the manufacturer's instructions.
Statistics
Results are expressed as the mean ± S.E. Student's t test was used to compare data between two groups. p values less than 0.05 were considered to be statistically significant. In Figs. 1C and 4E, each clinicopathologic parameter, with the exception of age, was evaluated using Pearson's χ2 test.
FIGURE 1.
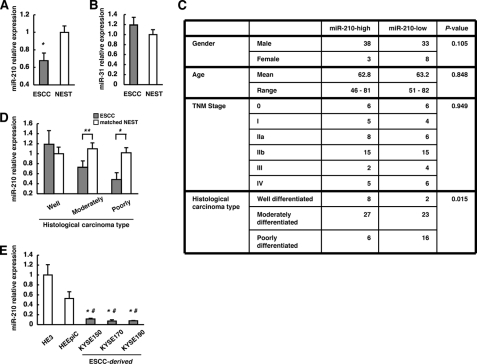
Down-regulation of miR-210 expression in ESCC. A and B, expression levels of miR-210 and miR-31 in NEST and ESCC assessed by qRT-PCR. The values are shown relative to the value obtained for NEST (n = 82; *, p < 0.01). C, clinicopathologic characteristics of 82 ESCCs divided into two groups (n = 41) on the basis of miR-210 expression levels. D, expression levels of miR-210 in the ESCCs and the corresponding NESTs in each histological type were compared by qRT-PCR. The values are shown relative to the value obtained for NEST in the well differentiated group (**, p < 0.05; *, p < 0.01). E, levels of miR-210 in HE3, HEEpiC, and KYSE cell lines analyzed by qRT-PCR. The values are shown relative to the value obtained for HE3 (n = 3; *, p < 0.05 versus HE3; #, p < 0.05 versus HEEpiC). Error bars, S.E.
FIGURE 4.
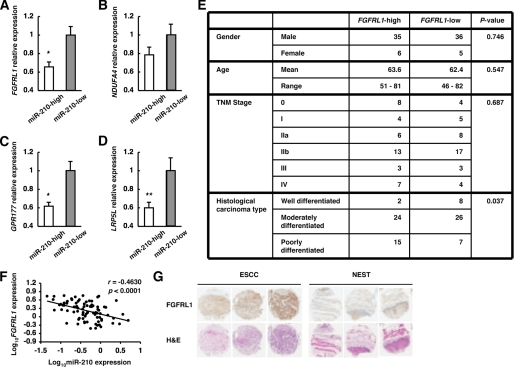
Identification of candidate target genes of miR-210 in ESCC. A–D, FGFRL1, NDUFA4, GPR177, and LRP5L expression levels in ESCCs divided into two groups on the basis of miR-210 expression levels were assessed by qRT-PCR. The values are shown relative to the value obtained for the miR-210-low group (n = 41; **, p < 0.05; *, p < 0.01). E, clinicopathologic characteristics of 82 ESCCs divided into two groups (n = 41) on the basis of FGFRL1 expression levels. F, plot of log10FGFRL1 relative expression intensity against log10miR-210 relative expression intensity. The line represents an approximated curve. The correlation coefficient (r) and the p value indicate the statistical significance of the negative correlation between the x and y variables. G, immunohistochemistry for FGFRL1 on ESCC and NEST. These sections were stained by anti-FGFRL1 antibody and by hematoxylin and eosin (H&E).
RESULTS
MiR-210 Expression Is Significantly Down-regulated in ESCC, Especially in Poorly Differentiated Carcinomas
To investigate the role of miR-210 in human malignancies, we first examined the expression levels of miR-210 in clinical samples of matched NEST and ESCC by qRT-PCR (Fig. 1A). Compared with NEST, a significant down-regulation of miR-210 expression was noted in ESCC. On the other hand, the expression of miR-31, which has been reported to be not altered between ESCC and NEST (16, 17), showed no significant difference (Fig. 1B). For further analysis, 82 clinical samples of ESCC were divided into two groups (miR-210-high and miR-210-low) on the basis of their miR-210 expression levels, and the clinicopathologic characteristics of these two groups were assessed. A significant difference was observed between the miR-210-high group and the miR-210-low group with respect to histological type (i.e. well, moderately, and poorly differentiated), but there were no significant differences between the two groups with respect to gender, age, or pathologic TNM stage (Fig. 1C). Then, we compared the expression levels of miR-210 between ESCC and the matched NEST for each histological type. Significant differences were observed between moderately and poorly differentiated ESCC and the matched NEST (Fig. 1D). Moreover, as the degree of tumor differentiation decreased, the level of miR-210 showed a corresponding decrease in the ESCC (p = 0.0875, ANOVA) but not in the matched NEST (p = 0.8728, ANOVA), which indicated a strong correlation between the level of miR-210 and the degree of tumor differentiation in ESCC. This observation appears to agree well with the previous finding that miR-210 expression is up-regulated in parallel with epithelial cell differentiation (3, 18). Furthermore, when we compared the levels of miR-210 expression in normal human esophageal epithelial cells (HE3 and HEEpiC) with those in ESCC cell lines (KYSE-150, -170, and -190), we found that miR-210 expression was down-regulated significantly in the ESCC cell lines (Fig. 1E).
MiR-210 Inhibits Cancer Cell Proliferation by Inducing Cell Death and Cell Cycle Arrest in G1/G0 and G2/M
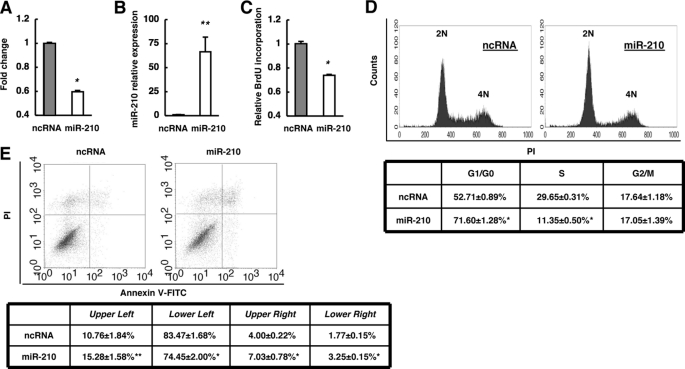
Next, we examined the functional role of miR-210 in ESCC by adding synthetic miR-210 to the KYSE-170 cell line, in which miR-210 expression is low (Fig. 1E). Given that miR-210 expression was correlated with the level of differentiation in ESCC (Fig. 1, C and D), we examined the effect of miR-210 on the proliferation of ESCC cells. Transfection of miR-210 significantly decreased the proliferation of cancer cells, whereas a ncRNA had no inhibitory effect (Fig. 2A). Then, the introduced amount of miR-210 in cells transfected with miR-210 was a >60-fold increase compared with ones in cells transfected with ncRNA (Fig. 2B), which is within the comparable range for the differences between normal human esophageal epithelial cells and KYSE-170 cells (Fig. 1E). Moreover, we performed a BrdU incorporation assay and found that miR-210 significantly reduced the uptake of BrdU (Fig. 2C). These results suggested that miR-210 negatively regulates cancer cell proliferation. Next, we examined the effect of miR-210 on the cell cycle (Fig. 2D). Transfection of miR-210 resulted in a significant increase in the proportion of cells in G1/G0 phase as well as a significant decrease in the proportion of cells in S phase, whereas the proportion of cells in G2/M phase was unaltered. These results indicate that miR-210 induces cell cycle arrest in both G1/G0 and G2/M phases because cell cycle arrest only in G1/G0 phase decreases the proportion of cells in G2/M phase. In addition, overexpression of miR-210 resulted in a significant increase in the proportion of FITC-annexin V-positive cells (Fig. 2E, upper right and lower right) and FITC-annexin V-negative/propidium iodide (PI)-positive cells (Fig. 2E, upper left), and a significant decrease in the proportion of FITC-annexin V-negative/PI-negative cells (Fig. 2E, lower left), which indicated that overexpression of miR-210 may lead to apoptosis and necrosis. Taken together, the results suggest that miR-210 may inhibit proliferation of ESCC cells mainly by inducing cell cycle arrest and apoptosis.
FIGURE 2.
Functions of miR-210 in KYSE-170 cells. A, effect of miR-210 on cell proliferation was investigated by the WST-1 assay. Cells were incubated for 48 h after transfection with either ncRNA or miR-210, and viability was evaluated. The values are shown relative to the value obtained with ncRNA. B, expression levels of miR-210 in cells at 48 h after transfection with either ncRNA or miR-210 were investigated by qRT-PCR. The values are shown relative to the value obtained with ncRNA. C, 48 h after transfection, cell proliferation was evaluated by BrdU incorporation. The values are shown relative to the value obtained with ncRNA. D, effects of miR-210 on the cell cycle were investigated. The PI-stained DNA content of the cells was evaluated using a FACScan flow cytometer at 48 h after transfection. E, at 48 h after transfection, cells were stained with FITC-conjugated annexin V, and PI and cell death was evaluated using a FACScan flow cytometer. n = 3; **, p < 0.05; *, p < 0.01 versus ncRNA.
Identification of Candidate Target Genes Degraded by MiR-210
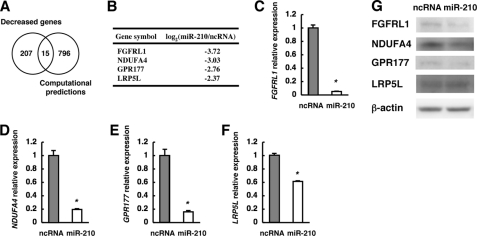
To investigate the molecular mechanism by which miR-210 inhibits ESCC cell proliferation, we analyzed the target genes of miR-210 in ESCC. We performed comprehensive transcriptome analysis using RNA from ESCC cells transfected with either ncRNA or miR-210. Assuming that the expression of target genes of miR-210 might be down-regulated in cells transfected with miR-210, we selected 222 genes whose expression was decreased by more than 5-fold in miR-210-transfected cells compared with ncRNA-transfected cells (supplemental Table 2). Fifteen of the 222 genes were predicted to be miR-210 target genes by the target prediction programs microcosm (2), TargetScan (19), and PicTar (20) (Fig. 3A and supplemental Tables 2 and 3). Four (FGFRL1, NDUFA4, GPR177, and LRP5L) of these 15 genes had a signal value of more than 50 in ncRNA-transfected cells (Fig. 3B and supplemental Table 2). Furthermore, their expression was confirmed by qRT-PCR and Western blotting; the mRNA expression of all four genes was significantly down-regulated by transfection of miR-210, although the degree of decrease of LRP5L was somewhat low (Fig. 3, C–F). The expression levels of FGFRL1, NDUFA4, and GPR177 proteins were also down-regulated by transfection of miR-210 (Fig. 3G). Meanwhile, the expression levels in LRP5L protein showed no change at 48 h after transfection of miR-210 (Fig. 3G). To validate these genes as targets of miR-210 further, we examined their expression in clinical ESCC samples. Of the four genes, the expression of FGFRL1, GPR177, and LRP5L was significantly down-regulated in the miR-210-high group compared with the miR-210-low group (Fig. 4, A, C, and D), whereas NDUFA4 was not significantly different between the two groups (Fig. 4B). We then divided the 82 ESCC samples into two groups (n = 41) on the basis of their FGFRL1, GPR177, or LRP5L expression levels and compared the two groups in terms of their clinicopathologic characteristics. A significant association with histological type was observed for the FGFRL1-classified groups (Fig. 4E), but not for the GPR177- or LRP5L-classified ones (data not shown), which agrees well with the finding that a decrease in miR-210 expression correlates well with the poorly differentiated state of ESCC. A statistically significant negative correlation was obtained between expression levels of miR-210 and that of FGFRL1 in ESCC (Fig. 4F). Furthermore, sections of ESCC and NEST were stained by immunohistochemistry for FGFRL1. The results indicated that FGFRL1 protein is expressed in ESCC and the expression levels are enhanced compared with NEST (Fig. 4G).
FIGURE 3.
Identification of candidate target genes degraded by miR-210 in KYSE-170 cells. A, Venn diagram showing overlapping sets of genes whose expression was decreased >5-fold by transfection of miR-210 and computationally predicted target genes of miR-210. B, list of four potential miR-210 target genes with a signal value of more than 50 in ncRNA-transfected cells upon microarray analysis. C–F, expression levels of the four potential miR-210 target mRNAs assessed by qRT-PCR. The values are shown relative to the value obtained with ncRNA (n = 3; *, p < 0.01). G, Western blot analyses of FGFRL1, NDUFA4, GPR177, LRP5L, and β-actin proteins.
MiR-210 Targets FGFRL1 3′-UTR Directly
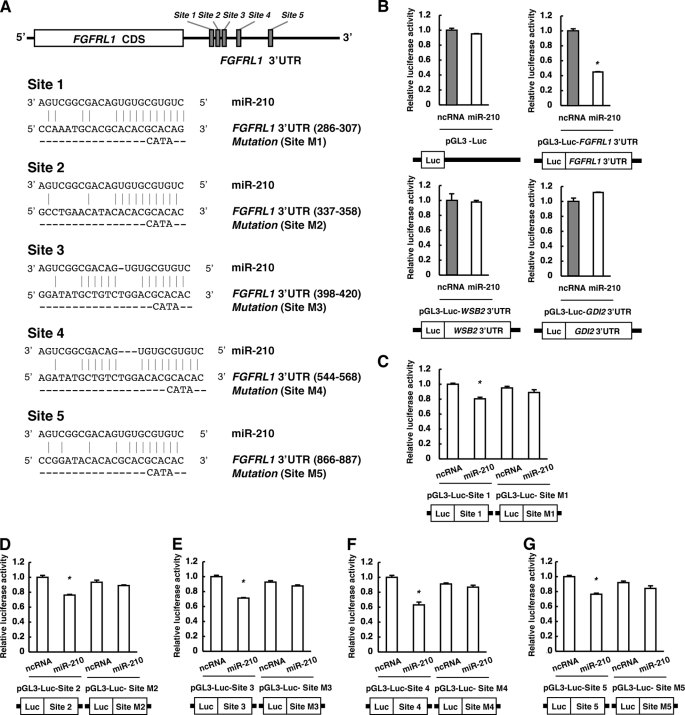
Five sites in the FGFRL1 3′-UTR are predicted to be potential target sites of miR-210 by microcosm (Fig. 5A), although none of them is conserved across species such as mouse, rat, and chicken. To examine whether FGFRL1 is a direct target of miR-210, we cloned the 3′-UTR of FGFRL1 into a pGL3-Luc vector (pGL3-Luc-FGFRL1 3′-UTR) to perform reporter assay. When miR-210 was transfected into the cells with this reporter construct but not the mock, luciferase activity was repressed more than 50% compared with transfection of ncRNA (Fig. 5B). Meanwhile, luciferase activities in cells transfected with reporter constructs containing the 3′-UTR of WSB2 or GDI2 were not repressed by the transfection of miR-210 (Fig. 5B). WSB2 and GDI2 were not included in either predicted target genes of miR-210 or 222 genes decreased in miR-210-transfected cells (supplemental Tables 2 and 3). These results suggest that FGFRL1 is a direct and robust target gene of miR-210 in ESCC. For further analysis, we cloned the each putative miR-210-target site or its point mutant in sequences corresponded to “seed sequence” of miR-210 into a pGL3-Luc vector (Fig. 5A) and performed reporter assays (Fig. 5, C–G). When miR-210 was transfected into the cells, luciferase activity was significantly repressed in all five sites. By contrast, when mutation was introduced in these sites, the repressions by miR-210 were completely abolished in all cases (Fig. 5, C–G). These results suggested that these five sites in the FGFRL1 3′-UTR are target sites of miR-210.
FIGURE 5.
Identification of miR-210 target sites in FGFRL1 3′-UTR. A, schematic diagram of potential miR-210-target sites in FGFRL1 3′-UTR. B–G, cells were transfected with either ncRNA or miR-210 at 24 h after transfection with the pGL3 luciferase expression vector containing 3′-UTR of each gene or candidate miR-210 target site in FGFRL1 3′-UTR. After 14 h, reporter luciferase activity was evaluated. The values are shown relative to the value obtained with ncRNA (n = 3; *, p < 0.01).
FGFRL1 Accelerates Cancer Cell Proliferation by Preventing Cell Cycle Arrest in G1/G0
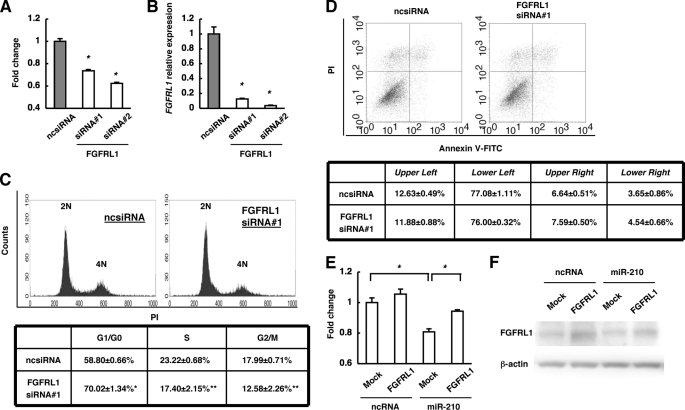
To investigate the roles of FGFRL1 in cancer cell proliferation, we first examined the effect of FGFRL1 knockdown by using two types of FGFRL1 siRNA. With both siRNAs, knockdown of FGFRL1 significantly decreased proliferation of ESCC cells, whereas a ncsiRNA had no inhibitory effect (Fig. 6A). The level of FGFRL1 expression was reduced to ∼10% of the original level with both siRNAs (Fig. 6B). Next, we examined the effects of FGFRL1 knockdown on the cell cycle (Fig. 6C). Knockdown of FGFRL1 resulted in a significant increase in the proportion of cells in G1/G0 phase and a decrease in that in S and G2/M phases. These results indicated that down-regulation of FGFRL1 induced cell cycle arrest in G1/G0. Down-regulation of FGFRL1 did not significantly change the proportions of FITC-annexin V-positive cells, FITC-annexin V-negative/PI-positive cells, and FITC-annexin V-negative/PI-negative cells, which indicated that FGFRL1 is not involved in apoptosis and necrosis (Fig. 6D). In contrast, overexpression of FGFRL1 with no 3′-UTR significantly reduced the inhibitory effect of miR-210 on cell proliferation (Fig. 6E). Then, expression levels of FGFRL1 proteins are actually increased in cells transfected with a FGFRL1 expression vector without the 3′-UTR of FGFRL1 (Fig. 6F). These findings suggest that FGFRL1 increases the proliferation of ESCC cells by inhibiting cell cycle arrest in G1/G0 phase.
FIGURE 6.
Functions of FGFRL1 in KYSE-170 cells. A, effect of FGFRL1 on cell proliferation was investigated by the WST-1 assay. Cells were incubated for 48 h after transfection with ncsiRNA, FGFRL1 siRNA1 or 2, and viability was evaluated. The values are shown relative to the value obtained with ncsiRNA (n = 3; *, p < 0.01 versus ncsiRNA). B, FGFRL1 expression levels in A were assessed by qRT-PCR. The values are shown relative to the value obtained with ncsiRNA (n = 3; *, p < 0.01 versus ncsiRNA). C, effects of FGFRL1 on the cell cycle were investigated. The PI-stained DNA content of the cells was evaluated using a FACScan flow cytometer at 48 h after transfection (n = 3; **, p < 0.05; *, p < 0.01 versus ncsiRNA). D, at 48 h after transfection, cells were stained with FITC-conjugated annexin V and PI, and cell death was evaluated using a FACScan flow cytometer (n = 3). E, cells were transfected with either ncRNA or miR-210 at 24 h after transfection with the FGFRL1 expression vector or mock. After 48 h, viability was evaluated. The values are shown relative to the value obtained with ncRNA and mock transfection (n = 3; *, p < 0.01). F, Western blot analyses of FGFRL1 and β-actin proteins in E are shown.
Endogenous MiR-210 Regulates Expression Levels of FGFRL1 and Cancer Cell Proliferation
To examine whether endogenous miR-210 regulates the expression levels of endogenous FGFRL1, we examined the effect of anti-miR-210 in KYSE-590 cells, which relatively highly expresses miR-210. The treatment by 2′-O-methylated antisense RNA of miR-210 significantly enhanced the expression levels of FGFRL1 mRNA and protein (Fig. 7A). Then, cancer cell proliferation was significantly increased (Fig. 7B). These results may indicate that miR-210 endogenously regulates the expression levels of FGFRL1 and cancer cell proliferation.
FIGURE 7.
Effects of functional inhibition of endogenous miR-210. A, effect of inhibition of endogenous miR-210 on FGFRL1 expression levels was assessed by qRT-PCR and Western blot analyses using KYSE-590 cells. Cells were incubated for 48 h after transfection with anti-ncRNA or anti-miR-210. The values are shown relative to the value obtained with anti-ncRNA (n = 3; **, p < 0.05 versus anti-ncRNA). B, cell viability in A was evaluated by the WST-1 assay. The values are shown relative to the value obtained with anti-ncRNA (n = 3; **, p < 0.05 versus anti-ncRNA).
DISCUSSION
In the present study, we showed for the first time that expression of miR-210 is down-regulated in ESCC cell lines as well as in clinical samples and that miR-210 induces cell cycle arrest and apoptosis in vitro, thus inhibiting the proliferation of cancer cells. Furthermore, we found that not only miR-210 expression was decreased in ESCC, but the degree of tumor differentiation corresponded well with the levels of miR-210 in clinical ESCC samples; thus, more poorly differentiated ESCCs exhibited less miR-210 expression. The results indicate that the level of miR-210 expression may serve as a clinical maker for the degree of tumor differentiation in vivo. We also examined whether the lower levels of miR-210 expression in poorly differentiated ESCC were related to the enhanced proliferation of such carcinomas, and we found that miR-210 acts as a tumor-suppressive miRNA in ESCC.
In contrast to our study, miR-210 was reported to be up-regulated in breast cancer, pancreatic tumors, and head and neck cancer and to be correlated with their poor outcome (21–24). Moreover, previous studies have shown that miR-210 inhibits apoptosis and bypasses cell cycle arrest in cancer cell lines such as MCF-7 and HCT116 Dicerex5 cells (25, 26). Thus, our finding appears to be different from the previous reports that miR-210 is up-regulated in cancer tissues and enhances cell survival. The reason for this apparent discrepancy is uncertain. A likely explanation in the function of miR-210 is that it is possible that the expression of miR-210 might only reflect the hypoxia status in these cases as a surrogate marker for tumor hypoxia because miR-210 is the most robustly induced miRNA under hypoxia (9, 25, 26). Additionally, the apparently discrepant results in cancer cell lines might be explained by cell type-specific differences in the expression levels of target genes of miR-210. The results of our transcriptome analysis on ESCC cells that expressed miR-210 ectopically supported this possibility because induction of miR-210 did not affect the expressions of CASP8AP2 and MNT (supplemental Table 2), which are target genes of miR-210 and induce apoptosis and cell cycle arrest, respectively (26, 27). Similar to our findings, Huang et al. have reported recently that miR-210 represses the initiation of tumor growth when human head and neck or pancreatic tumor cell lines that are expressing miR-210 ectopically are implanted into immunodeficient mice (10).
In the present study, we found that miR-210 is targeted to the FGFRL1 3′-UTR and suppresses FGFRL1 expression in ESCC. Five sites in the 3′-UTR of FGFRL1 were identified as target sites of miR-210. The repression in the FGFRL1 3′-UTR containing these five sites was considerably larger than that in each miR-210 target sites. These five miR-210 target sites in the FGFRL1 3′-UTR may function synergistically in the decrease in the FGFRL1 expression level. It has been actually reported that closely located multiple miRNA target sites in the 3′-UTR of a gene may function synergistically (28, 29). As suggested by the observation that overexpression of miR-210 in ESCC cells down-regulated expression of FGFRL1 more than that of the other predicted target genes, we found that FGFRL1 mRNA expression was down-regulated in the miR-210-high group of clinical samples and that the level of expression was correlated inversely with the degree of differentiation. Moreover, knockdown of FGFRL1 by siRNA inhibited ESCC cell proliferation, whereas overexpression of FGFRL1 effectively rescued the miR-210-induced suppression of ESCC cell proliferation. Together, these findings show that miR-210 might exert its tumor-suppressive effect in ESCC mainly by targeting FGFRL1. This conclusion was supported by a recent study showing that FGFRL1 could partially rescue the phenotype (suppression of tumor growth) caused by ectopic expression of miR-210 in tumor xenografts (10). However, targeting of FGFRL1 by miR-210 appears to explain only part of the action of miR-210: down-regulation of FGFRL1 arrested the cell cycle in G1/G0 phase, but not in G2/M phase, although miR-210 induced cell cycle arrest in both phases. Hence, miR-210-induced cell cycle arrest in G2/M phase and apoptosis might be regulated by other targets of miR-210. In fact, our transcriptome analysis identified several genes whose expression was regulated differentially by miR-210. Further studies are clearly required to understand fully the molecular mechanism of tumor suppression by miR-210.
In conclusion, the results of our present study show that miR-210 inhibits the proliferation of ESCC cells by inducing cell cycle arrest and apoptosis and that the effects of miR-210 are mediated mainly by the targeting of FGFRL1. Our data suggest that down-regulation of miR-210 might play an important role in the proliferation of ESCC and that miR-210 and FGFRL1 might serve as clinical markers for tumor differentiation and therapeutic targets of ESCC.
Supplementary Material
Acknowledgments
We thank T. Murai, K. Kodama and S. Yoshino for technical assistance.
This work was supported by grants from Kyoto University (to S. T.), the Takeda Science Foundation (to S. T.), the Ministry of Education, Culture, Sports, Science and Technology of Japan (to S. T. and G. T.), and the New Energy and Industrial Technology Development Organization (to G. T.).

The on-line version of this article (available at http://www.jbc.org) contains supplemental Tables 1–3.
The data reported in this paper have been deposited in the Gene Expression Omnibus (GEO) database, www.ncbi.nlm.nih.gov/geo (accession no. GSE20637).
- miRNA
- microRNA
- ESCC
- esophageal squamous cell carcinoma
- FGFRL1
- fibroblast growth factor receptor-like 1
- miR-210
- microRNA-210
- ncRNA
- negative control RNA
- ncsiRNA
- negative control small interfering RNA
- NEST
- normal esophageal squamous tissue
- PI
- propidium iodide
- qRT-PCR
- quantitative reverse transcriptase-PCR.
REFERENCES
- 1. Tsuchiya S., Okuno Y., Tsujimoto G. (2006) J. Pharmacol. Sci. 101, 267–270 [DOI] [PubMed] [Google Scholar]
- 2. Griffiths-Jones S., Grocock R. J., van Dongen S., Bateman A., Enright A. J. (2006) Nucleic Acids Res. 34, D140–D144 [DOI] [PMC free article] [PubMed] [Google Scholar]
- 3. Tsuchiya S., Oku M., Imanaka Y., Kunimoto R., Okuno Y., Terasawa K., Sato F., Tsujimoto G., Shimizu K. (2009) Nucleic Acids Res. 37, 3821–3827 [DOI] [PMC free article] [PubMed] [Google Scholar]
- 4. Volinia S., Calin G. A., Liu C. G., Ambs S., Cimmino A., Petrocca F., Visone R., Iorio M., Roldo C., Ferracin M., Prueitt R. L., Yanaihara N., Lanza G., Scarpa A., Vecchione A., Negrini M., Harris C. C., Croce C. M. (2006) Proc. Natl. Acad. Sci. U.S.A. 103, 2257–2261 [DOI] [PMC free article] [PubMed] [Google Scholar]
- 5. Zavadil J., Narasimhan M., Blumenberg M., Schneider R. J. (2007) Cells Tissues Organs 185, 157–161 [DOI] [PubMed] [Google Scholar]
- 6. Dow L. E., Elsum I. A., King C. L., Kinross K. M., Richardson H. E., Humbert P. O. (2008) Oncogene 27, 5988–6001 [DOI] [PubMed] [Google Scholar]
- 7. Joshi J., Fernandez-Marcos P. J., Galvez A., Amanchy R., Linares J. F., Duran A., Pathrose P., Leitges M., Cañamero M., Collado M., Salas C., Serrano M., Moscat J., Diaz-Meco M. T. (2008) EMBO J. 27, 2181–2193 [DOI] [PMC free article] [PubMed] [Google Scholar]
- 8. Karp C. M., Tan T. T., Mathew R., Nelson D., Mukherjee C., Degenhardt K., Karantza-Wadsworth V., White E. (2008) Cancer Res. 68, 4105–4115 [DOI] [PMC free article] [PubMed] [Google Scholar]
- 9. Giannakakis A., Sandaltzopoulos R., Greshock J., Liang S., Huang J., Hasegawa K., Li C., O'Brien-Jenkins A., Katsaros D., Weber B. L., Simon C., Coukos G., Zhang L. (2008) Cancer Biol. Ther. 7, 255–264 [DOI] [PMC free article] [PubMed] [Google Scholar]
- 10. Huang X., Ding L., Bennewith K. L., Tong R. T., Welford S. M., Ang K. K., Story M., Le Q. T., Giaccia A. J. (2009) Mol. Cell 35, 856–867 [DOI] [PMC free article] [PubMed] [Google Scholar]
- 11. Isohata N., Aoyagi K., Mabuchi T., Daiko H., Fukaya M., Ohta H., Ogawa K., Yoshida T., Sasaki H. (2009) Int. J. Cancer 125, 1212–1221 [DOI] [PubMed] [Google Scholar]
- 12. Thépot A., Hautefeuille A., Cros M. P., Abedi-Ardekani B., Pétré A., Damour O., Krutovskikh V., Hainaut P. (2010) Int. J. Cancer 127, 2051–2062 [DOI] [PubMed] [Google Scholar]
- 13. Sobin L., Wittekind. C. (2002) TNM Classification of Malignant Tumours, 6th Ed, pp. 60–64, John Wiley and Sons, New York [Google Scholar]
- 14. Ito T., Shimada Y., Kan T., David S., Cheng Y., Mori Y., Agarwal R., Paun B., Jin Z., Olaru A., Hamilton J. P., Yang J., Abraham J. M., Meltzer S. J., Sato F. (2008) Cancer Res. 68, 3214–3224 [DOI] [PMC free article] [PubMed] [Google Scholar]
- 15. Tanaka E., Hashimoto Y., Ito T., Kondo K., Higashiyama M., Tsunoda S., Ortiz C., Sakai Y., Inazawa J., Shimada Y. (2007) Clin. Cancer Res. 13, 1331–1340 [DOI] [PubMed] [Google Scholar]
- 16. Mathé E. A., Nguyen G. H., Bowman E. D., Zhao Y., Budhu A., Schetter A. J., Braun R., Reimers M., Kumamoto K., Hughes D., Altorki N. K., Casson A. G., Liu C. G., Wang X. W., Yanaihara N., Hagiwara N., Dannenberg A. J., Miyashita M., Croce C. M., Harris C. C. (2009) Clin. Cancer Res. 15, 6192–6200 [DOI] [PMC free article] [PubMed] [Google Scholar]
- 17. Ogawa R., Ishiguro H., Kuwabara Y., Kimura M., Mitsui A., Katada T., Harata K., Tanaka T., Fujii Y. (2009) Med. Mol. Morphol. 42, 102–109 [DOI] [PubMed] [Google Scholar]
- 18. Hino K., Tsuchiya K., Fukao T., Kiga K., Okamoto R., Kanai T., Watanabe M. (2008) RNA 14, 1433–1442 [DOI] [PMC free article] [PubMed] [Google Scholar]
- 19. Lewis B. P., Shih I. H., Jones-Rhoades M. W., Bartel D. P., Burge C. B. (2003) Cell 115, 787–798 [DOI] [PubMed] [Google Scholar]
- 20. Lall S., Grün D., Krek A., Chen K., Wang Y. L., Dewey C. N., Sood P., Colombo T., Bray N., Macmenamin P., Kao H. L., Gunsalus K. C., Pachter L., Piano F., Rajewsky N. (2006) Curr. Biol. 16, 460–471 [DOI] [PubMed] [Google Scholar]
- 21. Foekens J. A., Sieuwerts A. M., Smid M., Look M. P., de Weerd V., Boersma A. W., Klijn J. G., Wiemer E. A., Martens J. W. (2008) Proc. Natl. Acad. Sci. U.S.A. 105, 13021–13026 [DOI] [PMC free article] [PubMed] [Google Scholar]
- 22. Camps C., Buffa F. M., Colella S., Moore J., Sotiriou C., Sheldon H., Harris A. L., Gleadle J. M., Ragoussis J. (2008) Clin. Cancer Res. 14, 1340–1348 [DOI] [PubMed] [Google Scholar]
- 23. Greither T., Grochola L. F., Udelnow A., Lautenschläger C., Würl P., Taubert H. (2010) Int. J. Cancer 126, 73–80 [DOI] [PubMed] [Google Scholar]
- 24. Gee H. E., Camps C., Buffa F. M., Patiar S., Winter S. C., Betts G., Homer J., Corbridge R., Cox G., West C. M., Ragoussis J., Harris A. L. (2010) Cancer 116, 2148–2158 [DOI] [PubMed] [Google Scholar]
- 25. Kulshreshtha R., Ferracin M., Wojcik S. E., Garzon R., Alder H., Agosto-Perez F. J., Davuluri R., Liu C. G., Croce C. M., Negrini M., Calin G. A., Ivan M. (2007) Mol. Cell. Biol. 27, 1859–1867 [DOI] [PMC free article] [PubMed] [Google Scholar]
- 26. Zhang Z., Sun H., Dai H., Walsh R. M., Imakura M., Schelter J., Burchard J., Dai X., Chang A. N., Diaz R. L., Marszalek J. R., Bartz S. R., Carleton M., Cleary M. A., Linsley P. S., Grandori C. (2009) Cell Cycle 8, 2756–2768 [DOI] [PubMed] [Google Scholar]
- 27. Kim H. W., Haider H. K., Jiang S., Ashraf M. (2009) J. Biol. Chem. 284, 33161–33168 [DOI] [PMC free article] [PubMed] [Google Scholar]
- 28. Grimson A., Farh K. K., Johnston W. K., Garrett-Engele P., Lim L. P., Bartel D. P. (2007) Mol. Cell 27, 91–105 [DOI] [PMC free article] [PubMed] [Google Scholar]
- 29. Rajewsky N. (2006) Nat. Genet. 38, S8–S13 [DOI] [PubMed] [Google Scholar]
Associated Data
This section collects any data citations, data availability statements, or supplementary materials included in this article.


