Summary
Orange autofluorescence from lipofuscin in the lysosomes of the retinal pigment epithelium (RPE) is a hallmark of aging in the eye. One of the major components of lipofuscin is A2E, the levels of which increase with age and in pathologic conditions, such as Stargardt disease or age-related macular degeneration. In vitro studies have suggested that A2E is highly phototoxic and, more specifically, that A2E and its oxidized derivatives contribute to RPE damage and subsequent photoreceptor cell death. To date, absorption spectroscopy has been the primary method to identify and quantitate A2E. Here, a new mass spectrometric method was developed for the specific detection of low levels of A2E and compared to a traditional method of analysis. The new mass spectrometry method allows the detection and quantitation of approximately 10,000-fold less A2E than absorption spectroscopy and the detection and quantitation of low levels of oxidized A2E, with localization of the oxidation sites. This study suggests that identification and quantitation of A2E from tissue extracts by chromatographic absorption spectroscopyoverestimates the amount of A2E. This mass spectrometry approach makes it possible to detect low levels of A2E and its oxidized metabolites with greater accuracy than traditional methods, thereby facilitating a more exact analysis of bis-retinoids in animal models of inherited retinal degeneration as well as in normal and diseased human eyes.
Keywords: A2E, bis-retinoids, lipofuscin, mass spectrometry, oxidation
Introduction
One of the striking features of the aging eye is the accumulation of lipofuscin within the lysosomes of the retinal pigment epithelium (RPE). Lipofuscin is an autofluorescent, complex mixture composed of lipids, bis-retinoids,1, 2 and a minimal amount of protein,3 originating from the phagocytosis of the photoreceptor outer segments and incomplete degradation of the molecules.2 The increase of lipofuscin and subsequent RPE damage have been implicated in the pathogenesis of Stargardt disease4 and age-related macular degeneration.5 The bis-retinoid components of lipofuscin, some twenty now identified, have received considerable attention as they have been shown to produce RPE damage in vitro6-8 and to interfere with lysosomal degradation of lipids9 and proteins.10 A2E (Fig. 1) and iso-A2E (double bond at 13’ in the cis conformation) are major components of lipofuscin and were the first of the bis-retinoids to be identified and synthesized.11, 12 A2E can form in vivothrough the condensation of all-trans retinal, generated by the visual process, and phosphatidylethanolamine,13, 14 and it has clearly been identified in the human RPE.12, 15
Figure 1.
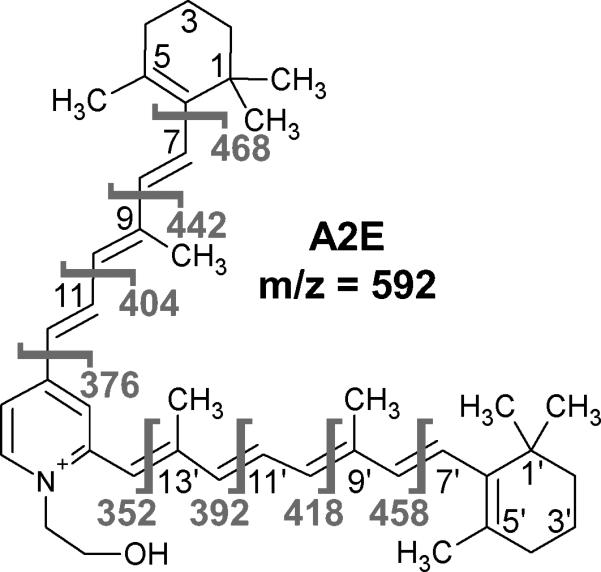
Structure of A2E with carbons labeled on each arm.Fragmentation of the molecule and the resulting masses of the larger fragment are shown in gray. The structure was produced using ACD/ChemSketch (Freeware) version 12.01 (Advanced Chemistry Development, Inc.).
A2E has been proposed to be toxic to RPE cells. Possible mechanisms include destabilization of cellular membranes, due to the amphiphilic nature of A2E,16, 17 and direct phototoxicity.6, 7 A2E-induced photodamage is specific to blue lightand dependent upon the concentration of A2E and the duration of light exposure.7 Blue-light damage appears to be due, at least in part, to oxidized species of A2E that form with blue-light irradiation.18-20 While A2E-induced phototoxicity has been demonstrated,6, 7 other reports do not regard A2E to be the principal phototoxic component in lipofuscin.21
Furthermore, there is growing evidence that A2E may play a protective role by removing all-trans retinal from the system. The generation of singlet oxygen on irradiation in human RPE cells is less efficient from A2E than from its precursor, all-trans retinal.22 Similarly, retinoic acid receptor activation, which is detrimental to photoreceptor survival, is considerably reduced with A2E as compared to all-trans retinal, again suggesting a detoxifying role for A2E.23
NMR spectroscopy and tandem mass spectrometry of oxidized A2E have provided evidence as to where the molecule becomes oxidized. When A2E is exposed to light and is chemically oxidized using metachloroperbenzoic acid, epoxides have been reported in up to nine positions along the carbon-carbon chains of A2E.20 Analysis of oxidized A2E from human lipofuscin determined that the molecule was oxidized in the 7, 8 position as an epoxide.24 However, further studies also suggested that oxidation of A2E extracted from human lipofuscin resulted in the formation of a 5, 8 monofuranoid and a 5, 8, 5’, 8’ bisfuranoid.25 By mass spectrometry alone, it is difficult to distinguish between a 7, 8 epoxide and a 5, 8 monofuranoid.25 Oxidized A2E, extracted from the RPE of aged humans and ABCR-/- mice was shown to be present as both the 5, 8 monofuranoid and the 5, 8 monoperoxide.26
While mass spectrometry has been used to detect and identify the oxidized forms of A2E,20, 24-26 identification and quantitation of A2E from cultured RPE cells and RPE tissue samples have mostly been based on its absorption at 430 nm.12, 17, 27, 28 This spectroscopic method does not distinguish between A2E and other coeluting molecules that absorb light in the 430 nm range, and the method necessitates that A2E be present in the picomole range. Likewise, data on the quantitation of oxidized A2E are limited.15, 18 A2E/iso-A2E are pyridinium salts carrying a positive charge which makes it particularly convenient for mass spectral analysis. We report here a quantitative mass spectrometric method for the specific analysis of low levels of A2E. Our results demonstrate that the analysis of A2E by absorption from HPLC chromatography may overestimate the amount present in tissue extracts. Additionally, our mass spectrometric method provides relative quantitation of the low level ofoxidized A2E produced duringanalysis and localization of the oxidation sites.
Experimental
Materials
The solvents used for the HPLC and mass spectrometry analyses [HPLC grade methanol, acetonitrile (MeCN), water, and formic acid (FA)] were obtained from Thermo Fisher Scientific (Waltham, MA). Trifluoroacetic acid (TFA) was purchased from Sigma-Aldrich (St. Louis, MO). A2E was synthesized as previously described12 from ethanolamine and all-trans retinal. The purity of the product was characterized by absorption spectrometry, NMR, and mass spectrometric analysis. The material (3 mM) was separated into aliquots and stored in 100% benzene at -80 °C under argon until it was analyzed. All samples were stored in light-tight containers and all subsequent sample and tissue preparation procedures were performed under dim red-light.
Tissues and tissue preparation
ABCR-/- mice were bred from pairs generously provided by Gabriel Travis; C57 black 6 mice were obtained from Harlan Laboratories (Indianapolis, IN). Mice were maintained and bred in the MUSC core animal facilities under 12 h light/12 h dark cyclic light conditions. Eyes of C57 mice (9 months of age, n = 4) and ABCR-/- mice (9 months of age, n = 9 and12 months of age, n = 6) were utilized. Human eyes from a 94-year-old donor (San Diego Eyebank, San Diego, CA) with no eye disease history were a generous gift from Anne Hanneken. Clinical examination of these eyes determined that the RPE was nicely pigmented. All animal procedures were designed and performed in accordance with the ARVO Statement for the Use of Animals in Ophthalmic and Vision Research and were approved by the Medical University of South Carolina Animal Care and Use Committee. The experiments with the human donor eye were approved by the Medical University of South Carolina Institutional Review Board.
The eyes were enucleated, and the anterior segment, the vitreous, and the retina were discarded. The remaining eyecups were stored at -80 °C under argon until used. A2E was extracted from the eyecups in 2 mL of 1:1 chloroform:methanol and 1 mL of PBS. The organic layer was separated, evaporated under argon, and stored at -80 °C. Before analysis, the samples were reconstituted in 100% MeOH, 0.1% TFA.
HPLC analysis and absorption spectroscopy of A2E
Synthetic A2E was solubilized in 100% MeOH, 0.1% TFA and various amounts (10-3000 pmol) were injected to establish the retention time of A2E and for the production of a standard curve. The calibration curve was linear up to 500 pmol of injected A2E. Synthetic A2E and eyecup extracts were injected on a Breeze 2 HPLC system (Waters, Milford, MA) with a 15 cm, 4.6 mm, C18 column containing Atlantis dC18 resin (Waters) and were separated with a gradient of 85% to 100% mobile phase B (100% MeCN, 0.1% TFA) over 15 minutes followed by100% mobile phase B for the next 25 minutes at a flow rate of 0.8 mL/min. Eluted analytes were detected at 430 nm with a photodiode array (PDA) detector that also recorded their spectra from 250 to 600 nm. The HPLC fractions containing the A2E peak were collected and either analyzed immediately by mass spectrometry, or dried down and stored at -80 °C for later analysis. Origin software version 6.0 (Microcal Software, Inc., Northampton, Massachusetts) was used to determine the area under the curve (AUC) for A2E and iso-A2E. The amount of A2E/iso-A2E in the sample was determined by comparing this AUC to the standard curve generated with known amounts of synthetic A2E.
Mass spectrometry
Prior to mass spectrometric analysis, the samples (synthetic A2E and HPLC fractions of A2E from eyecup extracts) were serially diluted. Synthetic A2E was diluted to a concentration of 0.5 nmol/μL with 100% MeOH, 0.1% TFA and further diluted to obtain concentrations of 0.5 to 50 fmol/μL. The samples from ABCR-/- mice were diluted to obtain solutions of approximately 10 fmol/μL. The human sample was reconstituted in 100% MeOH, 0.1% TFA and then serially diluted to obtain solutions of approximately 25 fmol/μL and 5 fmol/μL. The final solvent composition of all diluted samples was 85% MeOH, 0.1% TFA. Samples from C57 mice were analyzed without dilution from the HPLC eluent.
Liquid chromatography tandem mass spectrometry (LC-MS/MS) analysis was performed on an Ultimate nano-HPLC pump (Dionex/LC Packings) in-line with an LTQ XL ion trap mass spectrometer (Thermo Fisher Scientific) operated in positive ion mode. Samples were manually injected into a 2 μL loop using an aluminum-foil-covered syringe to minimize light exposure and loaded onto a 12 cm, 75 μm, column packed with Atlantis dC18 resin (Waters) with 85% mobile phase B (100% MeCN, 0.2% FA) and 15% mobile phase A (100% water, 0.2% FA). The samples eluted over a 75 minute gradient, which was maintained at 85% mobile phase B for the first 35 minutes, ramped to 100% mobile phase B over 15 minutes, and maintained at 100% mobile phase B for 25 minutes, and analytes were ionized by electrospray ionization. An MS scan was performed in selected ion monitoring (SIM) mode to detect ions with mass-to-charge ratios (m/z) in the ranges of i) 587.45-597.45, ii) 603.45-613.45, and iii) 619.45-629.45, followed by collision-induced dissociation (CID) of selected ions (m/z = 592.45; 608.45; 624.45; and 622.45) at 20% collision energy for MS/MS analysis. Blanks were run in between samples to limit carryover.
Analysis and quantitation of mass spectrometry data
Mass spectra were analyzed using XCaliburQual Browser version 2.0.7 (Thermo Fisher Scientific). Interpretation of the MS/MS fragmentation patterns was aided by the use of ChemSketch version 12.01 (Advanced Chemistry Development, Toronto, Ontario, Canada). For quantitation of A2E, the AUC was determined from extracted ion chromatograms (XIC) of the A2E fragment ion of m/z 418, which was the most prominent ion in the MS/MS spectra of A2E. To produce a standard curve for absolute quantitation, various amounts of synthetic A2E (5 – 100 fmol) were analyzed in triplicate. The amount of A2E in eyecup extracts was determined by comparing AUCs for the fragment ion of m/z 418 to the standard curve. For relative quantitation of A2E oxides, the AUC was determined from the XICs of the ions of interest (m/z 592 for A2E and m/z 608 for singly-oxidized A2E). The percent of oxidation was determined by comparing the AUC for singly-oxidized A2E to total A2E (A2E plus singly-oxidized A2E). Absolute values of A2E were not corrected for the percent of oxidized A2E observed.
Results
Quantitation of A2E by mass spectrometry
In the present work, a mass spectrometry approach was developed to specifically quantify levels of A2E. This approach is advantageous to traditional spectroscopic techniques because it has high sensitivity and does not rely on absorbance, which is indiscriminate of A2E and other components of the RPE extracts that share a 430 nm absorbance. Mass spectrometry data are normally collected by sampling the eluent of the HPLC during the chromatographic gradient, to determine the mass profile within a specified mass range at any given retention time (full-scan MS mode). In addition, individual ions can be selected in this profile and fragmented by collision-induced dissociation (CID) in a tandem mass spectrometry experiment (MS/MS mode), which provides unique and specific information on the composition of the selected ion (MS/MS mode). In our mass spectrometry-based approach, identification of A2E was accomplished via its expected m/z of 592.5 and predicted fragmentation pattern (Fig. 1).
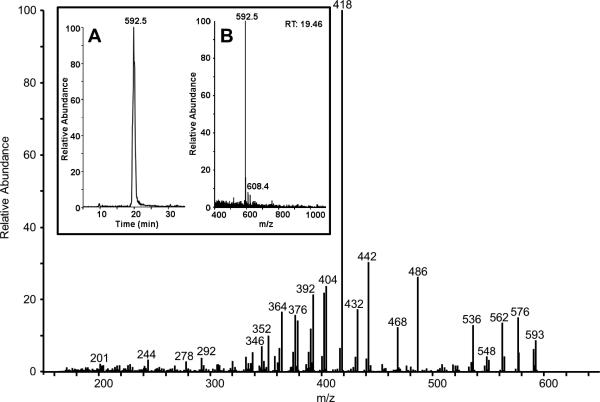
Analysis of A2E from ABCR-/-mouse eyecup extracts in full-scan MS mode produces an extracted ion chromatogram (XIC) from 5 – 35 minutes (Fig. 2, inset A) and a corresponding mass spectrumindicating the most abundant ion at m/z 592.5 (Fig. 2, inset B). MS/MS fragmentation of this ion by CID produced a fragmentation pattern (Fig. 2) that matched both the predicted pattern and the pattern seen with synthetic A2E. This established the detection of A2E, specifically. Figure 2 shows that the product ion of m/z 418 is the most abundant fragment ion in the tandem mass spectrum. This was also the case when various amounts of synthetic A2E (1 to 100 fmol) were fragmented.
Figure 2.
Tandem mass spectrum of approximately 100 fmol of A2E from a diluted HPLC fraction of A2E from an ABCR-/- mouse (12 months of age) eyecup preparation, m/z 592 selected. Within the inset, A) is an extracted ion chromatogram of m/z 592.5 and B) is a mass spectrum of the fraction taken at 19.46 minutes.
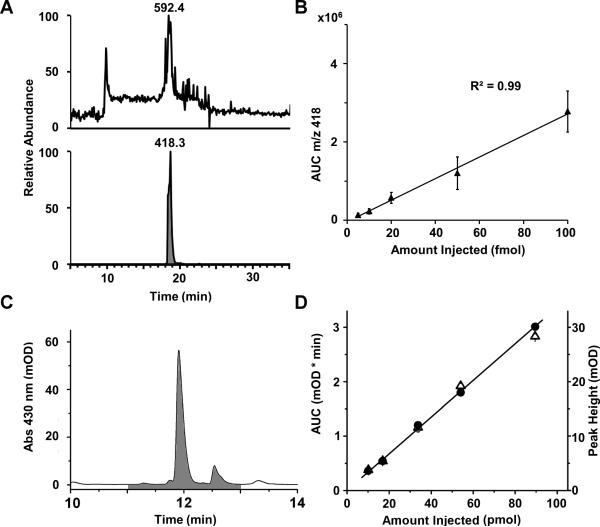
Quantitative analysis of A2E was accomplished by selected ion monitoring (SIM) – a method of analysis that enhances sensitivity in the MS mode by focusing on specific analytes of interest (selected ions) – and subsequent fragmentation of A2E and its oxides in MS/MS mode.Since A2E fragmentation reproducibly provided an intense fragment ion of m/z 418, A2E was quantified by taking the AUC from an XIC of this fragment ion. Quantitation in this manner (MS/MS mode) was advantageous compared to quantitation in the MS mode (using the AUC from an XIC of m/z 592.5). Figure 3 provides an example of this. The upper trace (Fig. 3A) shows the XIC of m/z 592.5 in the MS mode, indicating that at 1 fmol, the A2E signal is barely above the noise. However, high quality MS/MS spectra are still collected. This is reflected by the lower trace (Fig. 3A), which shows that the XIC for the m/z 418 fragment ion is a well-resolved chromatographic peak. To determine the absolute amount of A2E in eyecup extracts, a standard curve was produced by calculating the AUC of the m/z 418 fragment ion from various amounts of synthetic A2E (Fig. 3B). Thus, the method developed for the quantitation of A2E is both specific and sensitive.
Figure 3.
Detection and absolute quantitation of A2E via mass spectrometry and HPLC. Within A), the top panel shows the extracted ion chromatogram (XIC) from the mass spectrometry analysis of 1 fmol of synthetic A2E (m/z 592). The bottom panel shows an XIC for the most intense fragment ion produced from collision induced dissociation of A2E (the ion of m/z 418). B) Determination of the area under the curve (AUC) for various amounts of synthetic A2E using the method illustrated in (A, bottom), produced a standard curve that enabled absolute, specific quantitation of A2E. Error bars represent standard error. C) An HPLC chromatogram from the analysis of 300 pmol of synthetic A2E shows the identification of A2E at 430 nm. The shaded region represents the AUC used for quantitation (after baseline subtraction). D) Determination of the AUC for various amounts of synthetic A2E produced a standard curve that enabled absolute quantitation of A2E via HPLC analysis. The filled circles represent AUC, and the open triangles represent peak height.
Comparison of quantitation by mass spectrometry and absorption spectroscopy
In order to put this new method into greater perspective, the quantitative mass spectrometric approach was compared to traditional quantitation of A2E via absorption spectroscopy from the same murine eyecup extracts. As a first step, various amounts of synthetic A2E were analyzed by HPLC absorption spectroscopy (Fig. 3C) to produce a standard curve via the AUC of the A2E peak (Fig. 3D). The second step was to analyze organic extracts from the same eyecups of C57 and ABCR-/- mice by HPLC absorption spectroscopy and mass spectrometry. To achieve this, the A2E peak (including the iso-A2E peak) was collected as it eluted from the HPLC and subsequently analyzed by the mass spectrometry approach developed here.
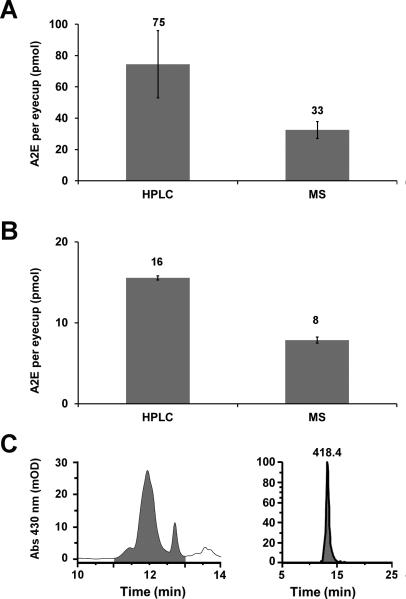
Figure 4 compares the quantitation of A2E from the same murine eyecups by the two different methods. Two mouse strains were used.ABCR-/- mice, which represent the Stargardt disease model where A2E is highly abundant,29 and C57 black 6 mice, which represent a wildtype phenotype commonly used in biological studies.It should be noted that the two mouse models are not on the same genetic background as a direct comparison of the two models was not the purpose of this study.In both theABCR-/- mice (Fig. 4A) and the C57 mice (Fig. 4B), the levels of A2E quantified by HPLC were approximately two-fold higher than the levels quantified by mass spectrometry. HPLC absorption spectroscopy of the ABCR-/-samples yields an A2E peak with a small shoulder on the leading side of the peak (Fig. 4C, left panel) indicating that multiple components of lipofuscin within the chloroform/methanol extract may co-elute and share a similar absorbance with A2E. This shoulder is not seen in the A2E peak used for mass spectrometry quantitation (Fig 4C, right panel). These results demonstrate that quantitation of A2E via its retention time and absorbance may overestimate the amount of A2E and that the mass spectrometry approach provides a quantitative method specific for A2E.
Figure 4.
Comparison of A2E quantitation via HPLC and mass spectrometry analyses.Quantitation of A2E from A)ABCR-/- mouse (9 months of age) and B) C57 mouse (9 months of age)eyecup preparations by HPLC (left column) or mass spectrometry (right column) analyses. The number above each bar represents the number of picomoles per eyecup determined for each sample.C) Representative peaks from which the AUC (shaded regions) was determined for quantitation of A2E from ABCR-/- samples via HPLC (left) or mass spectrometry (right).Samples were analyzed in triplicate. Error was calculated as standard deviation.
A2E oxidation during sample processing
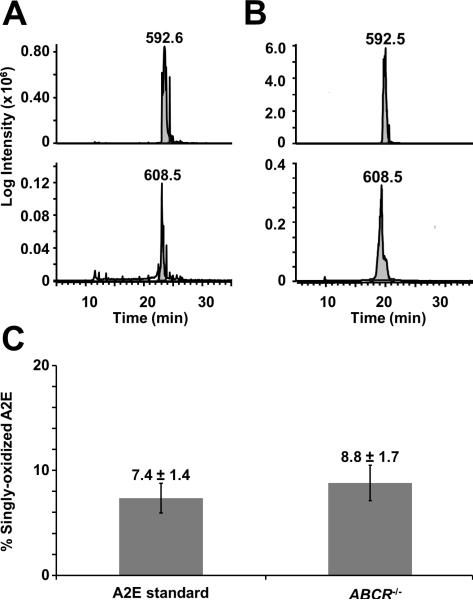
During mass spectrometric analysis, ions of m/z 608 and m/z 624 were observed in the A2E samples. The high quality of the collected MS/MS spectra confirmed that these peaks represented singly- and doubly-oxidized A2E. Relative quantitation of oxidized A2E in the different samples revealed that both synthetic A2E and ABCR-/- mouse samples contained approximately 8% of singly-oxidized A2E (Fig. 5). Since collected A2E peaks and synthetic A2E were analyzed, these results demonstrate that A2E can become oxidized during sample handling. This small amount of oxidation will not significantly alter the determined absolute values for A2E, as the standards were also oxidized to the same extent.
Figure 5.
Relative quantitation of oxidized A2E. Extracted ion chromatograms from LC-MS/MS analysis of A) 100 fmol of synthetic A2E and B) approximately 1000 fmol of A2E from a diluted A2E HPLC fraction from an ABCR-/- mouse (12 months of age) eyecup preparation were used to determine the area under the curve (AUC) for unoxidized A2E (m/z = 592, top panel of A and B) and singly-oxidized A2E (m/z = 608, bottom panel of A and B). C) Relative quantitation of oxidized A2E was determined by comparing the AUC for oxidized A2E to the combined AUC for oxidized and unoxidized A2E. Numbers on top of the bars represent the percent of singly-oxidized A2E from samples containing synthesized A2E or A2E obtained from the ABCR-/- samples. Error was calculated as standard deviation.
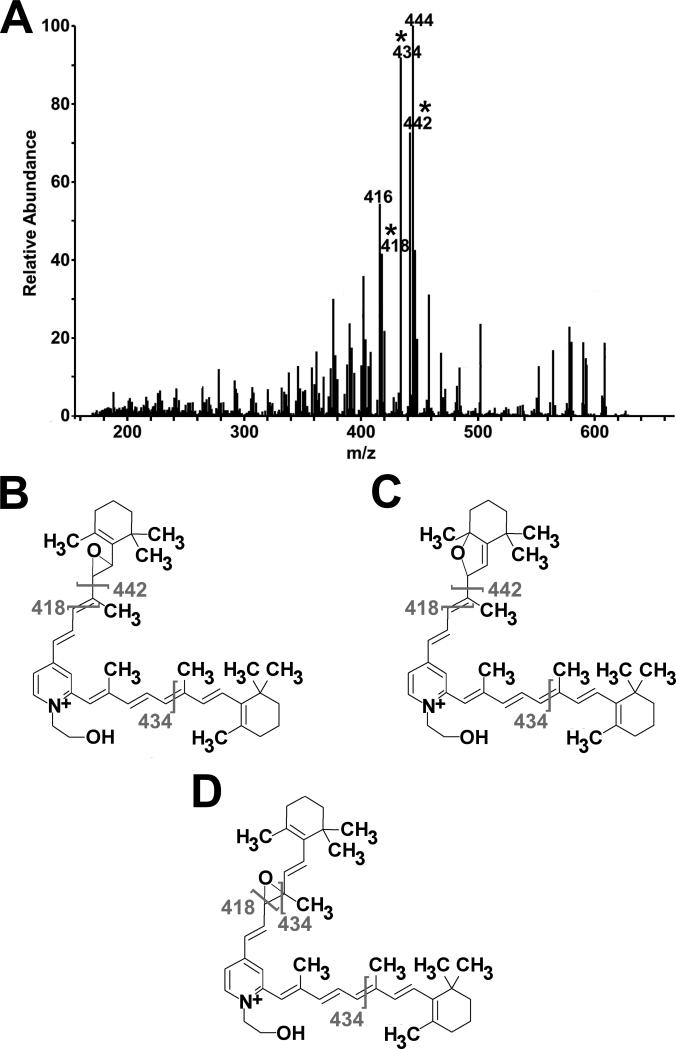
The fragmentation patterns observed for the singly-oxidized form of A2E from synthetic A2E (Fig. 6A) and the ABCR-/- mouse samples (Supp. Fig. 1A) differed from the published fragmentation pattern observed for singly-oxidized A2E from a human sample.24 MS/MS analysis of singly-oxidized A2E from the RPE extract of normal 94 year male eyecup (Supp. Fig. 1B) produced a fragmentation pattern that is consistent with the findings of Avalle et al. 200424, Jang et al., 200526, and Dillon et al., 200425, supporting an epoxide in the 7, 8 or 7’, 8’ position or a monofuranoid in the 5, 8 or 5’, 8’ position.24-26 Therefore, the differences observedin theABCR-/- mouse and synthetic A2E samples are attributed to changes in the location of the oxygen. In synthetic A2E, the fragmentation pattern suggests that a portion of the oxidized molecules have the oxygen in the 7, 8 or 7’, 8’ epoxide position or in the 5, 8 or 5’, 8’monofuranoid position (Fig 6. B and C) but that the majority have the oxygen in the 9, 10 or 9’, 10’ epoxide position (Fig. 6. D). The fragmentation pattern for oxidized A2E from the ABCR-/- mice also suggests that the oxygens are in a mixture of locations. In this case, the majority of the oxidized A2E molecules are epoxides at the 7, 8 or 7’, 8’ or monofuranoids at the 5, 8 or 5’,8’ position, and a smaller portion are epoxides in the 9, 10 or 9’, 10’ position. These results testify that during sample handling, A2E can become oxidized at multiple sites.
Figure 6.
Oxidation of A2E occurs during sample handling. A) MS/MS spectrum of singly-oxidized A2E (m/z = 608) from 100 fmol of synthetic A2E standard. Asterisks indicate fragment ions for which potential structures are shown in panels B-D. As the ions present in the tandem mass spectrum can be produced when the oxygen is in three different locations, the fragmentation pattern of singly-oxidized A2E supports three sites of oxidation, B) a 7, 8 epoxide, C) a 5, 8 monofuranoid, and D) a 9, 10 epoxide. In these structures, placement of the oxygen on the short arm of A2E was done for simplicity; it is likely that the oxygen also occurs on the long arm.
Discussion
Lipofuscin contains many fluorescent compounds, of which A2E is only one. The identification and quantitation of A2E from lipofuscin is normally based on its absorption at 430 nm.12, 17, 27, 28 The mass spectrometry approach developed here provides a method that is specific for A2E, as it is identified based on its expected m/z ratio, retention time, and MS/MS fragmentation pattern, a more stringent set of characteristics than absorbance. Furthermore, the method also allows quantitation of A2E at much lower levels (femtomole) than do the traditional approaches (1 – 10 picomoles), allowing the determination of A2E levels lower than those found in a single wild type mouse eyecup. The increase in sensitivity by at least three orders of magnitude was achieved by three innovations – the utilization of a highly sensitive LTQ-XL instrument online with a nano-LC chromatographic system; the use of SIM instead of full MS scans; and quantitation based on MS/MS fragment ions.
Comparison of A2E quantitation via mass spectrometry and traditional absorption spectroscopy suggests that the levels of A2E may be overestimated by the latter method. In two different mouse models (Fig. 4), the levels of A2E determined were approximately two-fold higher by HPLC absorption spectroscopy compared to mass spectrometry quantitation. These results suggest that while A2E is a predominate molecule in lipofuscin with an absorbance of 430 nm, other molecules that share this absorbance may also be present in lipofuscin, as indicated by spectroscopic studies of lipofuscin and A2E.30 Even with HPLC separation, components with 430 nm absorption may co-elute with A2E, an idea supported by the observations of a shoulder on the leading side of the A2E peak in HPLC analysis (Fig. 4C, left panel). A recent molecular tissue-imaging study shows that the correlation of lipofuscin fluorescence and A2E abundance was higher when the amount of A2E increased (unpublished observation). This also suggests the presence of other molecules with a 430 nm absorbance in lipofuscin. As quantitation of A2E by mass spectrometry is more specific than by absorption alone, the data indicate that traditional quantitation of A2E could overestimate its presence in tissue or cellular extracts.
In this study, A2E from the chloroform-methanol soluble RPE extract was quantitated; however, a fraction of the RPE remains insoluble in chloroform-methanol. This insoluble fraction increases with age and retains photoreactivity.31 While A2E is a hydrophobic molecule and established methods for its analysis use the organic soluble RPE extract,15, 18, 24-28 it may be possible that some forms of A2E remain in the insoluble fraction. At present, this A2E is inaccessible to our analysis; however, the mass spectrometry method presented here is potentially applicable to the insoluble fraction as well. To analyze the insoluble fraction, new methods of solubilizationand chromatography are required. Mass spectrometry compatible detergents may be useful for this purpose.
During our mass spectrometric analyses, a small amount (approximately 8%) of oxidized A2E was observed in all samples (Fig. 5), even in synthetic A2E. It is likely that the observed oxidation occurred as a result of sample handling or the electrospray ionization itself. Additionally, it is likely that forms of A2E oxidized in vivo elute prior to A2E;23 thus, they would be excluded from the fraction that was analyzed in our study. The above results show that this low amount of oxidation cannot be biologically significant, and that similar low levels of oxidation in biological samples cannot be attributed to in vivo oxidation.
The high quality of our tandem mass spectra permitted identification of the sites of oxidation for singly-oxidized A2E. While the fragmentation pattern of singly-oxidized A2E from the 94-year-old human sample (Supp. Fig 1B) was consistent with that previously published,24-26 a different fragmentation pattern was observed for A2E from ABCR-/- mice samples (Supp. Fig 1A) and synthesized A2E (Fig. 6A). In synthesized A2E, it appears that the oxygen is in a mixture of locations, primarily the 9, 10 or 9’, 10’ epoxide position. However, in the ABCR-/- mouse sample, the oxygen appears to be located mainly at the 7, 8 or 7’, 8’ position as an epoxide or at the 5, 8 or 5’, 8’ position as a monofuranoid, the locations suggested by published human data24-26 and by the human data analyzed here. These observations are consistent with the idea that there are multiple parallel sites of oxidation that can occur during sample handling.
Conclusions
In summary, proper analysis and quantitation of A2E requires an approach that is specific for this molecule. The mass spectrometric approach developed here not only provides specific identification of A2E based on its expected m/z, retention time, and fragmentation pattern, but also detects A2E in the low femtomole range. Furthermore, this analysis also enables identification of the oxidized forms of A2E and their relative quantitation. In the future, this method will make it possible to detect A2E levels from eyecups of different models of genetic disorders as well as normal and diseased human eyes with great accuracy. It will also allow the determination of sites of oxidation in vivo to understand how A2E oxidation is changing qualitatively and quantitatively with age and as a result of disease.
Supplementary Material
Supplementary Figure 1.Oxidation of A2E occurs during sample handling. A) A tandem mass spectrum of oxidized A2E (m/z = 608) from a diluted (50 fmol/μL) A2E HPLC fraction from an ABCR-/- mouse (12 months of age) eyecup preparation. B) A tandem mass spectrum of oxidized A2E (m/z = 608) from a diluted (50 fmol/μL) A2E HPLC fraction from a 94-yr-old human eyecup sample.
Acknowledgements
This study was supported by grants from NIH EY004939 (RKC), EY020661 (ZA/RKC); EY014850 (YK) and an unrestricted award to the Department of Ophthalmology at MUSC from Research to Prevent Blindness (RPB; New York); RKC is a RPB Senior Scientific Investigator. Additionally, we would like to thank Jennifer Bethard for technical assistance. The mass spectrometry work was performed in the MUSC Mass Spectrometry Shared Resource Facility.Experimental animals were housed in a facility constructed with support from the National Institutes of Health, Grant Number C06 RR015455 from the Extramural Research Facilities Program of the National Center for Research Resources.
Abbreviations
- ABCR
ATP binding cassette transporter
- AUC
area under the curve
- FA
formic acid
- CID
collision-induced dissociation
- MS/MS
tandem mass spectrometry
- m/z
mass to charge ratio
- RPE
retinal pigment epithelium
- SIM
selected ion monitoring
- TFA
trifluoroacetic acid
- XIC
extracted ion chromatogram
References
- 1.Ben-Shabat S, Parish CA, Hashimoto M, Liu J, Nakanishi K, Sparrow JR. Fluorescent pigments of the retinal pigment epithelium and age-related macular degeneration. Bioorg Med Chem Lett. 2001;11:1533–1540. doi: 10.1016/s0960-894x(01)00314-6. [DOI] [PubMed] [Google Scholar]
- 2.Sparrow JR, Fishkin N, Zhou J, et al. A2E, a byproduct of the visual cycle. Vision Res. 2003;43:2983–2990. doi: 10.1016/s0042-6989(03)00475-9. [DOI] [PubMed] [Google Scholar]
- 3.Ng KP, Gugiu B, Renganathan K, et al. Retinal pigment epithelium lipofuscin proteomics. Molecular & Cellular Proteomics. 2008;7:1397–1405. doi: 10.1074/mcp.M700525-MCP200. [DOI] [PMC free article] [PubMed] [Google Scholar]
- 4.Delori FC, Dorey CK, Staurenghi G, Arend O, Goger DG, Weiter JJ. In vivo fluorescence of the ocular fundus exhibits retinal pigment epithelium lipofuscin characteristics. Invest Ophthalmol Vis Sci. 1995;36:718–729. [PubMed] [Google Scholar]
- 5.Sparrow JR, Boulton M. RPE lipofuscin and its role in retinal pathobiology. Exp Eye Res. 2005;80:595–606. doi: 10.1016/j.exer.2005.01.007. [DOI] [PubMed] [Google Scholar]
- 6.Schutt F, Davies S, Kopitz J, Holz FG, Boulton ME. Photodamage to human RPE cells by A2-E, a retinoid component of lipofuscin. Invest Ophthalmol Vis Sci. 2000;41:2303–2308. [PubMed] [Google Scholar]
- 7.Sparrow JR, Nakanishi K, Parish CA. The lipofuscin fluorophore A2E mediates blue light-induced damage to retinal pigmented epithelial cells. Invest Ophthalmol Vis Sci. 2000;41:1981–1989. [PubMed] [Google Scholar]
- 8.Suter M, Reme C, Grimm C, et al. Age-related macular degeneration. The lipofusion component N-retinyl-N-retinylidene ethanolamine detaches proapoptotic proteins from mitochondria and induces apoptosis in mammalian retinal pigment epithelial cells. J Biol Chem. 2000;275:39625–39630. doi: 10.1074/jbc.M007049200. [DOI] [PubMed] [Google Scholar]
- 9.Lakkaraju A, Finnemann SC, Rodriguez-Boulan E. The lipofuscin fluorophore A2E perturbs cholesterol metabolism in retinal pigment epithelial cells. Proc Natl Acad Sci U S A. 2007;104:11026–11031. doi: 10.1073/pnas.0702504104. [DOI] [PMC free article] [PubMed] [Google Scholar]
- 10.Eldred GE. Lipofuscin fluorophore inhibits lysosomal protein degradation and may cause early stages of macular degeneration. Gerontology. 1995;41(Suppl 2):15–28. doi: 10.1159/000213722. [DOI] [PubMed] [Google Scholar]
- 11.Eldred GE, Lasky MR. Retinal age pigments generated by self-assembling lysosomotropic detergents. Nature. 1993;361:724–726. doi: 10.1038/361724a0. [DOI] [PubMed] [Google Scholar]
- 12.Parish CA, Hashimoto M, Nakanishi K, Dillon J, Sparrow J. Isolation and one-step preparation of A2E and iso-A2E, fluorophores from human retinal pigment epithelium. Proc Natl Acad Sci U S A. 1998;95:14609–14613. doi: 10.1073/pnas.95.25.14609. [DOI] [PMC free article] [PubMed] [Google Scholar]
- 13.Ben-Shabat S, Parish CA, Vollmer HR, et al. Biosynthetic studies of A2E, a major fluorophore of retinal pigment epithelial lipofuscin. J Biol Chem. 2002;277:7183–7190. doi: 10.1074/jbc.M108981200. [DOI] [PubMed] [Google Scholar]
- 14.Liu J, Itagaki Y, Ben-Shabat S, Nakanishi K, Sparrow JR. The biosynthesis of A2E, a fluorophore of aging retina, involves the formation of the precursor, A2-PE, in the photoreceptor outer segment membrane. J Biol Chem. 2000;275:29354–29360. doi: 10.1074/jbc.M910191199. [DOI] [PubMed] [Google Scholar]
- 15.Bhosale P, Serban B, Bernstein PS. Retinal carotenoids can attenuate formation of A2E in the retinal pigment epithelium. Arch Biochem Biophys. 2009;483:175–181. doi: 10.1016/j.abb.2008.09.012. [DOI] [PMC free article] [PubMed] [Google Scholar]
- 16.Sparrow JR, Cai B, Jang YP, Zhou J, Nakanishi K. A2E, a fluorophore of RPE lipofuscin, can destabilize membrane. Adv Exp Med Biol. 2006;572:63–68. doi: 10.1007/0-387-32442-9_10. [DOI] [PubMed] [Google Scholar]
- 17.Sparrow JR, Parish CA, Hashimoto M, Nakanishi K. A2E, a lipofuscin fluorophore, in human retinal pigmented epithelial cells in culture. Invest Ophthalmol Vis Sci. 1999;40:2988–2995. [PubMed] [Google Scholar]
- 18.Radu RA, Mata NL, Bagla A, Travis GH. Light exposure stimulates formation of A2E oxiranes in a mouse model of Stargardt's macular degeneration. Proc Natl Acad Sci U S A. 2004;101:5928–5933. doi: 10.1073/pnas.0308302101. [DOI] [PMC free article] [PubMed] [Google Scholar]
- 19.Sparrow JR, Zhou J, Ben-Shabat S, Vollmer H, Itagaki Y, Nakanishi K. Involvement of oxidative mechanisms in blue-light-induced damage to A2E-laden RPE. Invest Ophthalmol Vis Sci. 2002;43:1222–1227. [PubMed] [Google Scholar]
- 20.Ben-Shabat S, Itagaki Y, Jockusch S, Sparrow JR, Turro NJ, Nakanishi K. Formation of a nonaoxirane from A2E, a lipofuscin fluorophore related to macular degeneration, and evidence of singlet oxygen involvement. Agnew Chem, Int Ed Engl. 2002;41:814–817. doi: 10.1002/1521-3773(20020301)41:5<814::aid-anie814>3.0.co;2-2. [DOI] [PubMed] [Google Scholar]
- 21.Pawlak A, Wrona M, Rozanowska M, et al. Comparison of the aerobic photoreactivity of A2E with its precursor retinal. Photochemistry and photobiology. 2003;77:253–258. doi: 10.1562/0031-8655(2003)077<0253:cotapo>2.0.co;2. [DOI] [PubMed] [Google Scholar]
- 22.Roberts JE, Kukielczak BM, Hu DN, et al. The role of A2E in prevention or enhancement of light damage in human retinal pigment epithelial cells. Photochem Photobiol. 2002;75:184–190. doi: 10.1562/0031-8655(2002)075<0184:troaip>2.0.co;2. [DOI] [PubMed] [Google Scholar]
- 23.Maeda A, Golczak M, Maeda T, Palczewski K. Limited roles of Rdh8, Rdh12, and Abca4 in all-trans-retinal clearance in mouse retina. Invest Ophthalmol Vis Sci. 2009;50:5435–5443. doi: 10.1167/iovs.09-3944. [DOI] [PMC free article] [PubMed] [Google Scholar]
- 24.Avalle LB, Wang Z, Dillon JP, Gaillard ER. Observation of A2E oxidation products in human retinal lipofuscin. Exp Eye Res. 2004;78:895–898. doi: 10.1016/j.exer.2003.10.023. [DOI] [PubMed] [Google Scholar]
- 25.Dillon J, Wang Z, Avalle LB, Gaillard ER. The photochemical oxidation of A2E results in the formation of a 5,8,5',8'-bis-furanoid oxide. Exp Eye Res. 2004;79:537–542. doi: 10.1016/j.exer.2004.06.024. [DOI] [PubMed] [Google Scholar]
- 26.Jang YP, Matsuda H, Itagaki Y, Nakanishi K, Sparrow JR. Characterization of peroxy-A2E and furan-A2E photooxidation products and detection in human and mouse retinal pigment epithelial cell lipofuscin. J Biol Chem. 2005;280:39732–39739. doi: 10.1074/jbc.M504933200. [DOI] [PubMed] [Google Scholar]
- 27.Mata NL, Weng J, Travis GH. Biosynthesis of a major lipofuscin fluorophore in mice and humans with ABCR-mediated retinal and macular degeneration. Proc Natl Acad Sci U S A. 2000;97:7154–7159. doi: 10.1073/pnas.130110497. [DOI] [PMC free article] [PubMed] [Google Scholar]
- 28.Wu Y, Fishkin NE, Pande A, Pande J, Sparrow JR. Novel lipofuscin bisretinoids prominent in human retina and in a model of recessive Stargardt disease. J Biol Chem. 2009;284:20155–20166. doi: 10.1074/jbc.M109.021345. [DOI] [PMC free article] [PubMed] [Google Scholar]
- 29.Weng J, Mata NL, Azarian SM, Tzekov RT, Birch DG, Travis GH. Insights into the function of Rim protein in photoreceptors and etiology of Stargardt's disease from the phenotype in abcr knockout mice. Cell. 1999;98:13–23. doi: 10.1016/S0092-8674(00)80602-9. [DOI] [PubMed] [Google Scholar]
- 30.Haralampus-Grynaviski NM, Lamb LE, Clancy CM, et al. Spectroscopic and morphological studies of human retinal lipofuscin granules. Proceedings of the National Academy of Sciences of the United States of America. 2003;100:3179–3184. doi: 10.1073/pnas.0630280100. [DOI] [PMC free article] [PubMed] [Google Scholar]
- 31.Rozanowska M, Pawlak A, Rozanowski B, et al. Age-related changes in the photoreactivity of retinal lipofuscin granules: role of chloroform-insoluble components. Investigative ophthalmology & visual science. 2004;45:1052–1060. doi: 10.1167/iovs.03-0277. [DOI] [PubMed] [Google Scholar]
Associated Data
This section collects any data citations, data availability statements, or supplementary materials included in this article.
Supplementary Materials
Supplementary Figure 1.Oxidation of A2E occurs during sample handling. A) A tandem mass spectrum of oxidized A2E (m/z = 608) from a diluted (50 fmol/μL) A2E HPLC fraction from an ABCR-/- mouse (12 months of age) eyecup preparation. B) A tandem mass spectrum of oxidized A2E (m/z = 608) from a diluted (50 fmol/μL) A2E HPLC fraction from a 94-yr-old human eyecup sample.


