

Abstract
Background
We previously reported risks of ovarian carcinoma for common polymorphisms in one-carbon (1-C) transfer genes. We sought to replicate associations for DPYD rs1801265, DNMT3A rs13420827, MTHFD1 rs1950902, MTHFS rs17284990 and TYMS rs495139 with risk of ovarian carcinoma overall, and to utilize the large sample of assembled cases to investigate associations by histological type.
Methods
Associations were evaluated in the Ovarian Cancer Association Consortium, including 16 studies of 5,593 epithelial ovarian carcinoma cases and 9,962 controls of white non-Hispanic origin. Odds ratios (OR) and 95% confidence intervals (CI) were adjusted for age and study site.
Results
The five polymorphisms were not associated with ovarian carcinoma overall (P trend > 0.13); however, associations for the minor allele at TYMS rs495139 were observed for carcinomas of mucinous type (OR, 1.19; 95% CI, 1.03-1.39; P = 0.02), clear cell type (OR, 0.86; 95% CI, 0.75-0.99; P = 0.04) and endometrioid type (OR, 0.90; 95% CI, 0.81-0.99; P = 0.04) (P heterogeneity = 0.001). Restriction to low-grade mucinous carcinomas further strengthened the association for the mucinous type (OR, 1.32; 95% CI, 1.07-1.62; P = 0.01). TYMS rs495139 was not associated with serous type (OR, 1.06; 95% CI, 1.00-1.13; P = 0.05).
Conclusions
TYMS rs495139 may be associated with a differential risk of ovarian carcinoma types, indicating the importance of accurate histopathological classification.
Impact
Biomarkers that distinguish ovarian carcinoma types are few, and TYMS rs495139 may provide a novel clue to type etiology. Additional genotyping in a larger sample with increased gene coverage is underway.
Introduction
One-carbon (1-C) transfer reactions are essential for DNA synthesis and replication, particularly for rapidly dividing cells, as well as for the biosynthesis of S-adenosyl methionine, an essential supplier of methyl groups for the methylation of many compounds including DNA (1). Perturbation of gene expression and gene-product function in the 1-C transfer pathway can have pleiotropic consequences, leading to tumor initiation and progression (2). Incessant demand for DNA synthesis and preservation of DNA integrity via methylation in a genetically-susceptible background may possibly increase the risk of ovarian carcinomas.
We previously reported that genetic variation in the 1-C transfer pathway was associated with ovarian carcinoma risk among cases and controls from the upper Midwest and North Carolina (3). Ten common nonsynonymous and tagging single nucleotide polymorphisms (SNPs) in eight genes were statistically significant at P ≤ 0.05 in either an ordinal (per-minor allele) model or codominant model comparing heterozygotes and homozygotes for the minor allele separately to homozygotes with the common allele. In the current report, our first aim was to replicate the findings of five SNPs from our United States study (3) with risk of ovarian carcinomas using data from the international Ovarian Cancer Association Consortium (OCAC) (4). The five SNPs selected for follow-up genotyping in OCAC were chosen from preliminary analyses prior to publication of the final report (3) with consideration to available funds to assay ∼19,500 samples from among several promising SNPs that were nominated for genotyping by other OCAC members. We weighted our decision for which five SNPs to genotype using the criteria of statistical significance from the preliminary analyses and the known biology of the enzymes' pivotal roles at critical junctions in 1-C transfer. At that time, our preliminary analyses did not identify what would become our most promising SNP (SHMT1 rs9909104) with ovarian carcinoma risk (3), and explains its absence in this report.
Molecular and genetic-based analyses of ovarian carcinomas show that ovarian cancer is several diseases with different patterns of genetic mutations (5), biological markers (6), survival outcomes (7) and cells of origin (8). Recent advances in histopathological typing, based on distinct molecular alterations, have led to more accurate classification of ovarian carcinoma types (5, 6), resulting in a lower prevalence for mucinous and endometrioid ovarian carcinomas than previously thought (9). Associations in these rare types might have been diluted in previous analyses due to non-differential misclassification. Using the large sample size of the OCAC, our second aim was to evaluate associations at the five 1-C SNPs with histological types of ovarian carcinomas. For this aim, we considered information on grade and histology (10, 11) to “reassign” the histological types in order to correct for potential misclassification.
Material and methods
Study subjects
Sixteen studies of ovarian cancer contributed data to this analysis and are described in Table 1 (see also Ref. (4, 12, 13)). Thirteen studies used population-based ascertainment for cases and controls, one study was clinic-based, and one was a case-control study nested within a cohort. One population-based study, North Carolina Ovarian Cancer Study (NCO), was evaluated in two batches: NCO samples 0001 to 1040 (henceforth referred to as NCO1) were included in our original report along with Mayo Clinic Ovarian Cancer Case Control Study (MAY) samples from which initial observations for the five SNPs of interest were made (3). NCO samples 1041 to 1771 (henceforth referred to as NCO2) were genotyped in the current replication investigation. Thus, 14 studies (including NCO2) served as replication studies and two studies (NCO1 and MAY) were included from our original report.
Table 1. Overview of OCAC studies and white non-Hispanic participants.
| Study abbreviation | Study name | Cases carcinoma | Cases LMP | Controls | White non-Hispanic %* | Source population |
|---|---|---|---|---|---|---|
| AUS | AOCS (Australian Ovarian Cancer Study) and ACS (Australian Cancer Study – Ovarian Cancer) | 729 | 206 | 1,082 | 85 | Australia: Population-based |
| DOV | DOVE (Diseases of the Ovary and their Evaluation) | 533 | 186 | 724 | 91 | Washington, USA: Population-based |
| GER | GOCS (German Ovarian Cancer Study) | 207 | 29 | 433 | 100 | Germany: Population-based |
| HAW | HAWAII (Hawaii Ovarian Cancer Study) | 70 | 20 | 158 | 26 | Hawaii, USA: Population-based |
| HOP | HOPE (Hormones and Ovarian Cancer Prediction Study) | 285 | 34 | 643 | 95 | Pennsylvania, USA: Population-based |
| MAL | MALOVA (Malignant Ovarian Cancer Study) | 441 | 0 | 1,218 | 100 | Denmark: Population-based |
| MAY | MAYO (Mayo Clinic Ovarian Cancer Case Control Study) | 303 | 51 | 388 | 87 | Mid-west, USA: Clinic-based |
| NCO1† | NCOCS (North Carolina Ovarian Cancer Study) | 313 | 99 | 462 | 84 | North Carolina, USA: Population-based |
| NCO2† | 258 | 63 | 264 | 80 | ||
| NEC | NECC (New England-based Case-Control Study) | 576 | 217 | 1,012 | 96 | New England, USA: Population-based |
| NHS | NHS (Nurses' Health Study) | 114 | 18 | 372 | 98 | USA: Population-based cohort |
| SEA | SEARCH (Studies of Epidemiology and Risk Factors in Cancer Heredity Ovarian Cancer Study) | 533 | 121 | 1,229 | 97 | England: Population-based |
| STA | GEOCS (Genetic Epidemiology of Ovarian Cancer Study) ‡ | 249 | 1 | 366 | 87 | California, USA: Population & family-based |
| UCI | UCI (the Orange and San Diego Counties, California Study) | 284 | 137 | 431 | 81 | California, USA: Population-based |
| UKO | UKOPS (United Kingdom Ovarian Cancer Population Study) | 259 | 1 | 581 | 98 | UK: Population-based |
| USC | LAC-CCOC (Los Angeles County Case-Control Studies of Ovarian Cancer) | 439 | 128 | 599 | 73 | California, USA: Population-based |
| Totals | 5,593 | 1,307 | 9,962 | 87 |
White non-Hispanic subjects.as a percentage of all race-ethnicities enrolled in each study.
NCO1 and NCO2 are considered two studies totaling 16 OCAC studies
Formerly FROCS (Family Registry for Ovarian Cancer Study)
Each study received ethics committee approval and all study subjects provided written informed consent. Key clinical and questionnaire data on study subjects including case-control status, ethnicity/race, tumor behavior, histology, age at diagnosis (or comparable reference date for controls) and history of prior cancers were merged into a common dataset. The data were checked for consistency and completeness and discrepancies were followed-up with individual study investigators.
We excluded subjects with missing information on age and tumor behavior, subjects with non-epithelial ovarian tumors and those with a prior history of ovarian cancer.
Genotyping and quality control
Five SNPs were assayed: dihydropyrimidine dehydrogenase (DPYD) rs1801265, DNA (cytosine-5-)-methyltransferase 3 alpha (DNMT3A) rs13420827, methylenetetrahydrofolate dehydrogenase (NADP+ dependent) 1 (MTHFD1) rs1950902, 5,10-methenyltetrahydrofolate synthetase (5-formyltetrahydrofolate cyclo-ligase) (MTHFS) rs17284990 and thymidylate synthetase (TYMS) rs495139. Genotyping of the 14 replication studies was performed on 384-well plates using a semi-centralized approach with centrally-supplied probes at 11 different centers: Malignant Ovarian Cancer Study (MAL) and United Kingdom Ovarian Cancer Population Study (UKO) were genotyped in the same lab, as were Diseases of the Ovary and their Evaluation (DOV), Hormones and Ovarian Cancer Prediction Study (HOP) and Los Angeles County Case-Control Studies of Ovarian Cancer (USC) studies, and Studies of Epidemiology and Risk Factors in Cancer Heredity-Ovarian Cancer (SEA) and Genetic Epidemiology of Ovarian Cancer Study (STA). All samples except Australian Ovarian Cancer Study and Australian Cancer Study-Ovarian Cancer (AUS) were genotyped using the 5′ nuclease TaqMan allelic discrimination assay (Taqman, Applied Biosystems, Foster City, CA). AUS used the Sequenom iPLEX gold genotyping technology (Sequenom Inc, San Diego, CA). Each assay was carried out using 10 ηg DNA in a 2.5 or 5-μl reaction volume as described previously (4).
The following criteria were used as measures of acceptable genotyping for each SNP and each study: (i) >3% sample duplicates included, (ii) concordance for duplicate samples ≥98%, (iii) overall SNP call rate by study ≥95%, (iv) call rate for each 384-well plate >90%, (v) a difference in call rate between cases and controls of <5%, and (vi) <25% overall failed plates. Studies failing one of these criteria were excluded for particular SNPs: for example, Nurses' Health Study (NHS) was excluded for DPYD; MAL, New England-based Case-Control Study (NEC), NHS and UKO were excluded for MTHFS; and MAL was excluded for TYMS. Therefore, the number of studies/samples successfully genotyped varied for each polymorphism. Further, among white non-Hispanic control subjects, genotypes were compared with those expected under Hardy-Weinberg equilibrium (HWE) in each study separately and no deviations from HWE among controls were observed at P < 0.05. In addition, consistency across laboratories was confirmed by genotyping a common set of 95 DNAs (90 CEPH trios and five duplicate samples; HAPMAPPT01 provided by Coriell, Camden, NJ, USA) with the requirement of >98% concordance in genotype calls. Five SNPs across four studies had one mismatch genotype for the HAPMAPPT01 (>99.9% call rate overall; range across studies: 99.9% to 100%). Finally, to evaluate genotype consistency across discovery and replication sets, NCO1 samples (n=1,040) were re-genotyped using the replication assay. Genotype call rate concordance between Illumina (discovery set) and TaqMan (replication set) assays was very high (DNMT3A = 99.5%; DPYD = 99.3%; MTHFS = 99.8%; MTHFD1 = 99.2% and TYMS = 99.0%).
Statistical analysis
Primary analyses were restricted to controls and ovarian carcinomas (invasive cases) among white non-Hispanic subjects in the 14 replication studies. SNP associations for ovarian carcinoma risk were assessed using unconditional logistic regression to estimate odds ratios (ORs) and 95% confidence intervals (CIs). Association testing assumed an ordinal (log-additive) genotypic relationship with simple tests for trend, as well as separate comparisons of women with one copy and two copies of the minor allele to women with no copies (referent) using a 2 degrees-of-freedom test. Risk models were adjusted for age category (<40, 40-49, 50-59, 60-69, ≥70 years) in study-specific analyses, and adjusted for age category and study in pooled analyses. Prior to pooling data across studies, a test for heterogeneity of ORs was evaluated for significance using the likelihood ratio test comparing models with and without a product term for the ordinal coding of the genotype and the categorical variable for study (14). Pooled ORs and 95% CIs are presented with and without including the two studies (MAY and NCO1) in which the initial findings were generated.
Among the 16 studies, we simultaneously modeled the risk of each of four histological types of epithelial ovarian carcinomas (serous, mucinous, endometrioid and clear cell) under an ordinal genetic model using polytomous logistic regression. Risk models were adjusted for age category and study, and statistical heterogeneity of the SNP-ovarian carcinoma histology associations was tested (14). We also incorporated information from contemporary pathological reviews to refine risk associations in the analyses of histological type. Specifically, others have shown that a significant proportion of grade 3 mucinous ovarian carcinomas are, in fact, metastatic from the gastrointestinal tract (15), and up to 28% of endometrioid ovarian carcinomas are re-classified as high-grade serous ovarian carcinomas after contemporary histopathological review (10). We, therefore, “re-assigned” histological type according to the expected distributions of histology combined with grade observed from re-reviews of >1,000 ovarian carcinomas from large population-based series (10, 11). The following re-classification was used: serous carcinomas (serous histology or ≥G3 + endometrioid histology), and metastatic mucinous carcinomas (≥G3 + mucinous histology). No reassignment was performed for clear cell carcinomas.
For the first aim, two-sided P values <0.05 were considered to be statistically significant for replication risk estimates with ovarian carcinomas overall. For the second aim, Bonferroni-adjusted two-sided P values <0.01 were used to identify statistically significant associations at the five SNPs with histological types of ovarian carcinomas. Analyses were implemented using SAS (SAS Institute, Cary, NC, Version 9.1, 2009).
Results
Characteristics of the 16 studies are shown in Table 1. The final data set including MAY and NCO1 studies comprised 6,583 ovarian carcinoma cases and 11,215 controls. Of these, 87% were of white non-Hispanic origin (5,593 cases, 9,962 controls). Other subjects were white Hispanic (169 cases and 189 controls), black non-Hispanic (134 cases and 199 controls), various Asian ethnicities (241 cases and 327 controls), other races or ethnicities (198 cases and 371 controls), and 248 cases and 167 controls had missing or unknown race or ethnicity information. An additional 1,634 cases had borderline/low malignant potential (LMP) tumors, of which 1,307 were of white non-Hispanic origin. Genotype counts, minor allele frequency (MAF) and HWE statistics for each SNP among white non-Hispanic women with ovarian carcinoma (invasive cases only) in each study population are shown in Supplementary Table 1.
None of the five SNPs evaluated in the 14 replication studies was associated with ovarian carcinoma overall (Table 2 and Figure 1). No statistical evidence for heterogeneity of ORs was observed across replication studies (Figure 1). Study-specific ORs and 95% CIs are in Supplementary Table 2.
Table 2. Associations* between genotypes and risk of ovarian carcinoma among white non-Hispanic subjects in OCAC.
| Gene/SNP | SNP region | Studies | Cases/Controls | MAF | Het OR (95% CI) | Hom OR (95% CI) | P 2df | Ordinal OR (95% CI) | P trend |
|---|---|---|---|---|---|---|---|---|---|
|
DNMT3A rs13420827 |
2p23 3′ UTR C/G | Initial report† | 829/941 | 0.19 | 0.82 (0.66-1.02) | 1.52 (0.91-2.56) | 0.03 | 0.96 (0.81-1.15) | 0.68 |
| 14 OCAC replication studies‡ | 4,788/8,776 | 0.18 | 1.06 (0.98-1.14) | 1.13 (0.93-1.38) | 0.20 | 1.06 (0.99-1.13) | 0.07 | ||
| All § | 5,404/9,626 | 0.18 | 1.03 (0.96-1.11) | 1.17 (0.98-1.41) | 0.20 | 1.05 (0.99-1.11) | 0.13 | ||
|
DPYD rs1801265 |
1p22 EX2 A/G Arg29Cys |
Initial report† | 829/941 | 0.21 | 1.27 (1.04-1.56) | 1.42 (0.89-2.26) | 0.04 | 1.22 (1.05-1.46) | 0.01 |
| 13 OCAC replication studies‡ | 4,661/8,382 | 0.21 | 0.93 (0.86-1.01) | 1.06 (0.89-1.23) | 0.15 | 0.97 (0.91-1.04) | 0.40 | ||
| All § | 5,277/9,232 | 0.21 | 0.97 (0.90-1.04) | 1.10 (0.93-1.30) | 0.28 | 1.00 (0.94-1.06) | 0.99 | ||
|
MTHFD1 rs1950902 |
14q24 EX6 G/A Arg134Lys |
Initial report† | 829/941 | 0.20 | 0.89 (0.72-1.09) | 0.52 (0.29-0.94) | 0.06 | 0.83 (0.69-0.99) | 0.04 |
| 14 OCAC replication studies‡ | 4,579/8,426 | 0.18 | 0.98 (0.90-1.06) | 1.00 (0.82-1.23) | 0.85 | 0.99 (0.92-1.05) | 0.68 | ||
| All § | 5,195/9,276 | 0.18 | 0.97 (0.90-1.05) | 0.94 (0.77-1.14) | 0.63 | 0.97 (0.91-1.03) | 0.34 | ||
|
MTHFS rs17284990 |
15q25.1 IVS2 T/C |
Initial report† | 829/941 | 0.23 | 0.87 (0.70-1.07) | 1.63 (1.08-2.46) | 0.01 | 1.06 (0.90-1.24) | 0.49 |
| 10 OCAC replication studies‡ | 3,472/5,683 | 0.22 | 0.94 (0.86-1.04) | 1.06 (0.88-1.29) | 0.33 | 0.98 (0.92-1.06) | 0.67 | ||
| All § | 4,088/6,533 | 0.22 | 0.92 (0.85-1.01) | 1.12 (0.94-1.33) | 0.06 | 0.98 (0.92-1.05) | 0.66 | ||
|
TYMS rs495139 |
18p11.32 3′ downstream G/C |
Initial report† | 829/941 | 0.39 | 1.06 (0.86-1.32) | 1.36 (1.02-1.81) | 0.10 | 1.15 (1.00-1.32) | 0.05 |
| 13 OCAC replication studies‡ | 4,365/7,560 | 0.41 | 1.03 (0.95-1.12) | 0.97 (0.87-1.09) | 0.49 | 0.99 (0.94-1.05) | 0.81 | ||
| All § | 4,981/8,410 | 0.41 | 1.04 (0.96-1.12) | 1.01 (0.91-1.13) | 0.64 | 1.01 (0.96-1.06) | 0.63 | ||
SNP, single nucleotide polymorphism; MAF, minor allele frequency among controls only; Het, heterozygotes; Hom, homozygous minor allele carriers; SNP, single nucleotide polymorphism
Bold text indicates significant associations observed in the initial report (3)
Adjusted for age and study
MAY and NCO1 studies from which the initial findings were reported (3)
OCAC studies excluding MAY and NCO1; additional studies were excluded if they did not meet quality control criteria (see Methods)
OCAC studies including MAY and NCO1; samples do not total 5,593 cases and 9,962 controls from application of quality control criteria (see Methods)
Fig. 1.
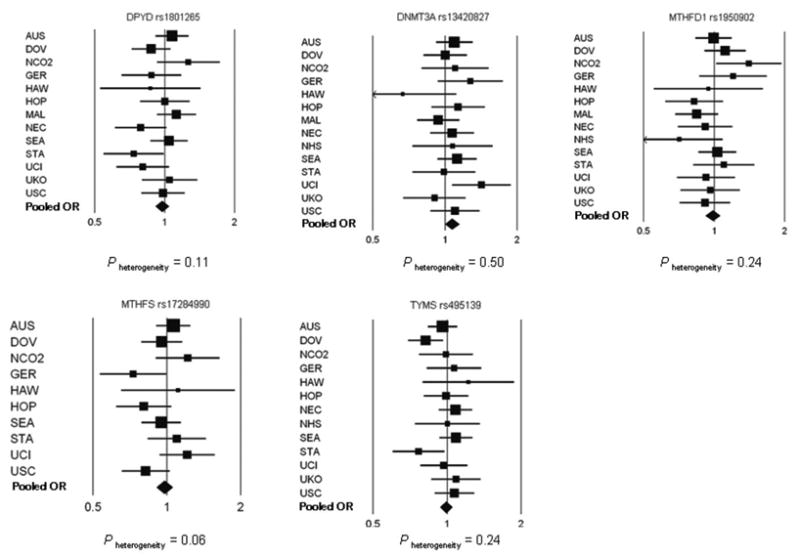
Forest plots of the study-specific (squares) and pooled (diamonds) odds ratios and 95% confidence intervals for the association between five one-carbon transfer SNPs and ovarian carcinoma among white non-Hispanic subjects under the ordinal genetic risk model. Adjusted for age category and, for pooled estimates, age category and study. Size of squares refers to study-specific sample size (smallest to largest) and width of bars refers to associated 95% CI. Diamond refers to pooled OR and width of diamond refers to 95% CI. Refer to Table 2 for pooled risk estimate values. P heterogeneity was tested using the likelihood ratio test comparing models with and without the product term for study and SNP and excluding MAY and NCO1 studies.
Following Bonferroni adjustment, only TYMS rs495139 showed statistical heterogeneity of ORs across histological types (P heterogeneity = 0.001; Table 3) despite no significant association with ovarian carcinoma overall (Table 2). Each copy of the TYMS rs495139 minor allele was associated with an increased risk of mucinous ovarian carcinomas (OR, 1.19; 95% CI, 1.03-1.39; P =0.02) and a decreased risk of endometrioid (OR, 0.90; 95% CI, 0.81-0.99; P = 0.04) and clear cell (OR, 0.86; 95% CI, 0.75-0.99; P = 0.04) ovarian carcinomas. The association with serous ovarian carcinomas (OR, 1.06; 95% CI, 1.00-1.13; P = 0.05) was not statistically significant. None of the other SNPs were associated differentially with histological types (P tumor heterogeneity > 0.30; data not shown).
Table 3. Associations* of a per-allele increase in TYMS rs495139 and risk of ovarian carcinoma types among white non-Hispanic subjects in OCAC.
| Studies | Co | Serous | Mucinous | Endometrioid | Clear Cell | |||||||||
|---|---|---|---|---|---|---|---|---|---|---|---|---|---|---|
| Ca | OR (95% CI) | P trend | Ca | OR (95% CI) | P trend | Ca | OR (95% CI) | P trend | Ca | OR (95% CI) | P trend | P value† | ||
| 15 OCAC studies‡ | 8,410 | 2,823 | 1.06 (1.00-1.13) | 0.05 | 354 | 1.19 (1.03-1.39) | 0.02 | 821 | 0.90 (0.81-0.99) | 0.04 | 409 | 0.86 (0.75-0.99) | 0.04 | 0.001 |
| 15 OCAC studies§ | 8,410 | 1,775 | 1.02 (0.94-1.10) | 0.68 | 204 | 1.26 (1.04-1.54) | 0.02 | 515 | 0.94 (0.83-1.07) | 0.36 | 409 | 0.86 (0.74-0.99) | 0.04 | 0.04 |
| 15 OCAC studies§, “re-assigned” type | 8,410 | 1,972 | 1.02 (0.95-1.09) | 0.62 | 183 | 1.32 (1.07-1.62) | 0.01 | 318 | 0.92 (0.78-1.08) | 0.29 | 409 | 0.86 (0.74-0.99) | 0.04 | 0.04 |
Co, controls; Ca, cases
Bold text indicates statistically significant associations
Adjusted for age and study
P for tumor heterogeneity
All OCAC studies including MAY and NCO1 but excluding MAL, which failed genotyping; samples do not total 5,593 cases and 9,962 controls from application of quality control criteria (see Methods) and exclusion of rarer histologies
Cases further restricted to samples with information on grade
In order to correct for potential misclassification of histological type, a combination of grade and type was used to “re-assign” type. Grade information was available on 2,903 of the 4,407 cases in the TYMS analyses (Table 3, second row). As shown in Table 3 (last row), the association among mucinous ovarian carcinomas strengthened (OR, 1.32; 95% CI, 1.07-1.62; P = 0.01; 183 cases) when 21 high-grade, and presumably metastatic, mucinous carcinomas were excluded (OR for these 21 cases, 0.88; 95% CI, 0.47-1.64; P = 0.69). The null association among serous carcinomas persisted with the inclusion of 197 high-grade endometrioid carcinomas, which were presumed to be misdiagnosed high-grade serous carcinomas (OR, 1.02; 95% CI, 0.95-1.09; P = 0.62; 1,972 cases). The decreased risk among endometrioid ovarian carcinomas attenuated and was no longer statistically significant; however, 306 endometrioid cases were lost from the analyses due to missing information on grade. TYMS rs495139 was not associated with LMP tumors of the different histological types: serous LMP (OR, 1.01; 95% CI, 0.90-1.13; P =0.92; 680 cases), mucinous LMP (OR, 0.99; 95% CI, 0.87-1.13; P = 0.88; 504 cases), endometrioid LMP (OR, 1.38; 95% CI, 0.74-2.54; P = 0.31; 20 cases), and clear cell LMP (OR, 1.13; 95% CI, 0.39-3.27; P = 0.83; 7 cases).
Discussion
This investigation profited from the collaborative efforts of investigators in the international OCAC, which combined their samples into one of the largest series of ovarian cancer cases and controls to investigate associations of genetic susceptibility. Our findings do not support significant associations for DPYD rs1801265, DNMT3A rs13420827, MTHFD1 rs1950902, MTHFS rs17284990 and TYMS rs495139 with risk of ovarian carcinoma overall. When we considered the different histological types separately, the risks at TYMS rs495139 were statistically heterogeneous, showing an increase in risk of mucinous ovarian carcinomas. This association was strengthened when we excluded putative metastatic carcinomas suggesting the importance of homogeneous histopathological classification and the utility of our approach to correct for potential misclassification and refine risk associations in studies of ovarian carcinoma types. Decreased risks of clear cell and possibly endometrioid types were also observed. Our findings are reinforced by the application of rigorous quality control standards applied to our genotyping protocol and the centralized repository of key clinical variables from each study that underwent logic checks prior to merging into a common dataset to ensure data integrity. To limit any impact of population stratification, we restricted our analysis to women of white non-Hispanic ancestry.
Histological types of ovarian carcinoma are distinct diseases that vary according to characteristics of the precursor lesions and the genetic events during oncogenesis (5) and distinct biomarker-expression profiles (6). The progression of mucinous ovarian tumors is hypothesized to develop from benign cysts or LMP tumors rather than arising de novo (16). In support of the progression model of mucinous ovarian tumors is the co-existence of benign, LMP and malignant areas within the same mucinous tumor (17) and the sharing of identical KRAS mutations (18). It is conceivable that genetic variants may have different functional relevance for different ovarian histological types. In the present report, TYMS rs495139 was not associated with LMP tumors, but the positive association with mucinous ovarian carcinomas suggests it may serve to drive the progression of LMP mucinous tumors to mucinous carcinomas. Although speculative, TYMS rs495139 may play a protective role in the early development of clear cell and endometrioid carcinomas, which share a similar precursor lesion and molecular features (19). Precisely how the SNP would differentially affect histological types requires further investigation. The null association at TYMS rs495139 with the overall ovarian cancer phenotype observed in the current analysis is not surprising given that associations with the overall phenotype are often driven by the greater proportion of the serous ovarian carcinomas.
TYMS encodes thymidylate synthetase (TS), which catalyzes the transformation of dUMP to dTMP and is the only de novo source of thymidylate used for DNA (pyrimidine) biosynthesis (20). Thymidylate synthetase is present in proliferating cell types and is considered an important target in cancer chemotherapy (21). The TYMS rs495139 polymorphism is located in the 3′ untranslated region (UTR) and is also situated in the 3′ region of the ENOSF1 (enolase superfamily member 1) gene. ENOSF1 encodes two proteins that down-regulate TS expression (22, 23): one of these, rTS alpha, is an antisense transcript that binds, cleaves and inactivates human TS RNA (24). Because the levels of rTS alpha vary between cell lines (22), the relative abundance between cell types could control the rate of TS expression and cell type proliferation. The antisense transcript function of ENOSF1 mRNA is suggestive of the role that microRNAs play in translational repression or transcript degradation. The 3′ UTR of TYMS and ENOSF1 both have predicted sites for binding several microRNA families (25-29), and altered expression of several microRNAs has been reported in ovarian carcinoma (both serous and unspecified type) compared to normal tissue (29-31). Further, predicted microRNA target sites (32) at TYMS contain at least two polymorphisms, rs699517 (MAF=0.27) and rs16948421 (MAF=not available), among Caucasians in the HapMap database. The TYMS rs495139 variant investigated in the present report is in modest linkage disequilibrium (LD) with the microRNA target site SNP rs699517 (r2 = 0.24, HapMap Consortium release 27). We speculate that if TYMS rs495139 or a variant in LD with TYMS rs495139 influences the binding of one or more microRNAs or affects ENOSF1 antisense transcript binding and subsequently TS cleavage in different cell types, including ovarian histological types, then this may be one potential mechanism by which genetic variation alters TS transcript regulation, and therefore cellular proliferation. Interestingly, another SNP, rs3819102, located in the 3′ flanking region of TYMS and in an intron of the ENOSF1 gene was associated recently with endometrial cancer among Chinese women (33); however, among Caucasians this SNP is rare (MAF = 0.025) and is not in LD with TYMS rs495139 (r2 = 0.02, HapMap Consortium release 27).
We were unable to confirm the initial observed associations between DPYD rs1801265, DNMT3A rs13420827, MTHFD1 rs1950902, MTHFS rs17284990 and TYMS rs495139 with risk of ovarian carcinoma overall in the OCAC. It remains possible that other variants in these genes with which these five SNPs were in strong LD in the samples from the original report may have shown an association with ovarian carcinoma had they been genotyped in OCAC. In selecting the best correlated variant for a single locus for follow-up genotyping we relied, in part, on the criteria of statistical significance. However, it has been shown that variants with the strongest support in the original discovery stage can be replaced by other variants in high LD that have much stronger effects in replication studies (34). Although the samples in our initial report had reasonably good SNP coverage (r2 ≥ 0.80) of variation present in the HapMap Caucasian samples, this may have been offset by lower power to detect weak effects in our previous study (3), which may have led to SNPs not being selected for validation that, by themselves or in a combination with other variants, may influence the risk of ovarian carcinoma overall or by specific cell type. Thus, the absence of associations with the five SNPs examined in this report does not preclude other variants in these genes to be important determinants of ovarian carcinoma. Using an even larger number of samples within the OCAC, we intend to pursue further genotyping in several of the genes from our initial report (3) in a more comprehensive manner using the 1000 Genomes project (35).
In summary, we did not find significant associations for DPYD rs1801265, DNMT3A rs13420827, MTHFD1 rs1950902, MTHFS rs17284990 and TYMS rs495139 with ovarian carcinoma overall, but our findings suggest differential risk with ovarian histological types for a common TYMS polymorphism. To reduce the misclassification of ovarian histological types in the absence of contemporary pathological re-review, epidemiologic research may consider combining information on grade and histology using the re-classification based on expected distributions of ovarian histological types proposed in this report.
Acknowledgments
The Australian Ovarian Cancer Study (AOCS) Management Group (D Bowtell, G.Chenevis-Trench., A deFazio, D Gertig, A Green, and PM Webb) gratefully acknowledges the contribution of all the clinical and scientific collaborators (see http://www.aocstudy.org/). The Australian Cancer Study (ACS) Management Group comprises A Green, P Parsons, N Hayward, PM Webb, and D Whiteman. The German Ovarian Cancer Study (GER or GOCS) thank Ursula Eilber and Tanja Koehler for competent technical assistance for the German Ovarian Cancer study. The United Kingdom Ovarian Cancer Population Study (UKOPS) study thank all members of the research team, including research nurses, research scientists, data entry personnel and consultant gynaecological oncologists for their help in establishing the UKOPS case-control collection.
Funding: This work was supported by the Ovarian Cancer Research Fund, provided by the family and friends of Kathryn Sladek Smith. L.E.K. is supported by career awards from the Alberta Cancer Research Institute (project numbers 23905 and 24258) and the Canadian Institutes of Health Research (grant number MSH-87734). The Australian Ovarian Cancer Study (AOCS) and the Australian Cancer Study (ACS) was supported by the U.S. Army Medical Research and Materiel Command (DAMD17-01-1-0729); the Cancer Council Tasmania and Cancer Foundation of Western Australia (AOCS study); and the National Health and Medical Research Council of Australia (199600) (ACS study). G.C-T. and P.M.W. are supported by the NHMRC of Australia. The Diseases of the Ovary and their Evaluation (DOV) study was supported by the U.S. National Institutes of Health (CA87538, CA112523). The Hawaii Ovarian Cancer Study (HAW) group was supported by the U.S. National Institutes of Health (R01 CA 58598, N01-CN-55424, N01-PC-67001). The German Ovarian Cancer Study (GER or GOCS) was supported by the German Federal Ministry of Education and Research of Germany; Programme of Clinical Biomedical Research (01 GB 9401); the genotyping in part by the state of Baden-Württemberg through Medical Faculty of the University of Ulm (P.685); and data management by the German Cancer Research Center. The MALOVA study (MAL) was supported by grants from Mermaid 1; The Danish Cancer Society; and U.S. National Institutes of Health (RO1 CA 61107). The Mayo Clinic Ovarian Cancer Case-Control Study (MAY) was supported by U.S. National Institutes of Health (R01 CA 122443, R01 CA 88868); and the Mayo Foundation. The Nurses' Health Study (NHS) was supported by U.S. National Institutes of Health (P01 CA87969, R01 CA49449). M.A.G. is supported by U.S. National Institutes of Health (T32 CA009001). The Stanford study (STA) was supported by U.S. National Institutes of Health (U01 CA71966 to A.S.W. and V.M., R01 CA16056 to RAD, U01 CA69417 for recruitment of controls by the Northern California Cancer Center). The Los Angeles County Case-Control Studies of Ovarian Cancer (USC) was supported by the California Cancer Research Program (00-01389V-20170, 2110200); U.S. National Institutes of Health (CA14089, CA17054, CA61132, CA63464, N01-PC-67010, R03-CA113148); and California Department of Health Services (subcontract 050-E8709) as part of its statewide cancer reporting program. The United Kingdom Ovarian Cancer Population Study (UKOPS) study was supported by the OAK Foundation. A portion of this work was done at UCLH/UCL within the “women's health theme” of the NIHR UCLH/UCL Comprehensive Biomedical Research Centre supported by the Department of Health.
References
- 1.Choi SW, Mason JB. Folate and carcinogenesis: an integrated scheme. J Nutr. 2000;130:129–32. doi: 10.1093/jn/130.2.129. [DOI] [PubMed] [Google Scholar]
- 2.Hanahan D, Weinberg RA. The hallmarks of cancer. Cell. 2000;100:57–70. doi: 10.1016/s0092-8674(00)81683-9. [DOI] [PubMed] [Google Scholar]
- 3.Kelemen LE, Sellers TA, Schildkraut JM, et al. Genetic variation in the one-carbon transfer pathway and ovarian cancer risk. Cancer Res. 2008;68:2498–506. doi: 10.1158/0008-5472.CAN-07-5165. [DOI] [PMC free article] [PubMed] [Google Scholar]
- 4.Gayther SA, Song H, Ramus SJ, et al. Tagging single nucleotide polymorphisms in cell cycle control genes and susceptibility to invasive epithelial ovarian cancer. Cancer Res. 2007;67:3027–35. doi: 10.1158/0008-5472.CAN-06-3261. [DOI] [PubMed] [Google Scholar]
- 5.Crum CP, Drapkin R, Miron A, et al. The distal fallopian tube: a new model for pelvic serous carcinogenesis. Curr Opin Obstet Gynecol. 2007;19:3–9. doi: 10.1097/GCO.0b013e328011a21f. [DOI] [PubMed] [Google Scholar]
- 6.Kobel M, Kalloger SE, Boyd N, et al. Ovarian carcinoma subtypes are different diseases: implications for biomarker studies. PLoS Med. 2008;5:e232. doi: 10.1371/journal.pmed.0050232. [DOI] [PMC free article] [PubMed] [Google Scholar]
- 7.Wong KK, Gershenson D. The continuum of serous tumors of low malignant potential and low-grade serous carcinomas of the ovary. Dis Markers. 2007;23:377–87. doi: 10.1155/2007/204715. [DOI] [PMC free article] [PubMed] [Google Scholar]
- 8.Roh MH, Kindelberger D, Crum CP. Serous tubal intraepithelial carcinoma and the dominant ovarian mass: clues to serous tumor origin? Am J Surg Pathol. 2009;33:376–83. doi: 10.1097/PAS.0b013e3181868904. [DOI] [PubMed] [Google Scholar]
- 9.Gilks CB, Prat J. Ovarian carcinoma pathology and genetics: recent advances. Hum Pathol. 2009;40:1213–23. doi: 10.1016/j.humpath.2009.04.017. [DOI] [PubMed] [Google Scholar]
- 10.Gilks CB, Ionescu DN, Kalloger SE, et al. Tumor cell type can be reproducibly diagnosed and is of independent prognostic significance in patients with maximally debulked ovarian carcinoma. Hum Pathol. 2008;39:1239–51. doi: 10.1016/j.humpath.2008.01.003. [DOI] [PubMed] [Google Scholar]
- 11.Kobel M, Kalloger SE, Huntsman D, et al. Differences in tumor cell type in low versus high stage ovarian carcinomas. Int J Gynecol Pathol. 2010 doi: 10.1097/PGP.0b013e3181c042b6. In press. [DOI] [PubMed] [Google Scholar]
- 12.Pearce CL, Near AM, Van Den Berg DJ, et al. Validating genetic risk associations for ovarian cancer through the international Ovarian Cancer Association Consortium. Br J Cancer. 2009;100:412–20. doi: 10.1038/sj.bjc.6604820. [DOI] [PMC free article] [PubMed] [Google Scholar]
- 13.Ramus SJ, Vierkant RA, Johnatty SE, et al. Consortium analysis of 7 candidate SNPs for ovarian cancer. Int J Cancer. 2008;123:380–8. doi: 10.1002/ijc.23448. [DOI] [PMC free article] [PubMed] [Google Scholar]
- 14.Hosmer DW, Lemeshow SL. Multiple logistic regression. In: Hosmer DW, Lemeshow SL, editors. Applied logistic regression. New York: John Wiley and Sons, Inc; 2000. pp. 31–46. [Google Scholar]
- 15.Seidman JD, Kurman RJ, Ronnett BM. Primary and metastatic mucinous adenocarcinomas in the ovaries: incidence in routine practice with a new approach to improve intraoperative diagnosis. Am J Surg Pathol. 2003;27:985–93. doi: 10.1097/00000478-200307000-00014. [DOI] [PubMed] [Google Scholar]
- 16.Samimi G, Ozbun L, Johnson ME, Mok SC, Birrer MJ. Biomarkers of mucinous tumors of the ovary. Dis Markers. 2007;23:389–96. doi: 10.1155/2007/792356. [DOI] [PMC free article] [PubMed] [Google Scholar]
- 17.Puls LE, Powell DE, DePriest PD, et al. Transition from benign to malignant epithelium in mucinous and serous ovarian cystadenocarcinoma. Gynecol Oncol. 1992;47:53–7. doi: 10.1016/0090-8258(92)90075-t. [DOI] [PubMed] [Google Scholar]
- 18.Cuatrecasas M, Villanueva A, Matias-Guiu X, Prat J. K-ras mutations in mucinous ovarian tumors: a clinicopathologic and molecular study of 95 cases. Cancer. 1997;79:1581–6. doi: 10.1002/(sici)1097-0142(19970415)79:8<1581::aid-cncr21>3.0.co;2-t. [DOI] [PubMed] [Google Scholar]
- 19.Bast RC, Jr, Hennessy B, Mills GB. The biology of ovarian cancer: new opportunities for translation. Nat Rev Cancer. 2009;9:415–28. doi: 10.1038/nrc2644. [DOI] [PMC free article] [PubMed] [Google Scholar]
- 20.Sharp L, Little J. Polymorphisms in genes involved in folate metabolism and colorectal neoplasia: a HuGE review. Am J Epidemiol. 2004;159:423–43. doi: 10.1093/aje/kwh066. [DOI] [PubMed] [Google Scholar]
- 21.Derenzini M, Montanaro L, Trere D, et al. Thymidylate synthase protein expression and activity are related to the cell proliferation rate in human cancer cell lines. Mol Pathol. 2002;55:310–4. doi: 10.1136/mp.55.5.310. [DOI] [PMC free article] [PubMed] [Google Scholar]
- 22.Dolnick BJ. Cloning and characterization of a naturally occurring antisense RNA to human thymidylate synthase mRNA. Nucleic Acids Res. 1993;21:1747–52. doi: 10.1093/nar/21.8.1747. [DOI] [PMC free article] [PubMed] [Google Scholar]
- 23.Dolnick BJ, Black AR, Winkler PM, Schindler K, Hsueh CT. rTS gene expression is associated with altered cell sensitivity to thymidylate synthase inhibitors. Adv Enzyme Regul. 1996;36:165–80. doi: 10.1016/0065-2571(95)00009-7. [DOI] [PubMed] [Google Scholar]
- 24.Chu J, Dolnick BJ. Natural antisense (rTSalpha) RNA induces site-specific cleavage of thymidylate synthase mRNA. Biochim Biophys Acta. 2002;1587:183–93. doi: 10.1016/s0925-4439(02)00081-9. [DOI] [PubMed] [Google Scholar]
- 25.Friedman RC, Farh KK, Burge CB, Bartel DP. Most mammalian mRNAs are conserved targets of microRNAs. Genome Res. 2009;19:92–105. doi: 10.1101/gr.082701.108. [DOI] [PMC free article] [PubMed] [Google Scholar]
- 26.Whitehead Institute for Biomedical Research [Internet] TargetScanHuman Release 5.1: April 2009. [December 2009]; Available from: http://www.targetscan.org/vert_50/
- 27.Hsu SD, Chu CH, Tsou AP, et al. miRNAMap 2.0: genomic maps of microRNAs in metazoan genomes. Nucleic Acids Res. 2008;36:D165–9. doi: 10.1093/nar/gkm1012. [DOI] [PMC free article] [PubMed] [Google Scholar]
- 28.Institute of Bioinformatics National Chiao Tung University, Hsinchu, Taiwan [Internet] miRNAMap Release 2.0. [December 2009];2007 July; Available from: http://mirnamap.mbc.nctu.edu.tw.
- 29.Memorial Sloan-Kettering Cancer Center [Internet] microRNA.org: A resource for predicted microRNA targets and expression Release September 2008. [December 2009]; Available from: http://www.microrna.org/microrna/home.do.
- 30.National Cancer Institute [Internet] The Cancer Genome Atlas. [December 2009]; Available from: http://cancergenome.nih.gov.
- 31.Mezzanzanica D, Bagnoli M, De Cecco L, Valeri B, Canevari S. Role of microRNAs in ovarian cancer pathogenesis and potential clinical implications. Int J Biochem Cell Biol. 2009 Dec 24; doi: 10.1016/j.biocel.2009.12.017. Epub. [DOI] [PubMed] [Google Scholar]
- 32.University of Tennessee Health Science Center [Internet] Polymorphism in microRNA Target Site (PolymiRTS) Database. [December 2009]; Available from: http://compbio.utmem.edu/miRSNP/
- 33.Xu WH, Long JR, Zheng W, et al. Association of thymidylate synthase gene with endometrial cancer risk in a Chinese population. Cancer Epidemiol Biomarkers Prev. 2009;18:579–84. doi: 10.1158/1055-9965.EPI-08-0831. [DOI] [PMC free article] [PubMed] [Google Scholar]
- 34.McCarroll SA, Huett A, Kuballa P, et al. Deletion polymorphism upstream of IRGM associated with altered IRGM expression and Crohn's disease. Nat Genet. 2008;40:1107–12. doi: 10.1038/ng.215. [DOI] [PMC free article] [PubMed] [Google Scholar]
- 35.1000 Genomes [Internet] The 1000 Genomes Project. [February 2010]; Available from: http://www.1000genomes.org/page.php.